Local seismic hazard map based on the response spectra of stiff and very dense soils in Bengkulu city, Indonesia
2022-10-18LindungZalbuinMase
Lindung Zalbuin Mase
Department of Civil Engineering, Faculty of Engineering, University of Bengkulu, Bengkulu 38371, Indonesia
Keywords:Earthquake Ground motion Seismic hazard map Spectral acceleration
ABSTRACT It is well known that seismic hazard assessment should be implemented to design infrastructures in an earthquake-prone area such as Bengkulu. This paper presents local seismic hazard maps based on the response spectra of stiff and very dense soils in Bengkulu city, Indonesia. We collect the soil data and conduct the seismic wave propagation. The input motion for wave propagation analysis is generated from the spectral acceleration curves of stiff and dense soils.Various ground motion parameters such as peak ground acceleration, short-period and long-period spectral accelerations, and amplification factors are presented in microzonation maps. The results show that the peak ground acceleration in the study area ranges from 0.2 to 0.8 g,while the spectral acceleration varies between 0.5-1.5 g and 0.4-0.8 g for periods of 0.2 and 1 s,respectively.The amplification factor of the site is observed to vary from 0.5 to 1.6.Considering other spectral accelerations in Bengkulu, the spectral acceleration design shows a good performance. The results indicate the site characteristics of Bengkulu city, which can provide engineers with site class for structural building design.
1. Introduction
Bengkulu city is located on the west coast of Sumatra Island.It is the capital city of Bengkulu province, categorized as a developing city in Indonesia.The growth of infrastructure construction in this region has been remarkable in the last decade.However,this city is also an earthquake-prone area in Indonesia [1], surrounded by several seismotectonic settings, such as the Sumatra subduction,Mentawai fault, and Sumatra fault [2]. The activity of Sumatra subduction has caused at least two large earthquakes with magnitudes larger than MW7.0 in the last 20 years, which has significantly impacted Bengkulu city(Fig.1).Those two large earthquakes are the 2000 MW7.9 Bengkulu-Enggano Earthquake and the 2007 MW8.6 Bengkulu-Mentawai Earthquake [3]. Based on the complexity of the Bengkulu earthquake, Farid and Mase [4]mentioned that the seismic hazard mitigation should be prioritized to support the development of Bengkulu city.
Bengkulu city is an earthquake-prone area,but the development should be continued. Therefore, it is essential to consider the earthquake effect in establishing the infrastructures [5]. The fundamental aspect before constructing is the structural design[6,7].One of the essential things in designing earthquake resistance building is the selection of spectral acceleration for design. In Indonesia, the seismic design code called SNI 1726:2019 [8] is the most updated seismic design code. The concept of composing seismic design code is generally based on probabilistic analysis.For areas with high seismic intensity like Bengkulu, the local seismic design code can be used for structural design. Mase et al. [9] proposed a seismic design code for Bengkulu city considering the local site characteristic,i.e.,soft soil site.The local design is based on the ground motion generated from the soft soil site. According to the probabilistic study in this region,Mase et al.[10]composed maps of seismic hazard zonation for soft soil sites, including peak ground acceleration, spectral accelerations at 0.2 s (representing shortperiod spectrum) and 1 s (representing long-period spectrum),and amplification factors for the scenario of ground motion. These previous studies presented the seismic hazard map that can be used to generate spectral acceleration for structural design. However, these studies only focused on seismic hazard maps based on soft soil input motion,for other site conditions,such as sites of stiff and very dense soils have not been presented yet. Mase et al. [11]mentioned that the assumption of site class considering the uncertainty effect could overcome the limitation of data.Therefore,it is essential to include the local site effects of stiff and very dense soils to depict seismic hazard microzonation maps in Bengkulu city.
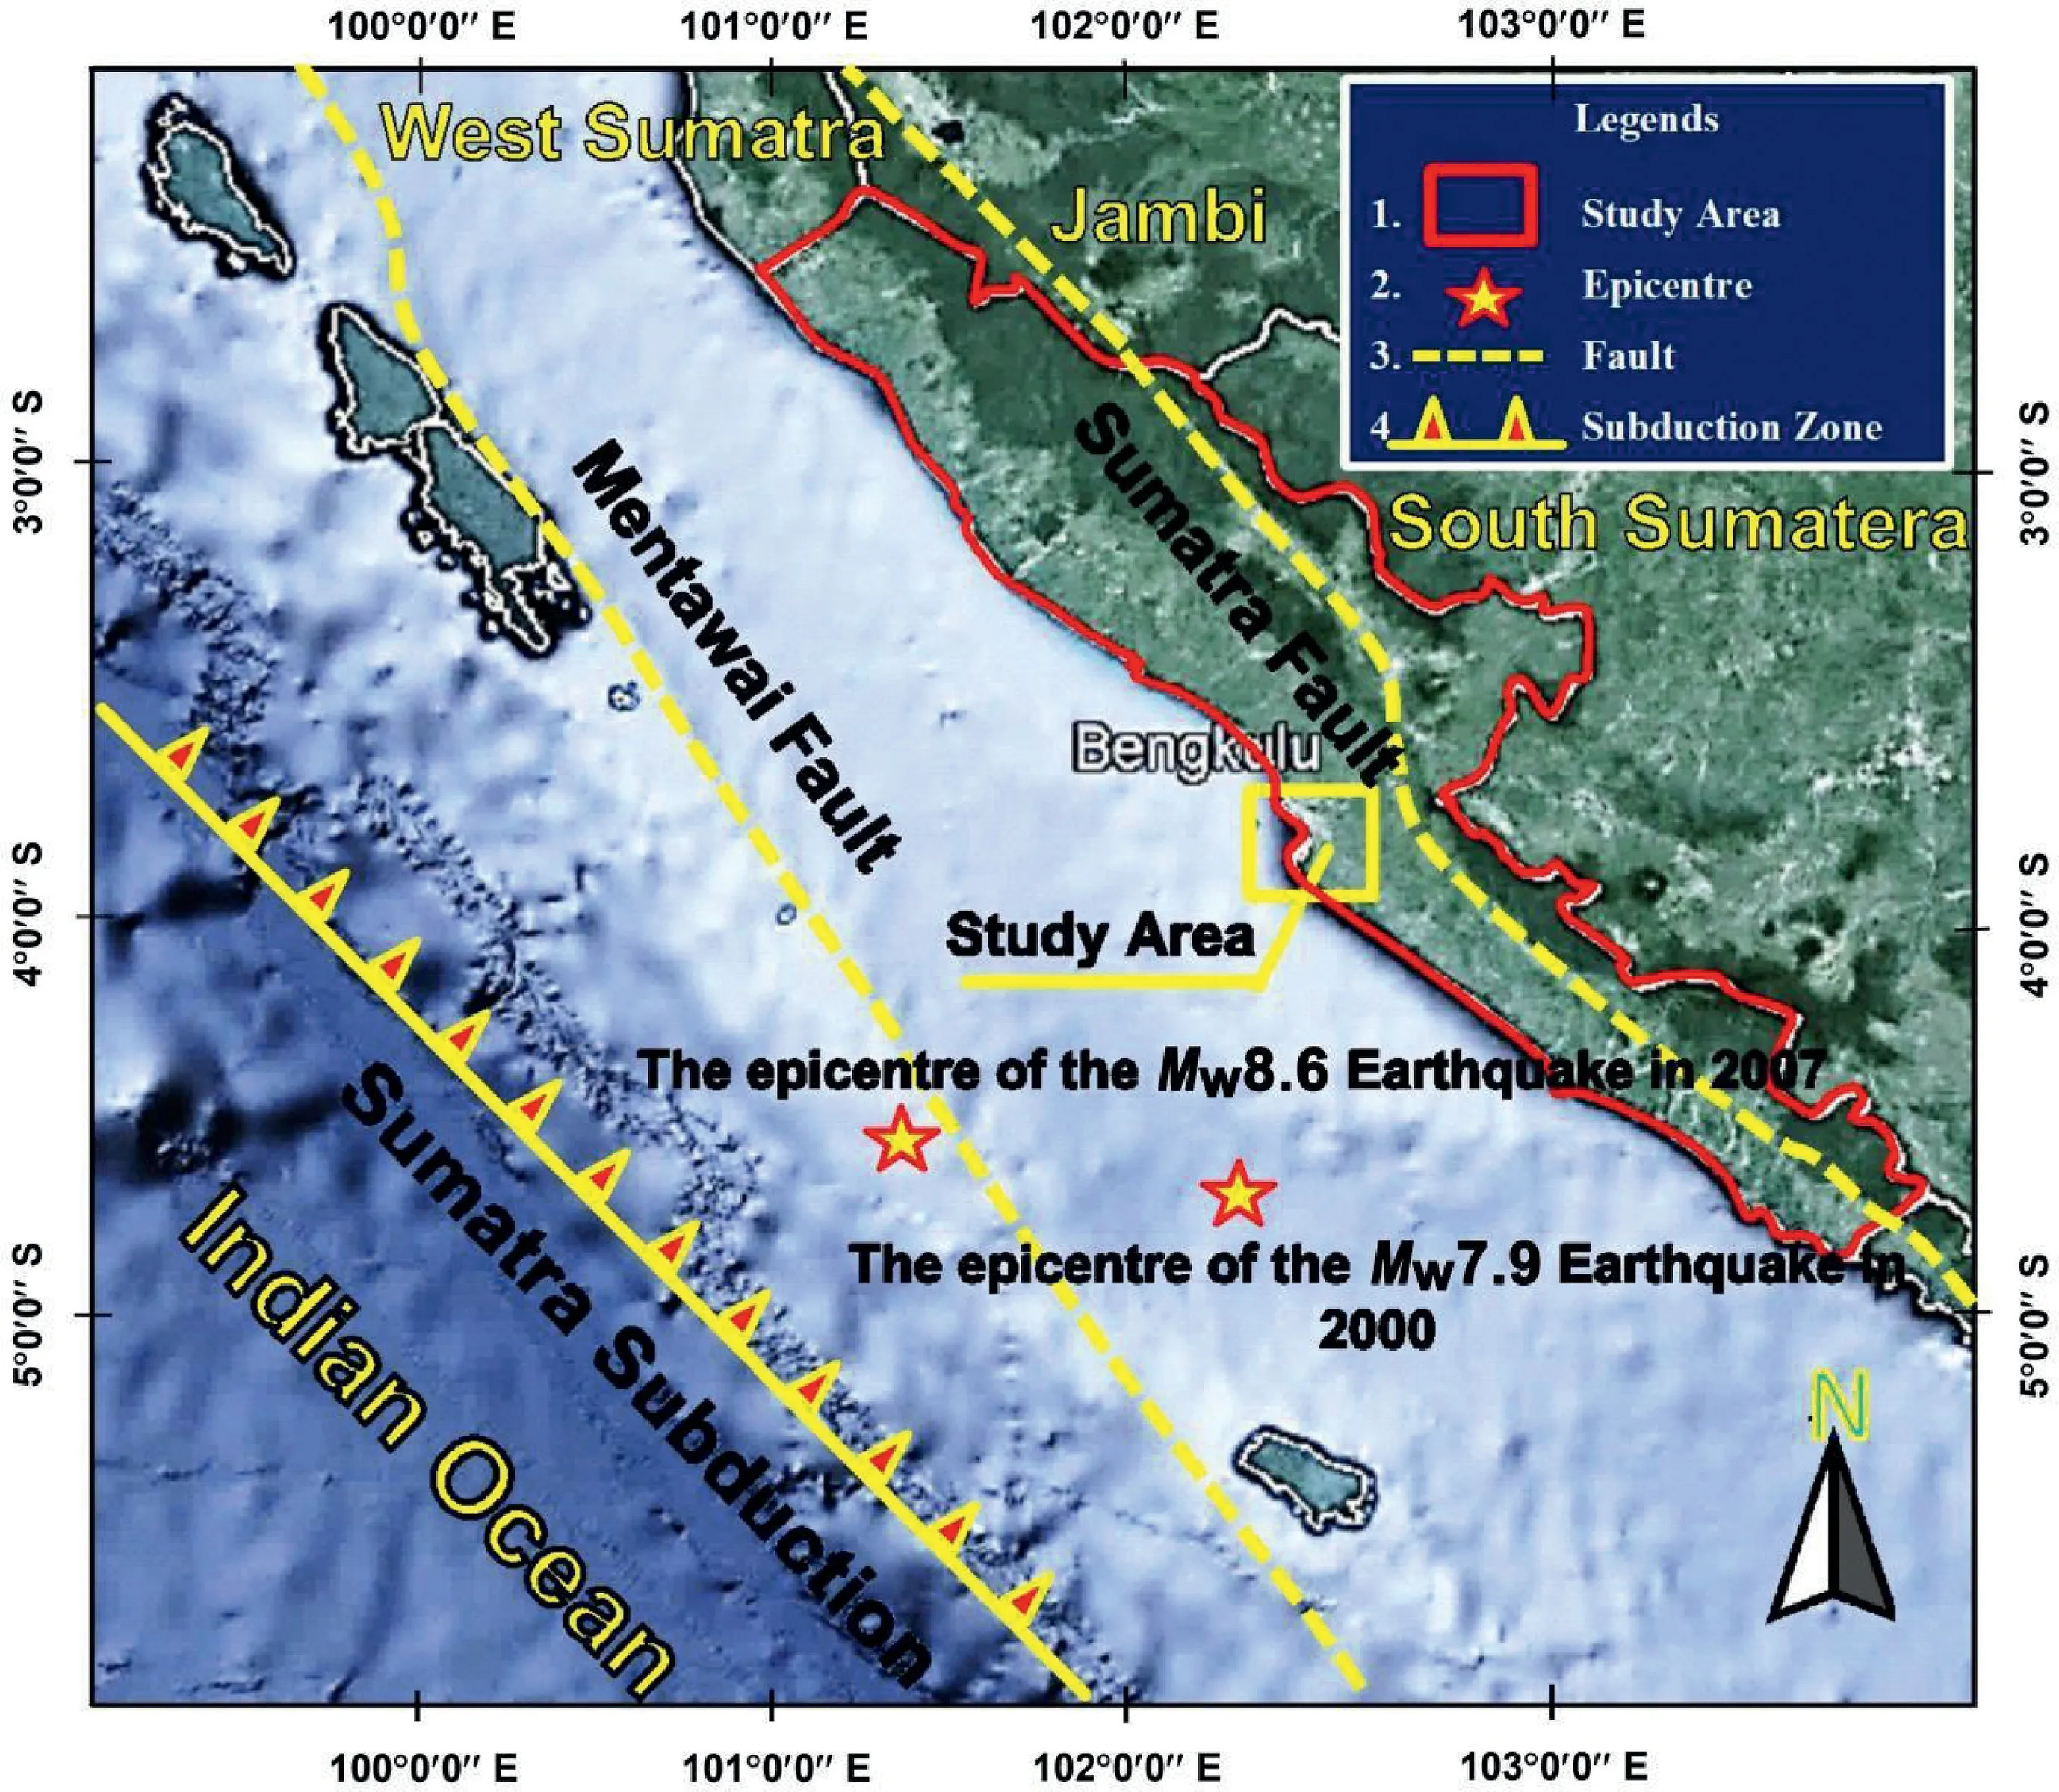
Fig.1. Seismotectonic setting of Bengkulu province (modified from Mase et al. [2]).
In this paper, we collect soil data from previous studies and obtain the input motions of stiff and very dense soils.Then the onedimensional analysis of seismic wave propagation is employed to obtain several ground motion parameters, such as peak ground acceleration(PGA),short-period/long-period spectral accelerations(spectral acceleration at 0.2 s and 1 s), and amplification of peak ground amplification factors. Furthermore, the seismic hazard interpretation is presented in seismic microzonation maps. The comparison between seismic microzonation maps based on stiff and very dense soil sites is discussed. The results show site characteristics of Bengkulu,which can provide engineers with site class for structural building design.
2. Theory and method
2.1. Study area
Bengkulu city is surrounded by several seismotectonic settings,such as the Sumatra subduction,Mentawai fault,and Sumatra fault(Fig. 1). In Fig. 2, a map containing geological formation and the position of site investigation [12] is presented. Bengkulu is composed of various geological settings, including Bintunan formation (QTb), alluvium (Qa), reef limestone (QI), swamp deposits(Qs), alluvium terraces (Qat), and andesite (Tpan). Qat is the dominant formation in the study area,which is composed of sand,silt,clay,and gravel.Several studies conducted by local researchers mentioned that the main typical soils in Bengkulu city are granular[13-15].According to Mase et al.[11],site classes C(very dense soil)and D(stiff soil)are dominant in this city.Class D is generally found in the western part, whereas class C is usually found in the highterrain area in the eastern part. During the Bengkulu-Mentawai Earthquake, liquefaction generally occurred in the west part. In line with the geologic map, the site categorized as class D is relatively dominated by alluvium terraces [11]. Mase et al. [16]mentioned that class D tends to have more potential seismic impacts than class C in terms of vulnerability level.
The layout of the site investigation is also presented in Fig.2.A total of 35 site investigation points spread in the study area. Fig. 3 shows the typical geologic condition in Bengkulu city based on the study of Mase et al.[11].There are five main layers in the study area.Clayey soils dominate the first layer with a thickness of about 1-3 m.The shear wave velocity(Vs)of this layer ranges from 94 to 241 m/s.The second layer,with a thickness of 1-7 m,is dominated by silty clays(CM),the Vsof which varies from 165 to 353 m/s.The third layer is mainly composed of sandy soils classified as silty sand(SM),poor-graded sand(SP),and clayey sand(SC).This layer with a thickness of 1-15 m has Vsranging from 200 to 466 m/s.The fourth layer comprises granular soils classified as well-graded sand(SW),SC,and clayey gravel(GC).The Vsof this layer is about 408-614 m/s,and the thickness is about 1-20 m. The fifth layer is identified as the bedrock surface,which is dominated by sandstone and several coarse materials. The Vson this layer varies from 476 to 760 m/s.
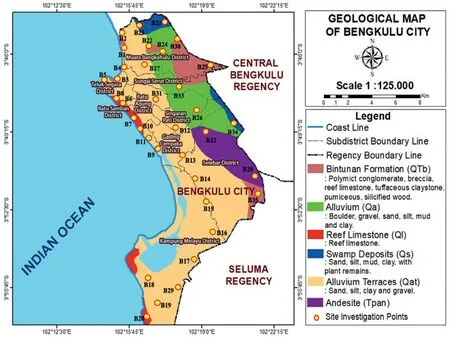
Fig. 2. Geologic map and layout of site investigation (modified from Mase [12]).
Table 1 summarizes the site classes, Vsranges, and dominant materials in the study area. Generally, the Vsranges from 99 to 899 m/s, and the investigated sites are dominated by sandy soils.The time-averaged shear wave velocity for the first 30 m depth(Vs30) is 346 m/s. According to National Earthquake Hazard Reduction Provision (NEHRP) [17], those sites are categorized as classes C and D. Class D has Vs30ranging from 180 to 360 m/s,whereas class C has Vs30ranging from 360 to 760 m/s. In the terminology of soil resistance, a large Vsindicates a large soil density and strength.From a geotechnical perspective,class D site tends to be more vulnerable to seismic impact than class C [18,19]. According to the geological condition of the study area, class D is generally concentrated on alluvial terraces, i.e., the coastline zone and middle part. Class C is usually found in the eastern part.
2.2. Ground motions of specific site classes
Considering the variation of site class, Mase and Somantri [20]presented a study discussing the development of spectral response design for Bengkulu city. Based on the seismic hazard assessment,they developed the spectral acceleration design for local site conditions. The study of seismic effects became the basis for determining the ground motions of specific site classes in Bengkulu city.Fig. 4 presents the ground motions of classes C and D in Bengkulu city [20]. Several factors are selected to generate target spectral acceleration, such as magnitude, the closest distance to rupture,site classes, and so on. This target spectral is used as bedrock spectral acceleration,so that the spectral acceleration is applicable for seismic ground response analysis. A computer program called SeismoArtif is used to generate synthetic ground motion [21]. The framework for generating synthetic ground motion from SeismoArtif is developed from the study of Hallodorson and Papageorgiou[22].Synthetic ground motion is obtained by constructing an adjustment-based synthetic accelerogram. The artificial accelerogram relevant to the target spectrum is determined by adjusting its frequency content based on the Fourier Transform [23]. The design of the synthetic accelerogram was initiated by defining the Gaussian white noise, which was then multiplied by the envelope shape [24]. In order to obtain an accelerogram that follows the recommended envelope shape, various procedures are combined so that the resulting accelerogram can be similar to the real accelerogram. In Fig. 4, the target spectral accelerations are consistent with the matched spectral accelerations. The generated ground motions are also defined based on the matched spectral acceleration, showing peak ground accelerations of 0.306 g and 0.262 g for classes C and D, respectively. In this study, the ground motion from Mase and Somantri [20] is used as the input motion for seismic wave propagation.
2.3. Seismic ground response analysis
In this study,a seismic wave propagation analysis is conducted,and an analysis procedure called lumped-mass system [25] is employed. In Fig. 5, the illustration of the lumped-mass system is presented.Those multilayers have different properties,such as the shear modulus (G), density of soil (ρ), soil mass (m), soil thickness(h), and shear wave velocity (Vs). In addition, several internal parameters like soil damping(c)and stiffness(k)are also included in the system. Details related to the implementation of the lumpedmass system can be found in Hashash and Park [26].
Generally, the seismic wave propagation under this procedure emphasizes the propagating wave at the base of soil mass. Therefore,the elastic half-space at the bottom is a part of the system.The seismic wave initially starts from the bottom and propagates layer by layer. Several outputs can be generated, such as frequency content (spectral acceleration) and time history (acceleration, velocity, and displacement). Nevertheless, there is a criterion for estimating where the elastic half-space is.Adampira et al.[27]and Mase et al.[28]suggested that the elastic half-space or engineering bedrock can be assigned for the layer with Vsmore than 760 m/s.The depth of engineering bedrock surface is generally 30-50 m from the ground surface [29,30].
In this study, the pressure-dependent hyperbolic soil model is employed[30,31].The model is now implemented in a well-known computerized program called DEEPSOILS[32].Pressure dependenthyperbolic model emphasizes the generated hysteresis loop during cyclic loading. The model has a backbone curve defined as the hyperbolic function to determine the reliable hyperbolic curve.The dynamic material properties are determined based on previous studies for the analysis. For cohesionless material, modulus and damping are defined from Seed and Idriss [33], whereas the recommendations of Vucetic and Dobry [34] are employed for cohesion material. For coarse material, the conclusion of Menq [35] on dynamic properties is used.

Table 1 Site data summary (modified from Mase et al. [11]).
2.4. Research framework
The collected site investigation data [11,12] include soil, site classes, and shear wave velocity profiles. We conduct the seismic wave propagation analysis and employ the lumped-mass system integrated with the one-dimensional seismic wave propagation analysis. The engineering bedrock depth for seismic wave propagation analysis is based on studies conducted by Mase [7,29]. For dynamic properties, several models are adopted [33-35]. In addition, the pressure-dependent hyperbolic model from Hashash and Park[25]is employed to obtain several ground motion parameters.Then,the results that can be used to compose microzonation maps are presented.

Fig.4. Ground motions of site classes C and D in Bengkulu city(redrawn and modified from Mase and Somantri [20]).
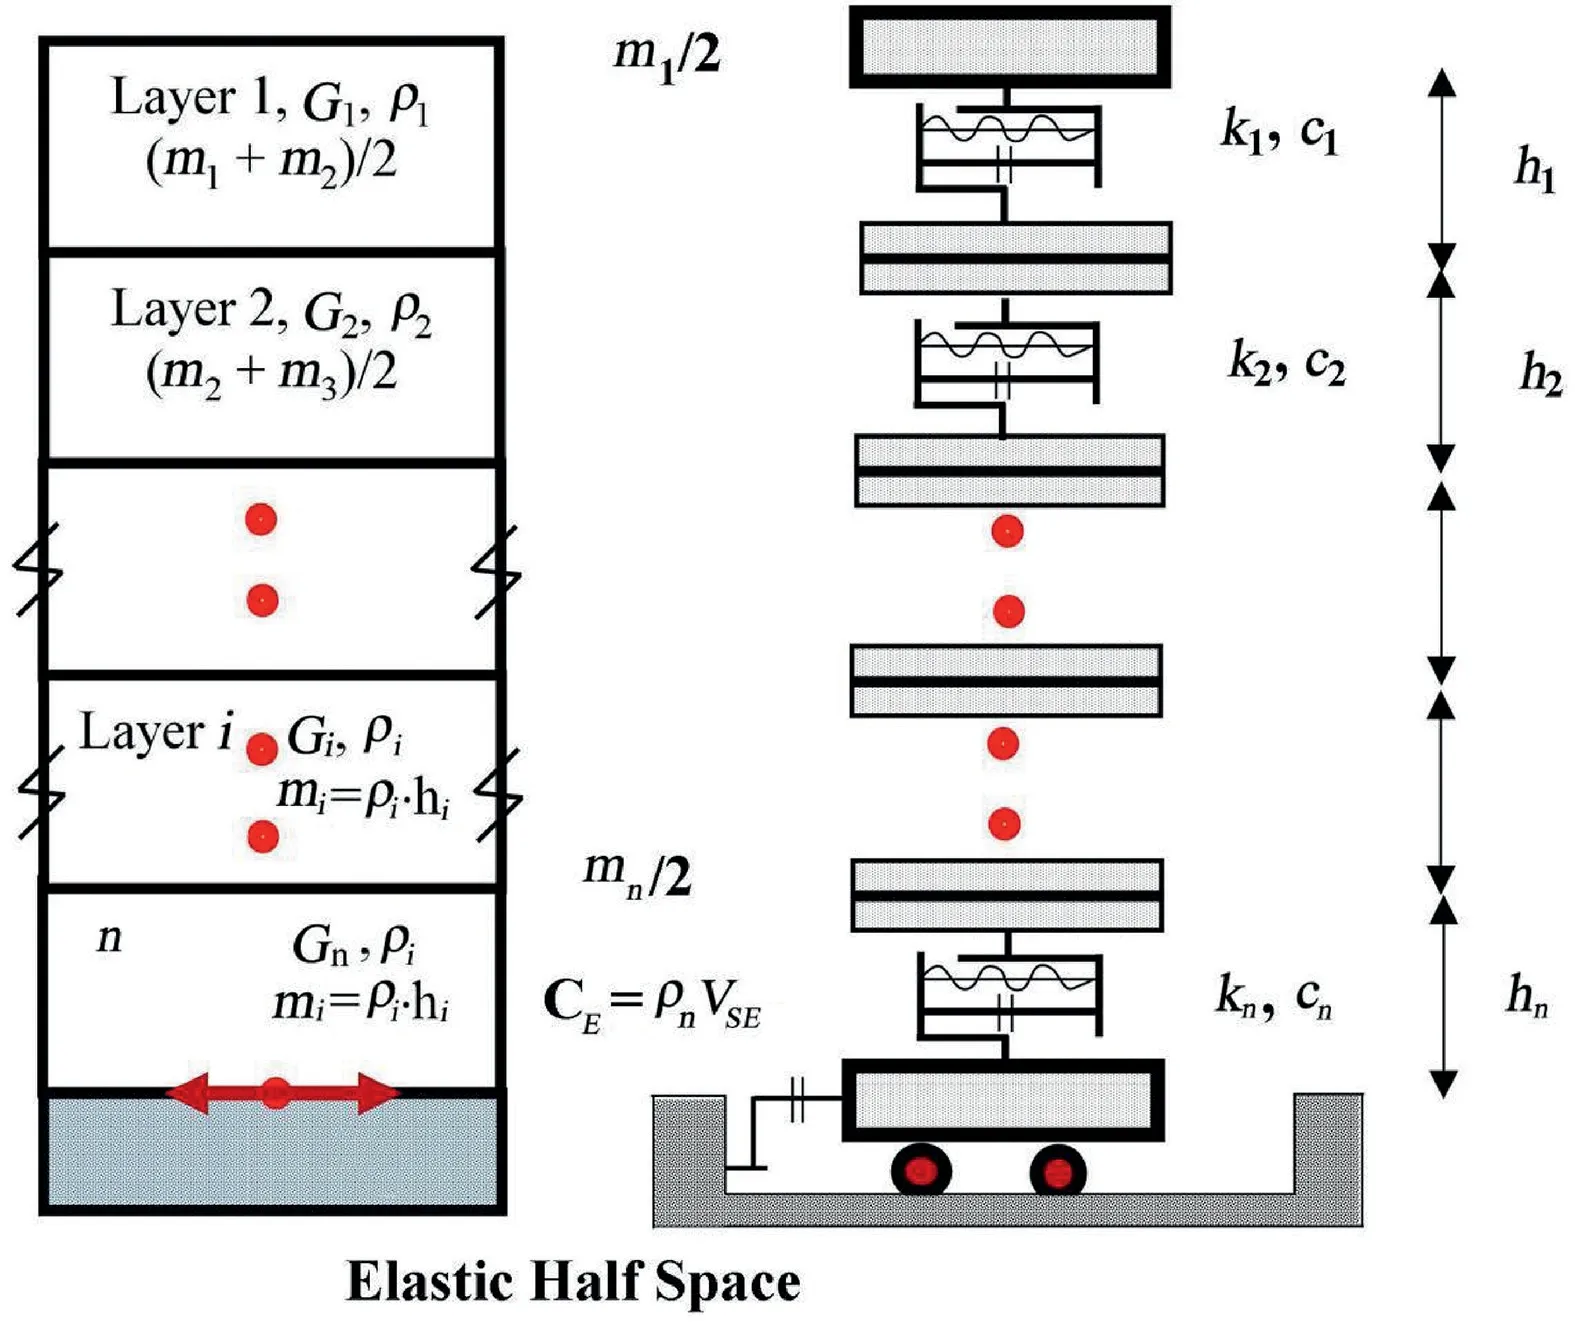
Fig. 5. Lumped-mass system (redrawn and modified from Hashash, Park [25] and Mase [26]).
Parameters including PGA,SA at 0.2 s and 1 s,and amplification factor are obtained from the seismic wave propagation analysis.To obtain the microzonation maps, a mapping combination method based on Kriging and Gridding interpolation [36] is employed. For the application in engineering practice,a design for implementing microzonation maps to obtain spectral acceleration is presented.This study elaborates the selection of ground motion parameters for a certain site.The design spectral acceleration for the site is then compared with the national seismic design code of Indonesia[8].In general, this result can provide information for seismic hazard microzonation in Bengkulu city. The use of local spectral design considering the site classes could facilitate specific analysis for structural building.
3. Results and discussion
3.1. Ground motion parameter from one-dimensional seismic ground response analysis
Table 2 presents the summary of ground motion parameters for seismic wave propagation analysis. Based on one-dimensional seismic ground response analysis, four parameters are collected.The first is PGA,the second is SA at 0.2 s,the third is SA at 1 s,and the fourth is the amplification factor. For PGA, it can be observed that the maximum value due to the seismic wave propagation is 0.844 g,which occurs at site B-24.The minimum value is obtained at site B-27.For SA at 0.2 s,the minimum and maximum values are 0.404 g and 2.124 g,which are observed at site B-27 and site B-25,respectively. For SA at 1 s,the maximum and minimum values are 0.859 g and 0.459 g, which are observed at sites B-27 and B-23,respectively. In terms of amplification factor, the maximum and minimum values during seismic wave propagation are recorded as 1.784 at B-24 and 0.566 at B-27. Based on the amplification factorobtained in this study, it can be estimated that the input motion tends to amplify to the ground surface during seismic wave propagation.
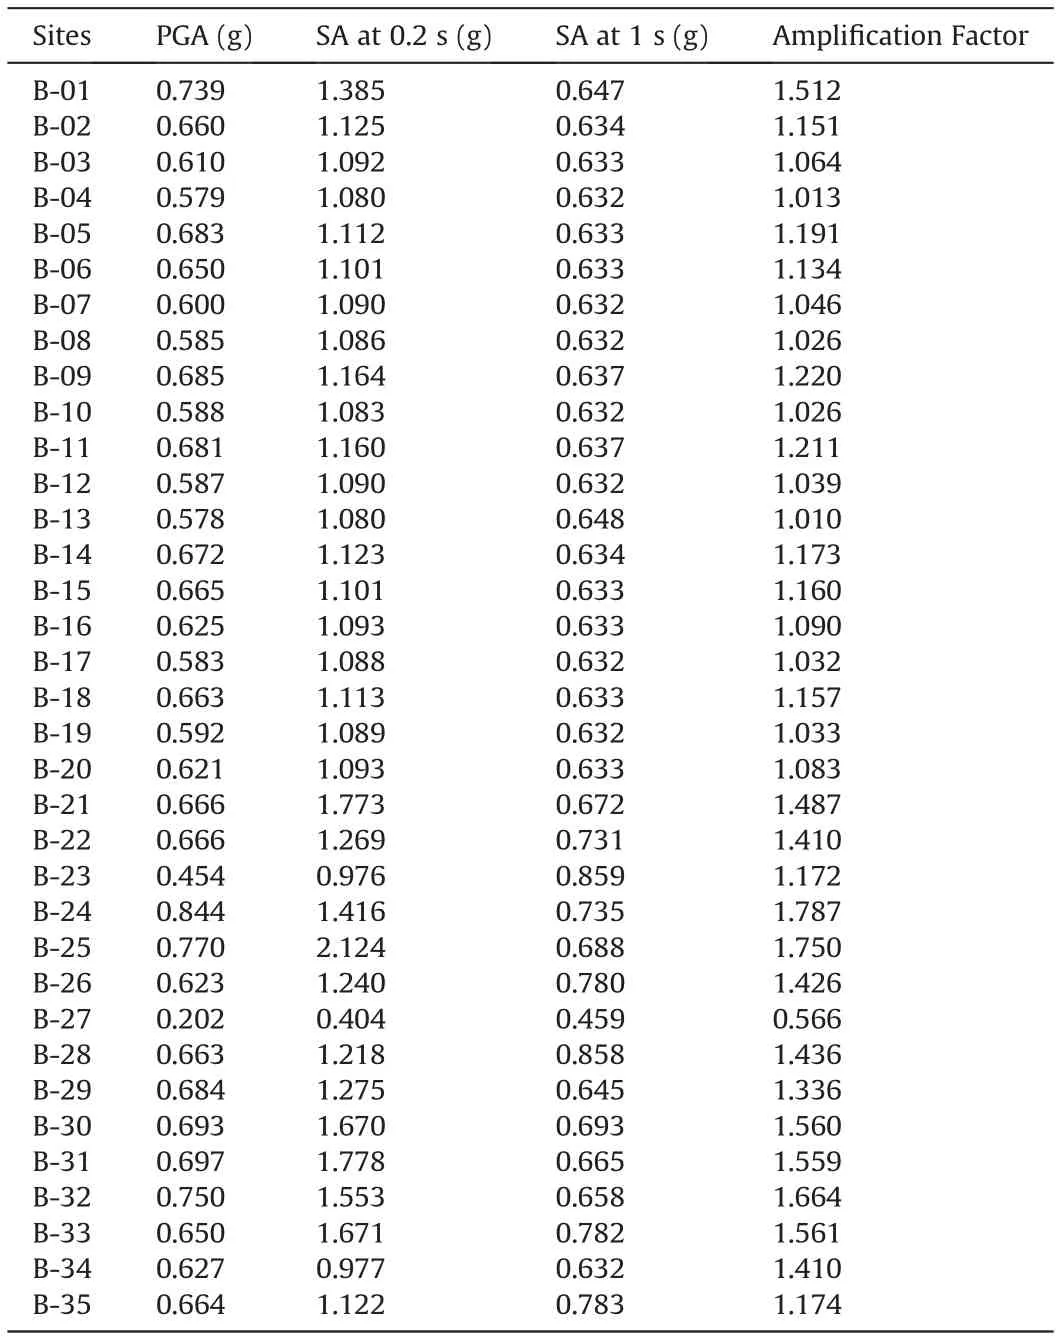
Table 2 Summary of ground motion parameters from seismic wave propagation analysis.
Fig. 6 shows the histogram chart of PGA. The dominant PGA range is 0.6-0.7 g in Bengkulu city.According to SNI 1726:2019[8],the PGA of more than 0.570 g can be considered as a strong motion indication. Therefore, strong earthquakes occurred at most of the sites in Bengkulu city.
Fig. 7 presents the histogram and frequency of SA at 0.2 s. The dominant range of SA at 0.2 s varies from 1.0 to 1.1 g. It indicates that the spectral acceleration for a short period is relatively high during seismic wave propagation. In this case, the short-period spectral represents the response of low-rise buildings. In Bengkulu city, the development of high-rise buildings is still limited. It has been known that the city is an earthquake-vulnerable area.For urban development, the local regulation restricts the number of floors in buildings. Therefore, the information related to SA for a short period is critical.
Fig. 8 shows the histogram and frequency of SA at 1 s. The dominant range of SA is 0.6-0.7 g during seismic wave propagation.Different from SA at 0.2 s,SA at 1 s indicates the response of the high-rise building structure. Both SA values form an important basis for the spectral acceleration design.
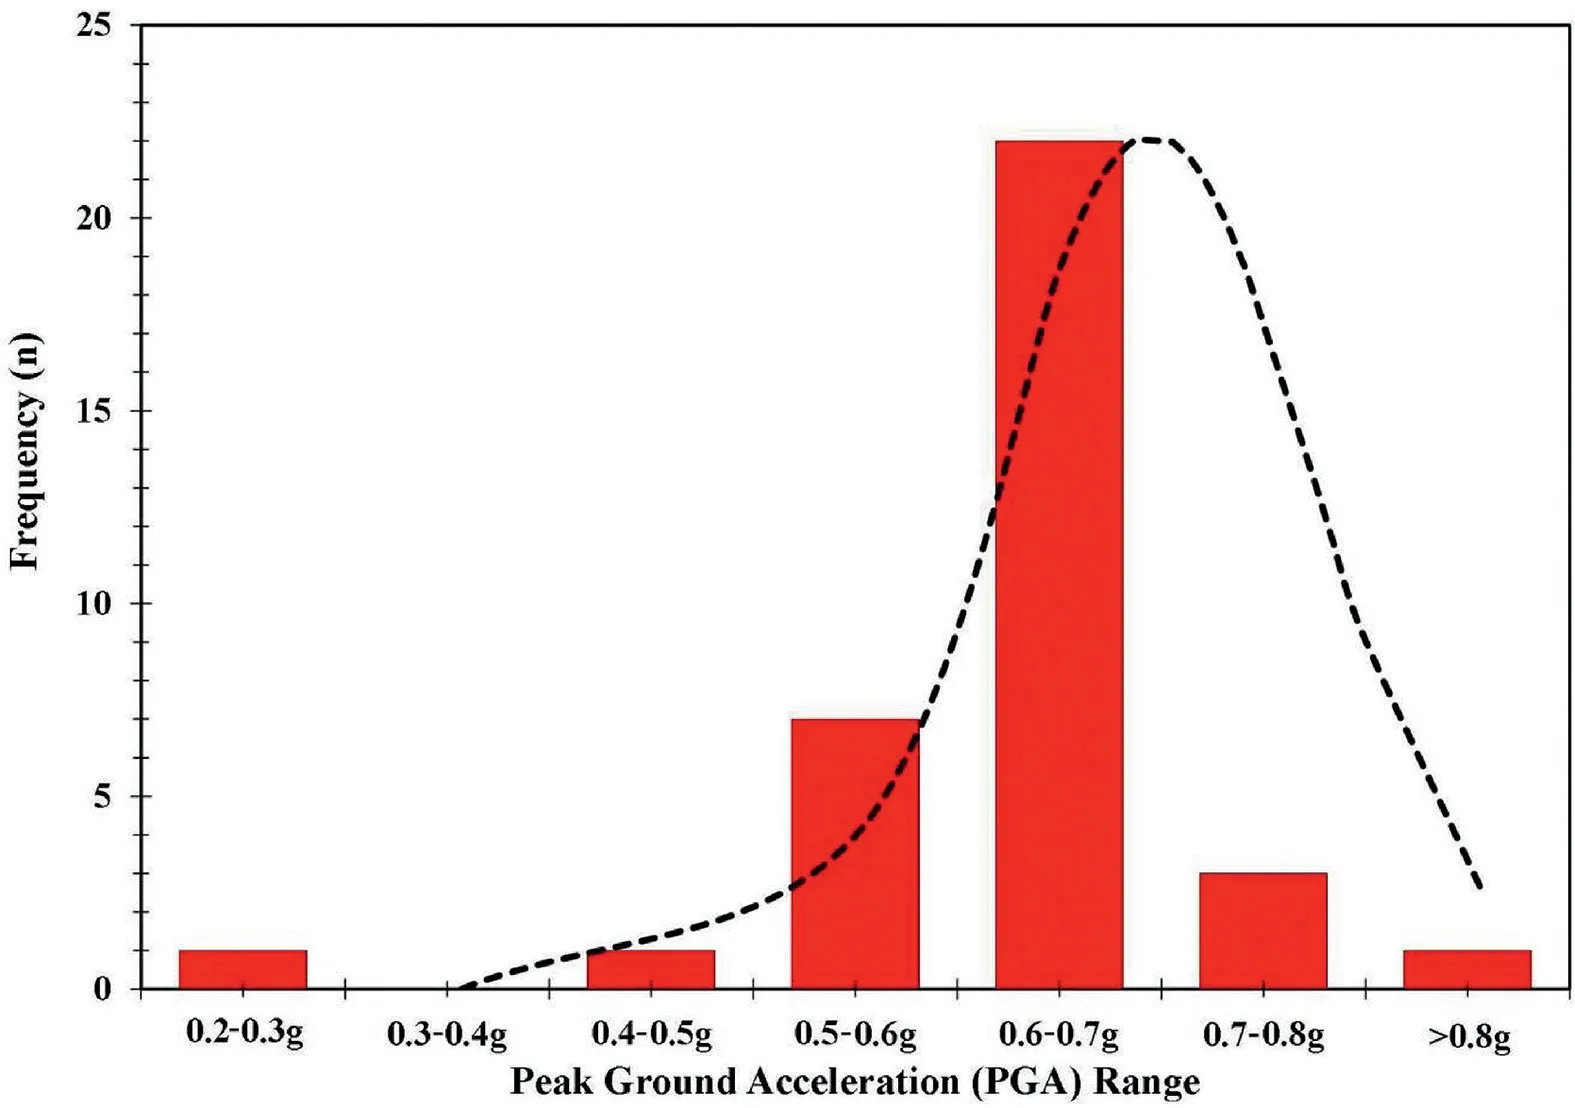
Fig. 6. Histogram and frequency distribution of PGA.
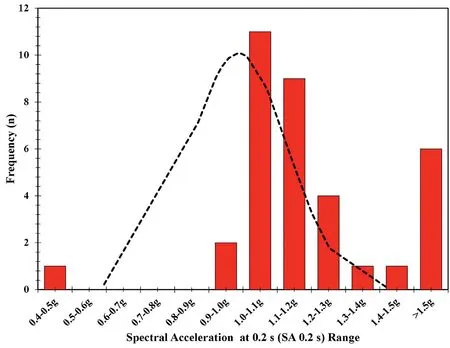
Fig. 7. Histogram and frequency distribution of SA at 0.2 s.
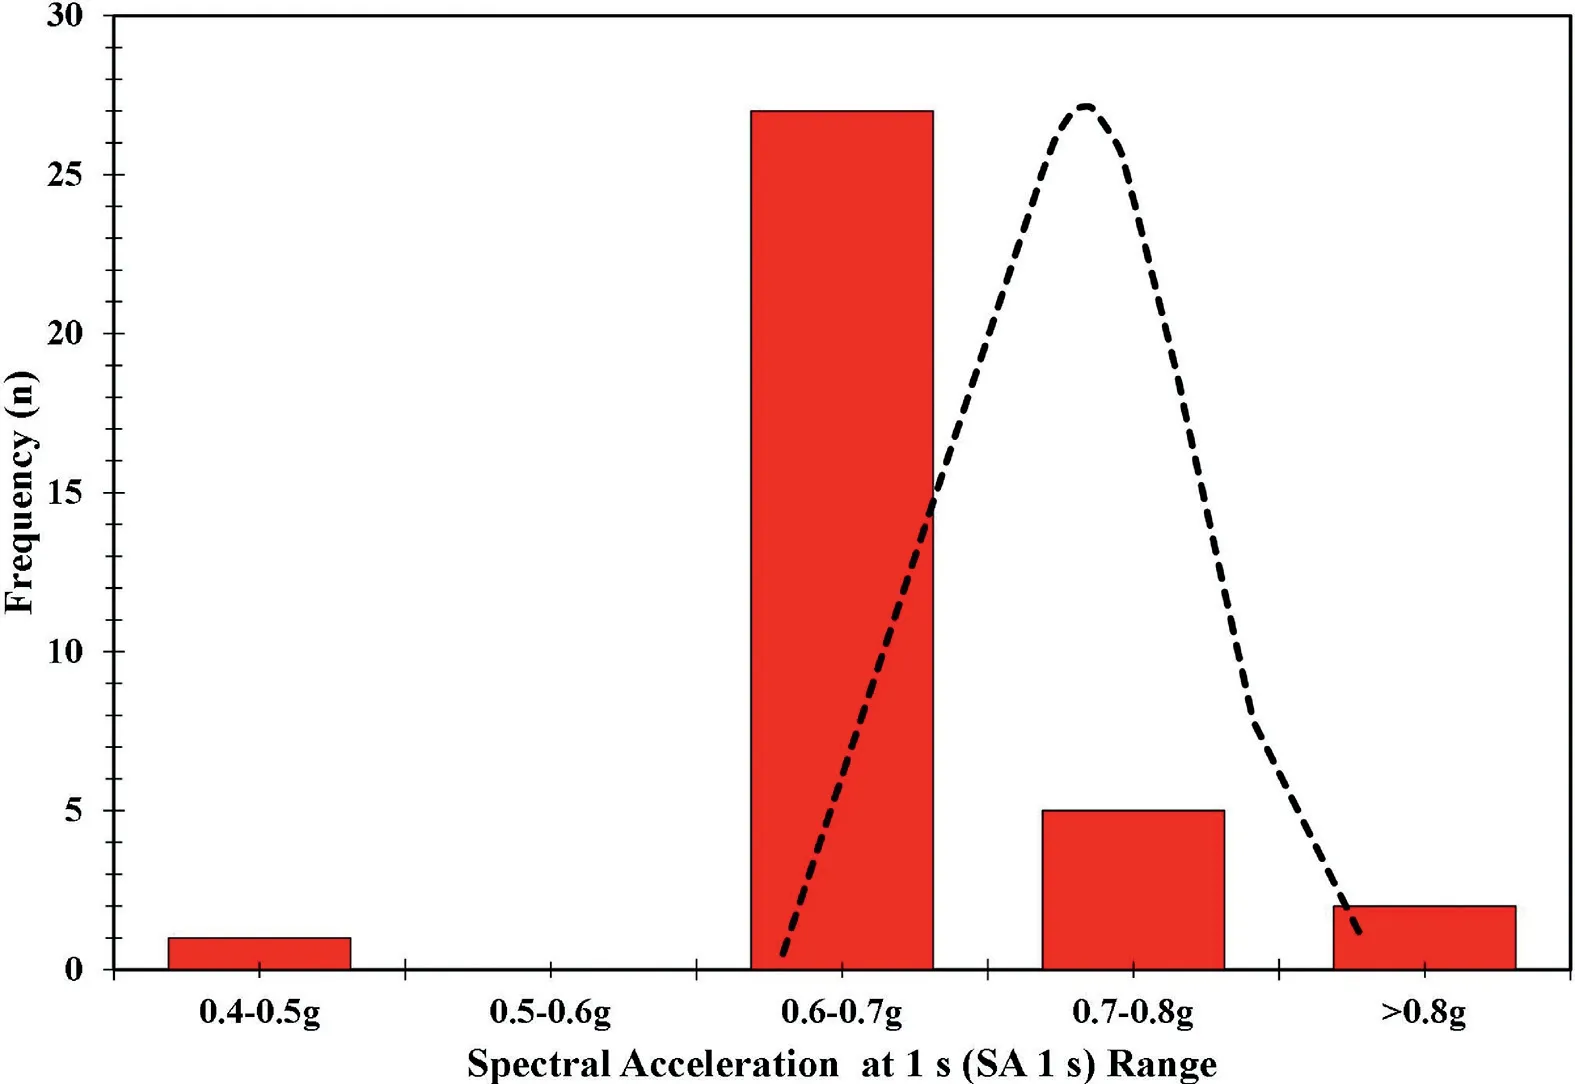
Fig. 8. Histogram and frequency distribution of SA at 1.0 s.
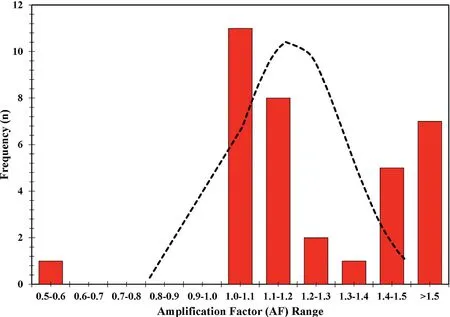
Fig. 9. Histogram and frequency distribution of amplification factor.
Fig. 9 presents the histogram and frequency for amplification factor based on ground response analysis. The amplification factor varies from 1 to 1.1, which indicates that the peak ground acceleration at ground surfaces tends to enlarge up to 1.1 times,especially at investigated sites.
3.2. Seismic hazard microzonation maps
Considering the local site input motion, Fig. 10 presents the microzonation map of PGA obtained during seismic ground response analysis. The PGA in Bengkulu city varies from 0.2 g to more than 0.8 g, which could be caused by the variation of site condition, the existence of bedrock, and the interaction between sediment and rock surface during seismic wave propagation. It is worth noting that the ground motion is influenced by the ground type[37-39].In this study,the ground variation is represented by the existence of soil profile and shear wave velocity in seismic ground response analysis.Therefore,the effects of uncertainty and the distribution of measurement points have been taken into account in obtaining ground motion parameters, especially the peak ground acceleration. Fig. 10 also shows that the range of PGA is mainly between 0.6 and 0.7 g. According to Ref. [12], PGA in the study area varies from 0.2 to 0.4 g.Compared with the results of this study,it indicates that the seismic impact in Bengkulu city could be greater once the effect of local site conditions is considered in seismic ground response analysis.

Fig.10. Seismic microzonation map for PGA in Bengkulu city.
Fig. 11 shows the seismic microzonation of SA at 0.2 s varied from 0.4 g to more than 1.5 g. Generally, there are three main intervals of SA at 0.2 s in Bengkulu city. The first one is the range of 1.0-1.1 g, the second is the range of 1.1-1.2 g, and the third is the range of 1.2-1.3 g.Those ranges are observed along the coastline.A larger SA at 0.2 s means a larger response of the low-rise building.In agreement with the study by Mase[12],SA at 0.2 s varies mainly between 0.7 and 1.1 g.It means that once the local site condition is considered in analysis, SA at 0.2 s tends to be larger.
The seismic hazard map of SA at 1 s is presented in Fig.12.It can be observed that SA at 1 s varies from 0.4 g to more than 0.8 g,and the main range is 0.6-0.7 g. SA at 1 s represents the response of long-period building or high-rise building.Compared to SA at 0.2 s,the range of SA at 1 s is not much varied.According to Mase[12],SA at 1 s based on the deterministic scenario tends to be lower than the local site scenario. Therefore, it can be concluded that the response during the earthquake in Bengkulu city could be larger over a longer period once the local site motions are considered.As presented in Fig. 2, the area along the coast of Bengkulu city is dominated by alluvium terraces[9,12].According to Mase et al.[11],the sites dominated by alluvium terraces are classified as class D.The sites dominated by andesite and alluvium are classified as class C,which has a larger soil resistance compared to site class D.class D tends to have larger spectral acceleration in short periods. Consistent with the geological map, the amplification factor, SA at 0.2 s,and SA at 1 s are generally larger at class C.

Fig.11. Seismic microzonation map for SA 0.2 s in Bengkulu city.
Fig.13 presents the amplification factor map from seismic wave propagation analysis. In this study, the amplification factor is calculated based on the ratio between peak ground acceleration at the ground surface and peak ground acceleration of input motion.Those parameters are used to demonstrate the possibility of motion amplification during the earthquake. The physical properties of the soil and engineered bedrock were considered in the ground response analysis.Therefore,the identification of the amplification factor can be used to estimate the magnification of the acceleration [40-42]during the earthquake. Fig. 13 shows that the amplification factor ranges from 0.5 to more than 1.5. In general, amplification factor ranging from 0.9 to 1.1 is dominant in the study area,especially in the western part. The deterministic study [12] indicates that the amplification factor varies from 0.8 to 1.8, which means that amplification factor based on deterministic scenarios tends to be more variable than that based on local site conditions. The finding also shows that the dominant amplification factor is generally at site class D. The amplification factor, PGA, SA at 0.2 s, and SA at 1 s are essential to generate the designed spectral acceleration in an area.
3.3. The comparison of spectral accelerations
The study aims to observe the performance of proposed seismic hazard maps corresponding to the actual condition, and a comparison with the seismic design code is conducted. In this study,two sites called B-13 and B-24 are selected as the representative sites. B-13 belongs to site class D, and B-24 represents site class C.Several published design spectral accelerations are compared with spectral accelerations at B-13 and B-24 [9,12]. It should be noted that the seismic design code of SNI 1726:2019 is proposed based on probabilistic seismic hazard analysis [9].

Fig.12. Seismic microzonation map for SA 1 s in Bengkulu city.
In Fig. 14, the performance of local spectral acceleration(deterministic and probabilistic)is presented.For class C,the local spectral acceleration at B-24 tends to be significantly larger than other spectral acceleration. It indicates that the use of spectral acceleration considering the local site condition for class C is relatively more conservative than the other two spectral accelerations.Based on Fig.11,the larger SA at 0.2 s is generally found at areas dominated by class C. Therefore, it may be the reason why the designed spectral acceleration for class C tends to be higher for a short period. Based on Mase et al. [11], site class C with thin sediment thickness or shallow engineering bedrock generally occurred in the eastern part of Bengkulu city. It can be estimated that sites classified as class C tend to have larger shear wave velocities or relatively dense soil materials. Misliniyati et al. [43]mentioned that thin sediment thickness means a larger spectral acceleration amplitude at the ground surface.Based on the study conducted by Falcone et al. [44], spectral acceleration for a shallow engineering bedrock tends to have a larger spectral acceleration amplitude, especially at short periods. The findings in this study regarding the spectral acceleration response of site classes are generally consistent with these previous studies[45,46].Klimis et al.[45]suggested that the short-period spectral acceleration of site class C is generally high. Sokolov et al. [46]mentioned that various geological conditions and weathering effects on the underground layer could influence it. This effect seems to be related to the site condition in Bengkulu city, which has various geological conditions. Therefore, it would also affect the amplification effect in the study area. The detailed investigation of site amplification factors and acceleration response spectra of shallow bedrock sites will be presented in further studies.
For site class D (B-13), the designed spectral acceleration under local site conditions also tends to be larger than spectral accelerations from SNI 1726:2019 [9] and Mase [12]. The spectral acceleration of class D is also larger,especially at short periods.It indicates that spectral acceleration of site class D also tends to be more conservative compared to the spectral accelerations from SNI 1726:2019 [9] and Mase [12]. Depending on the infrastructure development, the proposed spectral acceleration emphasizes short to medium periods, i.e., 0.1-0.6 s. These ranges indicate the period of low to medium rise buildings. Now, the establishment of buildings is still limited to 5 to 6 floors.Generally, the use of local spectral acceleration can produce a better seismic design code because the obtained spectral acceleration has considered the site condition and seismic wave propagation. The result of this study can be implemented for infrastructure construction.

Fig.13. Amplification factor map for Bengkulu city.
4. Conclusion
This study is conducted based on the condition of Bengkulu dominated by classes C and D.Therefore,it is necessary to propose a seismic design considering local site conditions in Bengkulu. The seismic wave propagation analysis is conducted. Then we present seismic hazard microzonation maps and the implementation of spectral acceleration. Several conclusions can be drawn.
1. Based on microzonation maps, the variations of PGA, SA at 0.2 and 1s, and amplification factor are dominant in areas located on the coastline of Bengkulu city. This is also related to geological type, where the difference between the response of classes C and D depends on geological conditions. A dominant response range generally occurs at the border between alluvium terraces and other geological formations. This is usually reflected by SA at 0.2 and 1 s.
2. The implementation of the local spectral acceleration proposed in this study shows a better performance. Since the site condition is considered as a parameter for seismic wave propagation analysis, the results of spectral acceleration show a higher response.Once the local spectral acceleration is considered,the structure tends to have a better earthquake resistance than that considering the probabilistic and deterministic spectral acceleration. Therefore, the local spectral acceleration could be addressed for long-term purposes.
3. This study provides a comprehensive procedure for generating local spectral acceleration based on seismic hazard assessment,seismic wave propagation and actual geological condition,which could be used as a recommendation to realize integrated seismic hazard mitigation, especially in Bengkulu city.
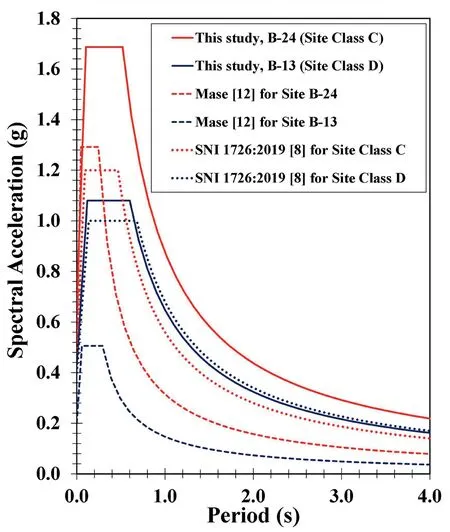
Fig.14. Spectral acceleration comparison.
Author statement
Lindung Zalbuin Mase: Conceptualization, Investigation, Data Collection, Analysis, Methodology, Software, Writing - review &editing.
Conflicts of interest
The author declares that there is no conflicts of interest.
Acknowledgments
This research was supported by the Mandatory Research Fund from the University of Bengkulu,with Grant No.3968/UN30.15/LT/2018.The author also would like to thank Ms.Putri Widia Anggraini(B.Eng), Ms. Sintia Agustina (B.Eng), and Mr. Muharram Nur Fikri(B.Eng) for their assistance in analyzing one-dimensional seismic ground response analysis and seismic microzonation maps. This study is also conducted under Japan ASEAN Science Technology Innovation Platform (JASTIP) WP-4, 2022.
杂志排行
Geodesy and Geodynamics的其它文章
- A new polar motion prediction method combined with the difference between polar motion series
- Insights into spatio-temporal slow slip events offshore the Boso Peninsula in central Japan during 2011-2019 using GPS data
- Coastal transgression and regression from 1980 to 2020 and shoreline forecasting for 2030 and 2040, using DSAS along the southern coastal tip of Peninsular India
- Thermospheric density responses to Martian dust storm in autumn based on MAVEN data
- Crustal structure of the Qiangtang and Songpan-Ganzi terranes(eastern Tibet) from the 2-D normalized full gradient of gravity anomaly
- Possibilities of mapping neotectonic elements based on the interpretation of space images: A study of Fergana Depression