Possibilities of mapping neotectonic elements based on the interpretation of space images: A study of Fergana Depression
2022-10-18UmurzakovRakhimjanAbdurazakovichRabbimkulovSamariddinAsatovich
Umurzakov Rakhimjan Abdurazakovich, Rabbimkulov Samariddin Asatovich
Tashkent State Technical University, Tashkent, Uzbekistan
Keywords:Neotectonic elements Faults Lineaments Space images Uplifts and depressions
ABSTRACT For the current geological mapping of individual territories, remote sensing and geographic information system(GIS)technologies are widely used.Taking the Fergana depression as an example,this paper aims to determine the possibilities of using remote sensing materials for mapping structural and geomorphological elements. Landsat-8 satellite imagery obtained on 11 spectral channels was used to highlight the decoding features.Fault zones, lineament zones,various uplifts,depressions,and structural material complexes of different ages were identified.Based on the in-depth analysis of geological and geophysical data, a geological schematic map of the Fergana depression was developed. Using geological landscape and automated methods for deciphering space images, the main neotectonic elements of the Fergana depression were identified:the southern step,northern marginal slope,central graben-syncline,flexurefault zones,local anticlinal zones,individual uplifts/depressions, and local shear zones.The results show a neotectonic map of the study area,which can be used as a tectonic basis for prospecting,seismic zoning mapping, and geological engineering development.
1. Introduction
Currently, the improvement of geological exploration is a major priority in determining new reserves of mineral deposits.The organization of prospecting operations requires a comprehensive accounting of all known factors affecting the distribution of oil and gas deposits. Among them, the neotectonic element is one of the most important factors. This is evidenced by the locations of the largest oil deposits in various regions of the world[1-3],which are associated with certain areas of high neotectonic activity in the Earth's crust. One of them is a large oil field in the Gulf of Dezful,located in the Zagros fold belt.It is noted that in the Neogene, orogenic movements began to dominate sharply in the Dizful, which continued in the late Miocene and Pliocene. These recent movements led to the formation of the Asmari and Sarvak reservoirs,while the rocks of the Albian Kazhdumi formation and the upper part of the Pabde formation (middle Eocene to early Oligocene)were the source of oil[2].The recent movement of the folds led to the destruction of carbonate limestones and marls,which became the cause of increased subvertical migration of hydrocarbons to the reservoirs[2].It can be seen that neotectonic elements are the main determinants of the location of the deposits here.
Neotectonic factors are also significant for the formation of hydrocarbon accumulation conditions [3]. Here, they play more of a role in structure-controlling factors. In the example of the Siniane Triassic and Sichuan basins, the formation and distribution of oil and gas deposits are associated with the features of tectonic differentiation.There are three main groups of factors:1)the position of the tectonic graben, which determines the distribution of the original oil source rocks and is the center of hydrocarbon generation;2)the presence of deep faults and paleo-uplifts,which are the results of the joint manifestation of denudation, sedimentation,and folding; 3) the presence of overlapping areas of tectonic activations in different periods,which is favorable for the formation of large hydrocarbon deposits [3].
Based on neotectonic and geological-geochemical criteria, the researchers proposed a prospective scenario of the oil and gas potential of the Paleogene clay rocks[4].In Ref.[5],the influence of neotectonic processes on the formation of oil and gas condensate deposits in Azerbaijan was analyzed.
With the involvement of modern computer technology and remote data, it is necessary to improve the mapping of the latest structural elements of the crust in oil and gas regions.The possibilities of using space images for solving similar problems in the field of oil and gas geology have been extensively discussed in previous studies.Based on remote sensing data,the most promising areas for oil and gas were identified [6]. A method of using space images in structural geomorphological studies was proposed [7,8]. In some works on Uzbekistan,it is also noted that the tectonic development regime determines the geological structural and material features of oil-producing strata [9-11], exerting a decisive influence on the formation of oil and gas accumulation traps.The issues of the effect of neotectonic movements on the location of oil and gas deposits have been studied[12,13].The relevance of the considered subject is also determined by the fact that the material on the Fergana depression neotectonics was available as early as the 1970s-80s.
Analysis of the tectonic zoning maps used for prediction and prospecting in the study area showed that the tectonic zoning schemes for the Fergana depression were based on various data that do not quite accurately reflect the tectonic elements of the region.For example,the basis of the tectonic zoning scheme was a structural map along the top of the upper Cretaceous horizon[14].On the map described in Ref. [15], the identification of tectonic elements was carried out based on a structural map of the surface of the Turkestan layer of the Paleogene, where the deformation elements of the entire Mesozoic-Cenozoic sedimentary layer were taken into account. The tectonic scheme in Ref. [16] was obtained from geophysical data without considering geomorphological materials. The tectonic zoning scheme in Ref. [17] was developed according to the concept of the depression formation mechanism as a result of tangential compression.However,it does not consider the magnitude of vertical deformation amplitudes in recent times,making it impossible to assess the size and shape of neotectonic structural elements correctly. In addition, almost all faults were attributed to the reverse-thrust type. The existing updated 1971 tectonic map edited by L.A.Polkanova,with a scale of 1:1,000,000,does not provide a detailed description of the latest tectonic elements of the Fergana depression [17].
Therefore, it is necessary to update the data with new technologies.This paper aims to determine the information possibilities of using remote sensing materials for mapping the structural and geomorphological elements of the Fergana depression. Based on satellite images, a study of geomorphological forms, folded structures, and faults was carried out under certain geological conditions.Remote sensing,GIS,and the reliability of their data make it possible to obtain datasets on the tectonics and neotectonics of the region, which can be used to determine the geological-structural boundaries and geomorphological elements. Using modern digital space images is aimed at solving urgent problems of prospecting work to identify and evaluate promising areas [18-22]. The use of satellite images is essential for studying the modern landforms and the structure of territories,which can determine the degree of their expression in Mesozoic-Cenozoic deposits and the Palaeozoic basement.
An overview map of the study area is shown in Fig.1.The Fergana depression is an intra-orogenic intermountain depression. It is bounded by the mountain uplifts of Alai and Turkestan systems in the south, by the Fergana mountain in the northeast, and by the Chatkal-Kurama mountain in the north and northwest.The absolute height of mountain structures is approximately 5 km. The southwestern part of the depression gradually narrows to the passage exit of the“Fergas Valley”,where the bed of the Syr Darya River passes. The Syr Darya is the main water artery, formed by the confluence of the Naryn and Kara Darya rivers in the eastern part of the depression. Based on the palaeotectonic analysis, it was established that the formation of the depression occurred in the Mesozoic-Cenozoic with a sharp increase of movement in the Neogene-Quaternary. The total range of neotectonic movements is about 12 km. The Palaeozoic folded base reaches a depth of 15-18 km.
The solution of various geological problems using satellite images was carried out based on small- and medium-scale aerial photogeological mapping of individual regions in the Republic of Uzbekistan. After many years of research, the criteria have been developed not only for minerals, but also for nonmineral deposits using different spectral ranges of space images [19-22].
2. Materials and methods
With the application of modern GIS technologies, we used geological data and multispectral satellite images from Landsat 8 and the Shuttle Radar Topography Mission (SRTM). Over the past two decades,decoding methods have been significantly developed,including the use of software tools and methods for improving the accuracy of the received information [6,7,21-25]. Decoding is carried out in three stages: 1) improvement of the quality of the dataset using principal component analysis(PCA);2)line detection as a result of quality improvement;3)lineament classification using visual interpretation[20].Studies from the use of individual data to the identification of predictive areas are becoming complex.One of these approaches is to develop a remote complex for predicting structural forms[20].The identification and mapping of lineaments is noted as an integral part of geological research.Researchers have identified different stages in the selection of lineaments. At the same time, the use of spatial images increases the information content and quality of the determined geographic data, making it possible to visually decipher and classify the lineaments[20].It also became possible to use Digital Elevation Models (DEMs) for hydrological surveys to study various forms of groundwater resources and drainage systems.In addition,a new approach was developed to separate different tectonic blocks and lineaments using Landsat,QuickBird and ALOS PALSAR satellite images. At the same time,with the help of field geological studies, by constructing rose diagrams,an reliability assessment of the lineaments was made in the zone of the Alpine-Himalayan orogenic belt [8].
Cosmogeological studies in the geosynclinal and platform have been carried out using images from modern satellites at various scales. Examples include Landsat-7, Landsat-8, Aster (TERRA),Quick Bird, DEM, SRTM, Open Topography, ALOS-2, and others.Small-scale (1:500,000, 1:1,000,000) and medium-scale(1:100,000, 1:50,000) Landsat-8 multispectral space images were used to identify the structural and geomorphological elements of the Fergana depression. At the same time, satellite images were processed step by step using computer programs such as ArcGIS Desktop,ERDAS Imagine,ENVI,Global Mapper,and QGIS.First,the geological information content of the satellite images used to study the morphostructure is analyzed. Then, traditional deciphering methods are adopted. Automated algorithms for visual, landscape indication, and GIS technologies are consistently applied.
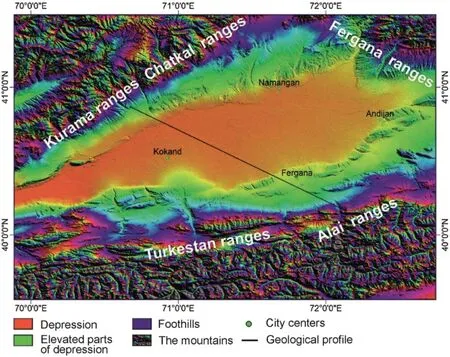
Fig.1. Overview map of the study area.
The stage of visual interpretation is presented in the form of RGB compositions with the selection of the optimal options for spectral channels. From the point of view of information expression, the selected RGB channels can be linked with the data presented on geological maps of small and medium scales. In addition, to obtain high-quality multispectral Landsat-8 space images using the ENVI program, some radiometric and atmospheric correction operations are carried out using four channels of satellite images of the Fergana depression. After processing space images, the variations of light indicators were eliminated for all 11 channels. In addition, various defects caused by the influence of the terrain and the atmosphere were removed. Then,the ray absorption/loss under the influence of the atmosphere was eliminated, and the energy brightness of each pixel of digital space images was achieved [26]. Due to the preprocessing of the northern, central, and southern parts of the Fergana depression,better quality images were obtained,reflecting structural material complexes and fault zones at different time intervals.At the same time,an SRTM digital elevation model(with an accuracy of 90 m)was also used, obtained by vectorizing the topographic database of the Fergana depression. With the help of these remote sensing materials, it becomes possible to decipher the morphostructural features of the study area with the identification of uplifts, depressions,and fault zones.To accomplish this task,the SRTM radar satellite images were properly interpreted using the ArcGIS Desktop software package.
For the preliminary identification of structural and geomorphological elements, topographic maps with a scale of 1:100,000 were used. ArcGIS 10.5 Spatial Analyst and Geostatistical Analyst models were also involved in the development of the Digital Elevation Model and Hydrological Network Automated Model of the Fergana depression(Fig.2).To eliminate minor defects in the raster surface of radar space images,fill functional operations were performed.Then,to determine the hydrographic directions, the “flow direction”operation was performed,which was divided into eight classifiers.At the final stage,additional functions of flow accumulation and stream order were used to identify signs of geomorphological elements and data of recent tectonics.The resulting flow direction model makes it possible to locate relief features that may serve as signs of neotectonic deformations. Their correlation analysis with structural geomorphological data is particularly important to obtain such information, for example, to identify the direction or intensity of neotectonic movements and deformations[27,28].
Published data on the geological structure of the Fergana depression were involved, including geological maps, sections, lithologies and stratigraphic columns. They were used to evaluate the morphostructural elements and terrace surfaces identified from satellite images. The lithologies of the strata and their corresponding ages are represented by lithological columns [11], as shown in Fig. 3. The upper part of the geological section of the Fergana depression consists mainly of Mesozoic and Cenozoic sedimentary deposits. They are underlain by heavily deformed Palaeozoic formations (Fig. 4), which consist mainly of effusive rocks and sedimentary deposits: such as mudstones, siltstones,clays,light sandstones and conglomerates.In addition,the exposed part of the folded structures is composed of highly metamorphic and intrusive rocks. Based on drilling data, Paleozoic sequences were recovered at depths of 1500-3000 m in the south and at depths of 10,000-15000 m in the central and northern parts[15].In the basin,Triassic deposits represented by terrigenous rocks with a thickness of more than 100 m are rare. The total thickness of the deposits is approximately 120-430 m. The Jurassic sediments unconformably overlie eroded Palaeozoic rocks. Cretaceous deposits are widely distributed on the slopes of the Fergana depression,especially in the eastern, southeastern and southern parts of the depression. They are divided into suites of different lithological compositions: Muyan, Lakan, Kyzylpilial, Kolachin, Oyster, Yalovach, and Light.
Palaeogene deposits are divided into several lithologicalstratigraphic complexes: Bukhara, Alai, Turkestan, Rishtan, and Sumsar.The upper Palaeocene in the south consists mainly of green,grey, grey-green, and green-brown clays, which are sometimes locally angularly irregular(Fig.3).The Neogene deposits are divided into two series: Massaget (Miocene) and Bactrian (Pliocene). The Massaget Group includes the red formation and light red formation above it. The Red Suite is represented by clayey siltstones with alternating gravels and sandstones.Their thickness is 120-240 m.It should be noted that many local industrial-type oil and gas structures are confined to these layers and formations [15]. Thus, the materials about the geology, software tools for processing space images,and additional functions of GIS technologies made it possible to carry out structural and geomorphological interpretation of the remote sensing data for the Fergana depression.

Fig. 2. Flow direction model of the Ferghana depression.
3. Results and discussion
In the Ferghana region,various morphostructural elements such as uplifts and depressions are distinguished, as well as the folded mountain systems of Turkestan-Alay in the south, Fergana in the east,and Chatkal-Kuramin in the north(Fig.5).When decoding the geomorphological features of the region,we refer to similar studies[29,30]. When interpreting the images, three sections corresponding to tectonic zones are identified: the southern tectonic step, the central graben-megasyncline, and the northern marginal slope. The southern tectonic step on the RGB 7/5/4 channels of satellite images is presented as relevant changes in the spectral brightness degree, corresponding to large blocks of uplifts and depressions,with alternation of canyon-like and hilly zones.These morphostructural elements are formed due to neotectonic movements and directly adjoin the river terraces of the middle and late Pleistocene. A trough composed of sedimentary rocks (Kurshab) is different from the asymmetric uplift (Karachatyr) in the southeastern part. It also developed during the late Pliocene. This indicates that the modern relief here is represented mainly by young Late Pliocene and Quaternary morphostructures.
In the eastern part of the southern side of the Ferghana depression, the zone of the Andijan uplift group, the Andijan monoclinal,and the Karasu,Aim and Kugart troughs are identified.The zone of the Andijan group of anticlinal uplifts is distinguished by the degree of spectral brightness on 4-5-7 channels(0.630-0.680 nm; 1.560-1.660 nm; 2.100-2.300 nm), while tectonic elements are distinguished by photon density from light-dark, dark and dense dark. Most of this territory is represented by Paleogene,Neogene,and Quaternary deposits.These are Mesozoic deposits in the southeastern margin of the Karasu and Aim troughs. In areas of rapidly changing topography, these deposits consist mainly of carbonate rocks and sandstones,which are distinguished in satellite images of 6-7 channels(1560-1660 nm;2100-2300 nm)at the junction of uplifts and troughs by dark gray,gray, and light gray light tones. Alluvial and primary sediments dominate the terrain over a large area. In addition, two stepped zones and an anticlinal zone are distinguished in the southwestern part of the region: Yakkatut, Kanibadam-Rishton, and Kyzylcha-Chimion. The decoding signs of the Palaeozoic-Mesozoic fold zones are represented by light grey and grey tones in the thermal channels and by red,green,and blue in RGB channels 7/5/5(Fig.5).
Complicated folded structures, faults, extended cracks, and lineaments in the southern part are distinguished on satellite images by sharp changes in hypsometric position(showing the amplitude of neotectonic movements),landscape features,and morphological elements. A joint analysis of the flow direction digital model with the identified structural and geomorphological elements made it possible to identify signs of neotectonic activities. The main water artery of the region is the Syr Darya River. The different nature of the watercourses from the north and south of the Syr Darya(Fig.2)indicates relatively slow vertical movements in the southern part compared to the northern part.In addition,the character of channel bends also shows the differentiation of these movements. For example, the nature of the drainage direction reveals greater neotectonic activity in the western block of the local uplift north of Namangan City than in the eastern block. The boundary between them runs along the shear line (Fig. 5). Such an analysis made it possible to obtain a different map of neotectonic movements. A description of these results is the subject of another article.Here we pay more attention to the structural and morphological elements of the region, not tectonic activities. The Andijan monocline is associated with the flexural fault zone of the same name (FRZ)along the northeast strike[18]. In the RGB 4/5/3 channels of space images, this tectonic element is represented by the corresponding level of light-tone brightness in the form of extended lineaments.In this case,the lineaments extend along the azimuth of 25°(205°)-30°(210°) and cross the Andijan monocline. There are also large folds that appear as dark light shadows. Here, individual lineaments extend submeridionally and sublatitudinally. Marked geological and structural elements on space images are expressed by increased brightness.These signs correspond to open faults and macro-fractures. To improve the reliability of these data, it is advisable to carry out field verification work.

Fig.3. Lithostratigraphic column of Cenozoic deposits.Legends indicate the lithological complexes:1-clay;2-marl clay;3-silty clay;4-siltstone;5-evenly enclosed siltstone;6-sand;7-sandstone; 8-argillaceous sandstone.

Fig. 4. Geological section along the profile across the central part of the Fergana depression, compiled from the data of [11]. Legends indicate the lithological and stratigraphic complexes.1:Neogene-Quaternary;2:Paleogene;3:Mesozoic;4:Palaeozoic;5:discontinuous violations;6:discontinuous flexural zones;7:anticlinal folds.I:Agasarai;II:Chust-Pap; III: Karakalpak; IV: Buvaydin; V: Kurgan; VI: West-Serov; VII: Sarykurgan; VIII: North-Sokh; IX: Galchin; X: Akturpak.
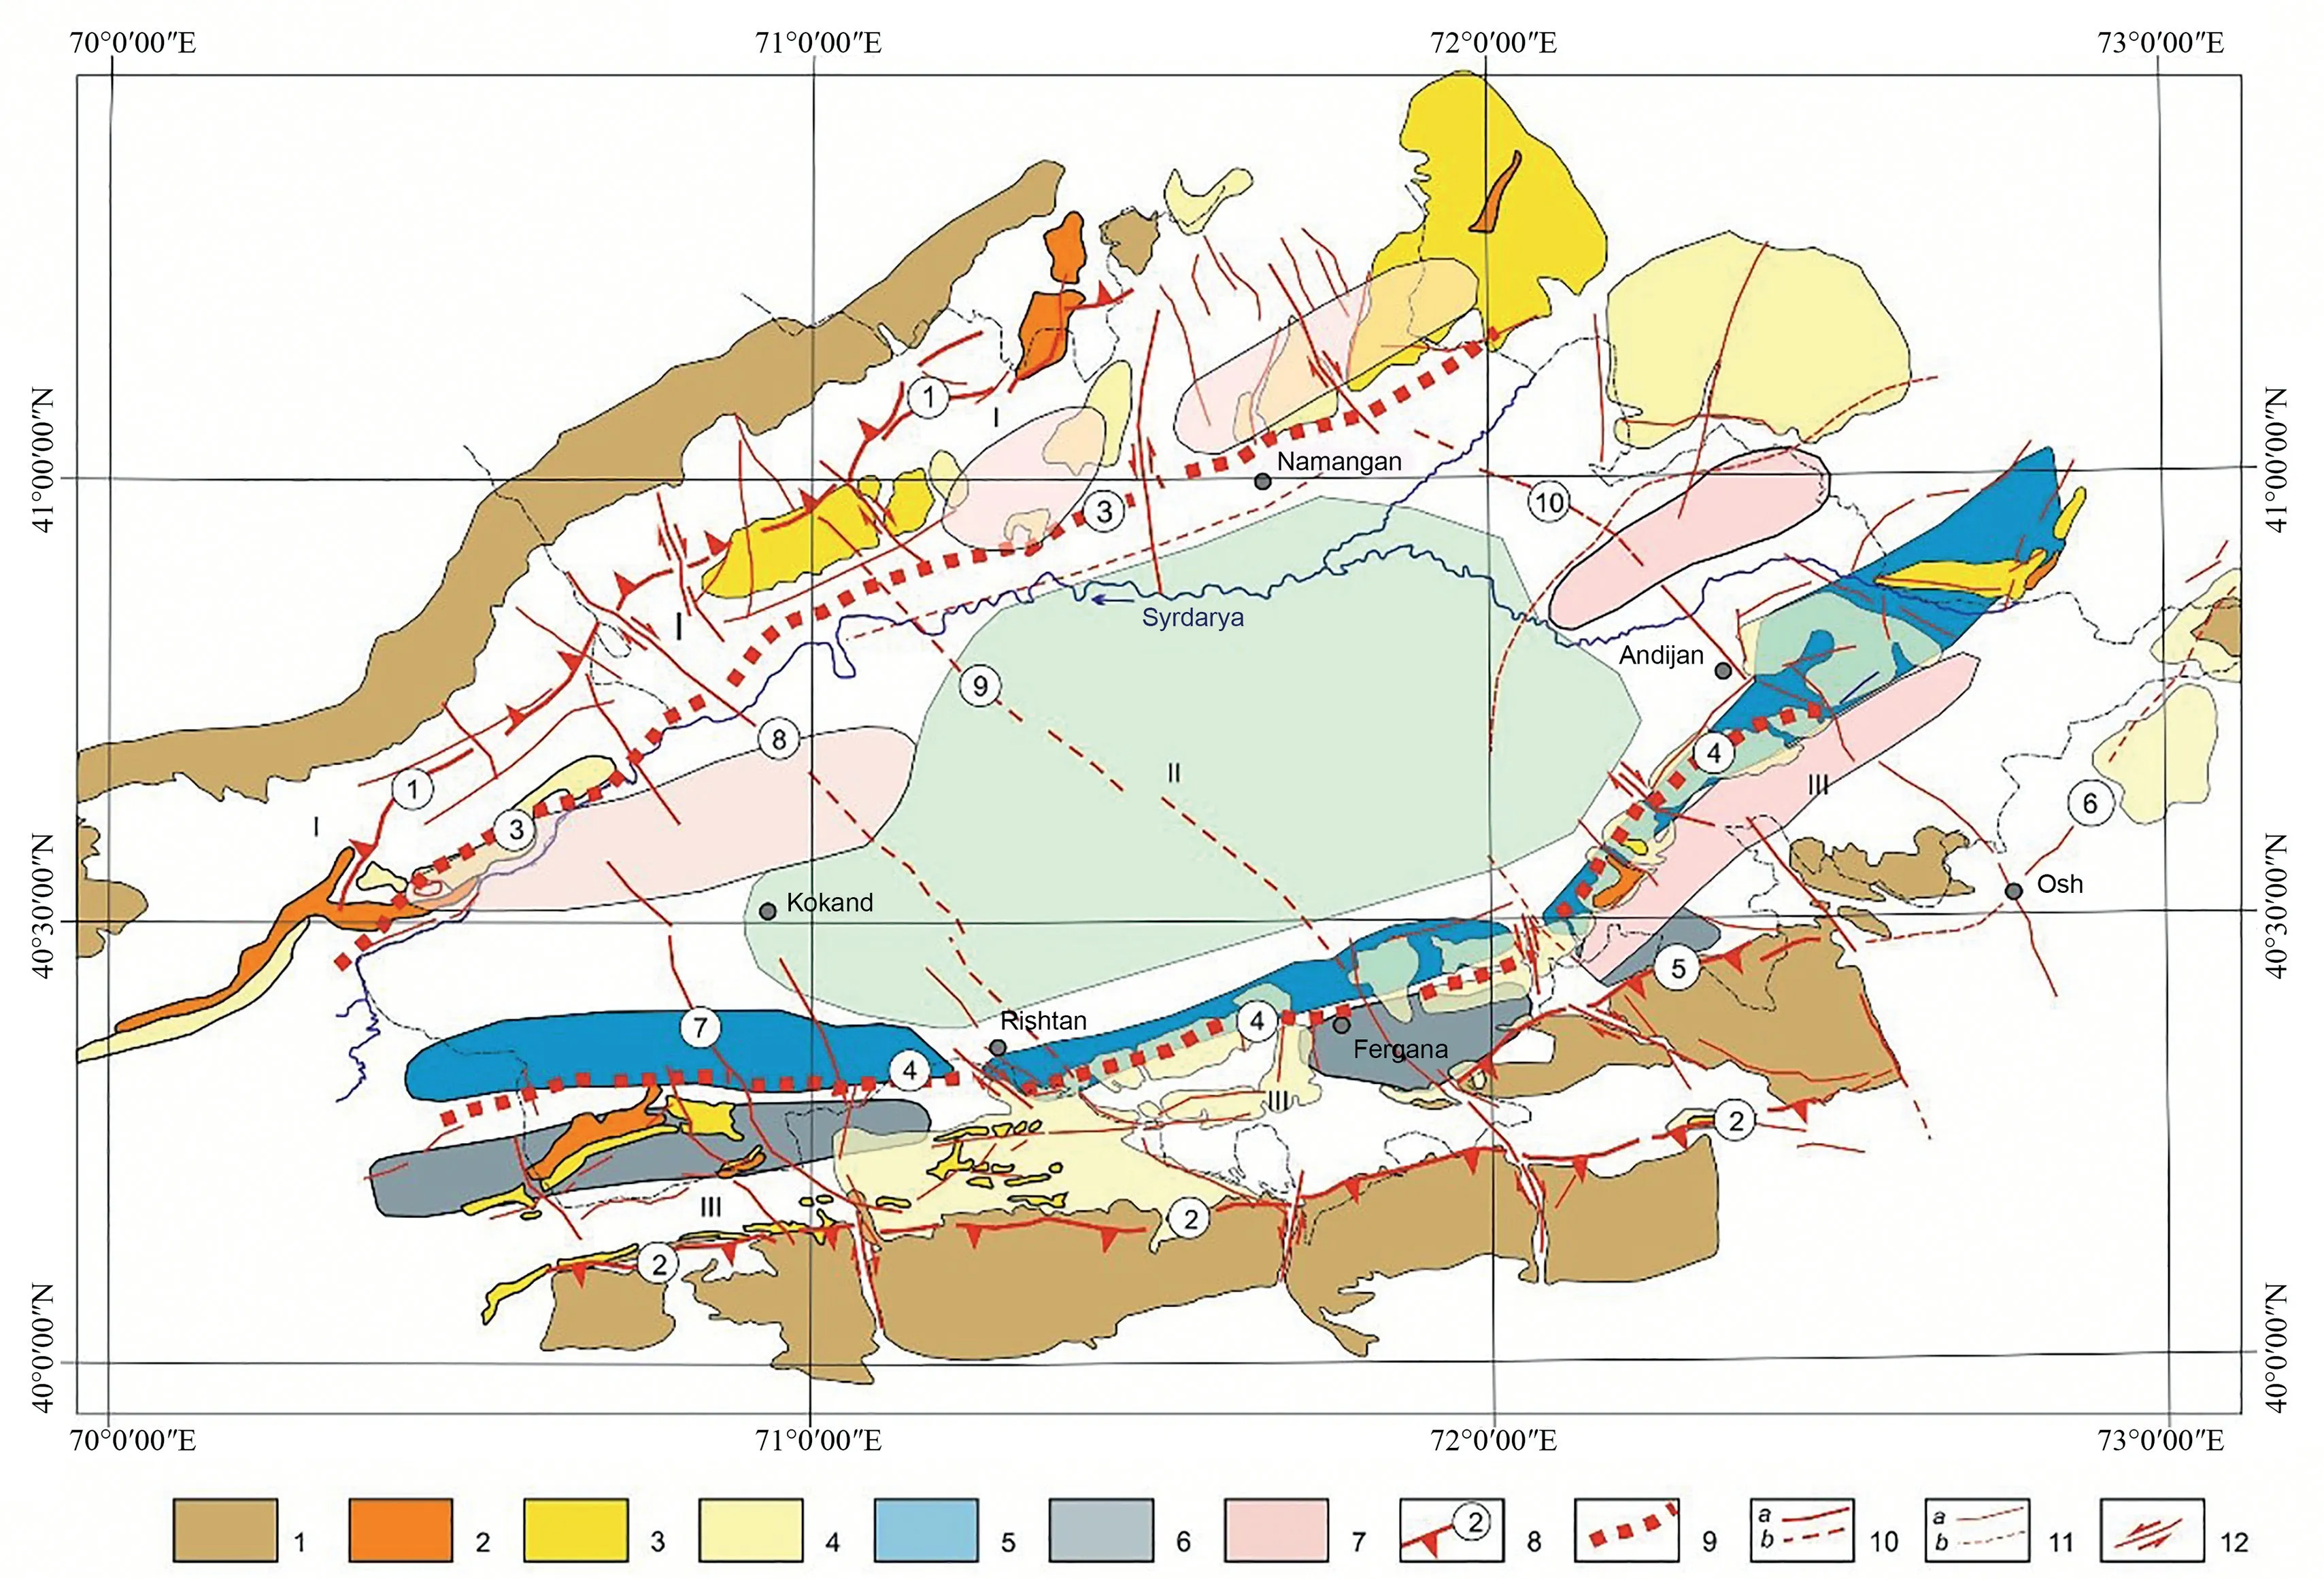
Fig.5. Cosmogeological map of the Fergana depression.I,II,and III denote the northern slope,central Fergana megasyncline,and southern tectonic step,respectively.Legends 1-4 indicate structural and material complexes.1: fragments of the Palaeozoic folded basement; 2: Paleogene; 3: Neogene; 4: Quaternary molasses. Legends 5-12 indicate structural and geomorphological elements. 5: monoclines and marginal slope; 6: stepped zones; 7:anticlinal zones; 8:deep faults and lineaments of the 1st rank;9: flexure-fault zones (①North Fergana fault, ②South Fergana fault, ③North Fergana flexural-fault zone, ④South Fergana flexural-fault zone, ⑤Karachatyr fault, ⑥Taldysuy fault, ⑦Kurshab fault, ⑧Kumbel-Kokand-Khairakan fault, ⑨Kenkol-Pap-Chimion fault,⑩Maylisu-Tergachi); 10: regional faults (a-confident, b-uncertain); 11:discontinuous local violations (a-confident,b-uncertain); 12: movement directions of the fault wings.
4. Conclusion
This study shows the manifest characteristics and neotectonic element differences in three large geotectonic zones of the Fergana depression. In the Fergana depression, structural-geomorphological elements are distinguished by sharp changes in the relief with light violet and violet tones in RGB channels, and with dark and semidark light tones in multispectral channels. The regional lineament zones were identified based on the noted signs, uplifts and troughs. It has been established that the lineaments are mainly northeast-trending along an azimuth of 25°(205°)-33°(213°), the faults are mainly extended 55°(235°)-70°(250°), and the sublatitudinal and submeridional directions are less obvious. The longitudinal zones are clearly expressed in geoblocks of different sizes,which are reflected in the multispectral and thermal channel specific interpretation indicators of space images. To a certain extent, this makes it possible to carry out a structural-geomorphological analysis with the refinement of individual geological and structural data of the Fergana depression. There are signs of numerous lineaments,transverse faults, and northwest-trending strikes, which are superimposed on the main longitudinal morpho-controlling faults.Right- and left-rotating strike-slip faults are found in the northern and southern parts of the depression.
Author statement
The authors are grateful to the referees for constructive comments, which undoubtedly contributed to a significant improvement in the work.
Conflicts of interest
There is no conflicts of interest.
Acknowledgments
This work is carried out on the initiative of the authors under the research program provided by the research plans of the Tashkent State Technical University and the Institute of Geology and Exploration of Oil and Gas Fields in the Fergana region. The authors express their gratitude for the consultations(posthumously)with the honored worker of the oil and gas industry M.R. Nurmatov. The authors express their appreciation to the staff of the Institute of Geology and Exploration of Oil and Gas Fields,Doctor of Philosophy O.A. Karshiev, Chief Specialist of JSC Uzbekgeofizika, Doctor of Philosophy A.A. Urmanov for scientific consultations and fruitful discussion of the results.
杂志排行
Geodesy and Geodynamics的其它文章
- Models (form) of long-, medium- and short-term earthquake precursors
- Testing of new ionospheric models along the meridian 110° E over the Northern Hemisphere
- Non-carcinogenic health risk assessment of nitrate and fluoride contamination in the groundwater of Noyyal basin, India
- Crustal structure of the Qiangtang and Songpan-Ganzi terranes(eastern Tibet) from the 2-D normalized full gradient of gravity anomaly
- Thermospheric density responses to Martian dust storm in autumn based on MAVEN data
- Coastal transgression and regression from 1980 to 2020 and shoreline forecasting for 2030 and 2040, using DSAS along the southern coastal tip of Peninsular India