Coastal transgression and regression from 1980 to 2020 and shoreline forecasting for 2030 and 2040, using DSAS along the southern coastal tip of Peninsular India
2022-10-18ChrisbenSamGurugnanam
S. Chrisben Sam, B. Gurugnanam
Centre for Applied Geology, The Gandhigram Rural Institute Deemed to be University, Dindigul, Tamil Nadu, India
Keywords:Shoreline change rates Future prediction DSAS Kalman filter Erosion and accretion
ABSTRACT This study explains the multi-decadal shoreline changes along the coast of Kanyakumari from 1980 to 2020. The shorelines are extracted from the Landsat images to estimate the shoreline dynamics and future predictions using Digital Shoreline Analysis System (DSAS). By the estimation of End Point Rate(EPR)and Linear Regression Rate(LRR),it is quantified that the maximum erosion is 5.01 m/yr(EPR)and 6.13 m/yr (LRR) consistently with the maximum accretion of 3.77 m/yr (EPR) and 3.11 m/yr (LRR) along the entire coastal stretch of 77 km.The future shoreline predicted using the Kalman filter forecasted that Inayam, Periyakattuthurai and Kodimunai are highly prone to erosion with a shift of 170 m,157 m and 145 m by 2030 and 194 m,182 m and 165 m by 2040 towards the land.Also, the western coast is highly prone to erosion and it is predicted that certain villages are prone to loss of economy and livelihood.The outcome of this study may guide the coastal researchers to understand the evolution and decisionmakers to evolve with alternative sustainable management plans in the future.
1. Introduction
The shoreline is a fragile and high dynamic zone where the atmosphere,hydrosphere and lithosphere interact[1-3].This unique feature is rapidly modified because of several natural processes like nearshore currents, waves, tidal fluctuation, sediment transportation, environmental and human intervention [4-8]. The changes are also instigated by coastal hydrodynamics, climate,geotectonic activities, and sea-level rise [9-11]. The shoreline dynamics are directly influenced by erosion and accretion induced by natural and anthropogenic activities [12-15], along with the interrupted wave direction and littoral currents caused by the constructed coastal structures like a jetty, sea wall, groin and revetments resulting in shoreline degradation[16].The erosion rate of 1.0 cm/yr to 30 m/yr is experienced by 80% coasts worldwide,resulting in severe degradation of shorelines[17].In order to reduce the impact on the living and environmental resources, shoreline monitoring is more important, thereby providing disaster-specific coastal management structures [18,19].
Remote sensing technique using the satellite images and Geographic Information System (GIS) integrated with Digital Shoreline Analysis System(DSAS)aids in delineating the long term and short term shoreline changes more effectively,regardless of the other conventional methods [19-23]. The DSAS technique is extensively used to estimate the shoreline changes with its statistical data since it is more accurate [24,25]. Also, the shoreline position is assessed with reduced potential random error to obtain the LRR to achieve accuracy[26,27].With this,the beta forecast in the DSAS using the Kalman filter provides the information for future prediction [28]. Several quantitative and qualitative studies have been done to predict the impacts of the future shorelines[4,29-35]. Along with historical shoreline change estimation, the prediction of the forthcoming shoreline is measured. It helps to plan preventive and precautionary measures to conserve the shoreline of the vulnerable coastal areas.
This study aims to analyze the shoreline changes across the coast of the Kanyakumari district. It also predicts the future shoreline by using DSAS 5.0.The primary objective of this study is:(a)to identify the villages subjected to erosion and accretion, (b) to quantify the rate of the sediment transportation in this area, (c) to predict the future shoreline based on the derived historical data.Moreover,this study helps coastal researchers and policymakers provide suitable and sustainable erosion risk management plans in the future.
2. Study area
Kanyakumari is the southern boundary of India,which lies in the state of Tamil Nadu. Physiographically, the coastal stretch of 77 km(includes Fishing harbors and Jetties)extending between 77°35'20''E -77°5'47''E longitude and 8°8'29''N - 8°17'36''N latitude falls between the state of Kerala in the west and the Tirunelveli district in the East (Fig.1). Beach plains, sandy pocket beaches, shoreline terraces, sand dunes and estuaries are categorized along the stretch with rocky outcrops at Kanyakumari and Muttam coasts [36].Though maximum erosion impacted by the 2004 Tsunami got retreated, threatening erosional activities were observed at various parts of the coasts from 2006 to 2011 [37]. The act of mining along the shore also plays a role in coastal changes in this region [38].Based on the administrative block boundaries,the coastal stretch is divided into five: Munchirai, Killiyoor, Kurundhancode, Rajakkamangalam, and Agastheeswaram, for a detailed study. The major rivers Thamiraparani, Valliyar and Pazhayar drown into the sea in this region. The study area experiences an average rainfall of 146.5-190.5 mm with a mean tide level of 0.5 m and an onshore elevation of 9-39 m [37]. The Kanyakumari coast experiences a sediment transport rate of 190.87 × 10³units annually [39]. Previously, various shoreline change detection studies were conducted between 1978 to 2015 by researchers in this study area. Those studies have proclaimed that several villages are subjected to a high risk of erosion caused by littoral drifts and waves along with a low grade of accretion concerning the time,respectively[8,36,37,40-42].
3. Materials and methods
The shorelines are extracted from the multi-temporal and multiresolution satellite images of the Landsat series downloaded from the United States Geological Survey(USGS)Earth Explorer archives.Multiresolution and periodical data coverage help extricate the physical characters of land and sea,providing valuable data in coastal studies since the 1970s [43-45]. Different years of acquisition and the specifics of the satellite imageries are given in Table 1 from 1980 to 2020.The acquired satellite imageries are geometrically corrected with 25 GCPs projected to Universal Transverse Mercator (UTM)WGS-84 datum[24,46].Then by layer stacking process,the bands are combined to False Colour Composite (FCC) to delineate the shorelines. The contrast differentiation of the land and water on the satellite images helps extract the shoreline effortlessly[47].
3.1. Shoreline change detection in DSAS
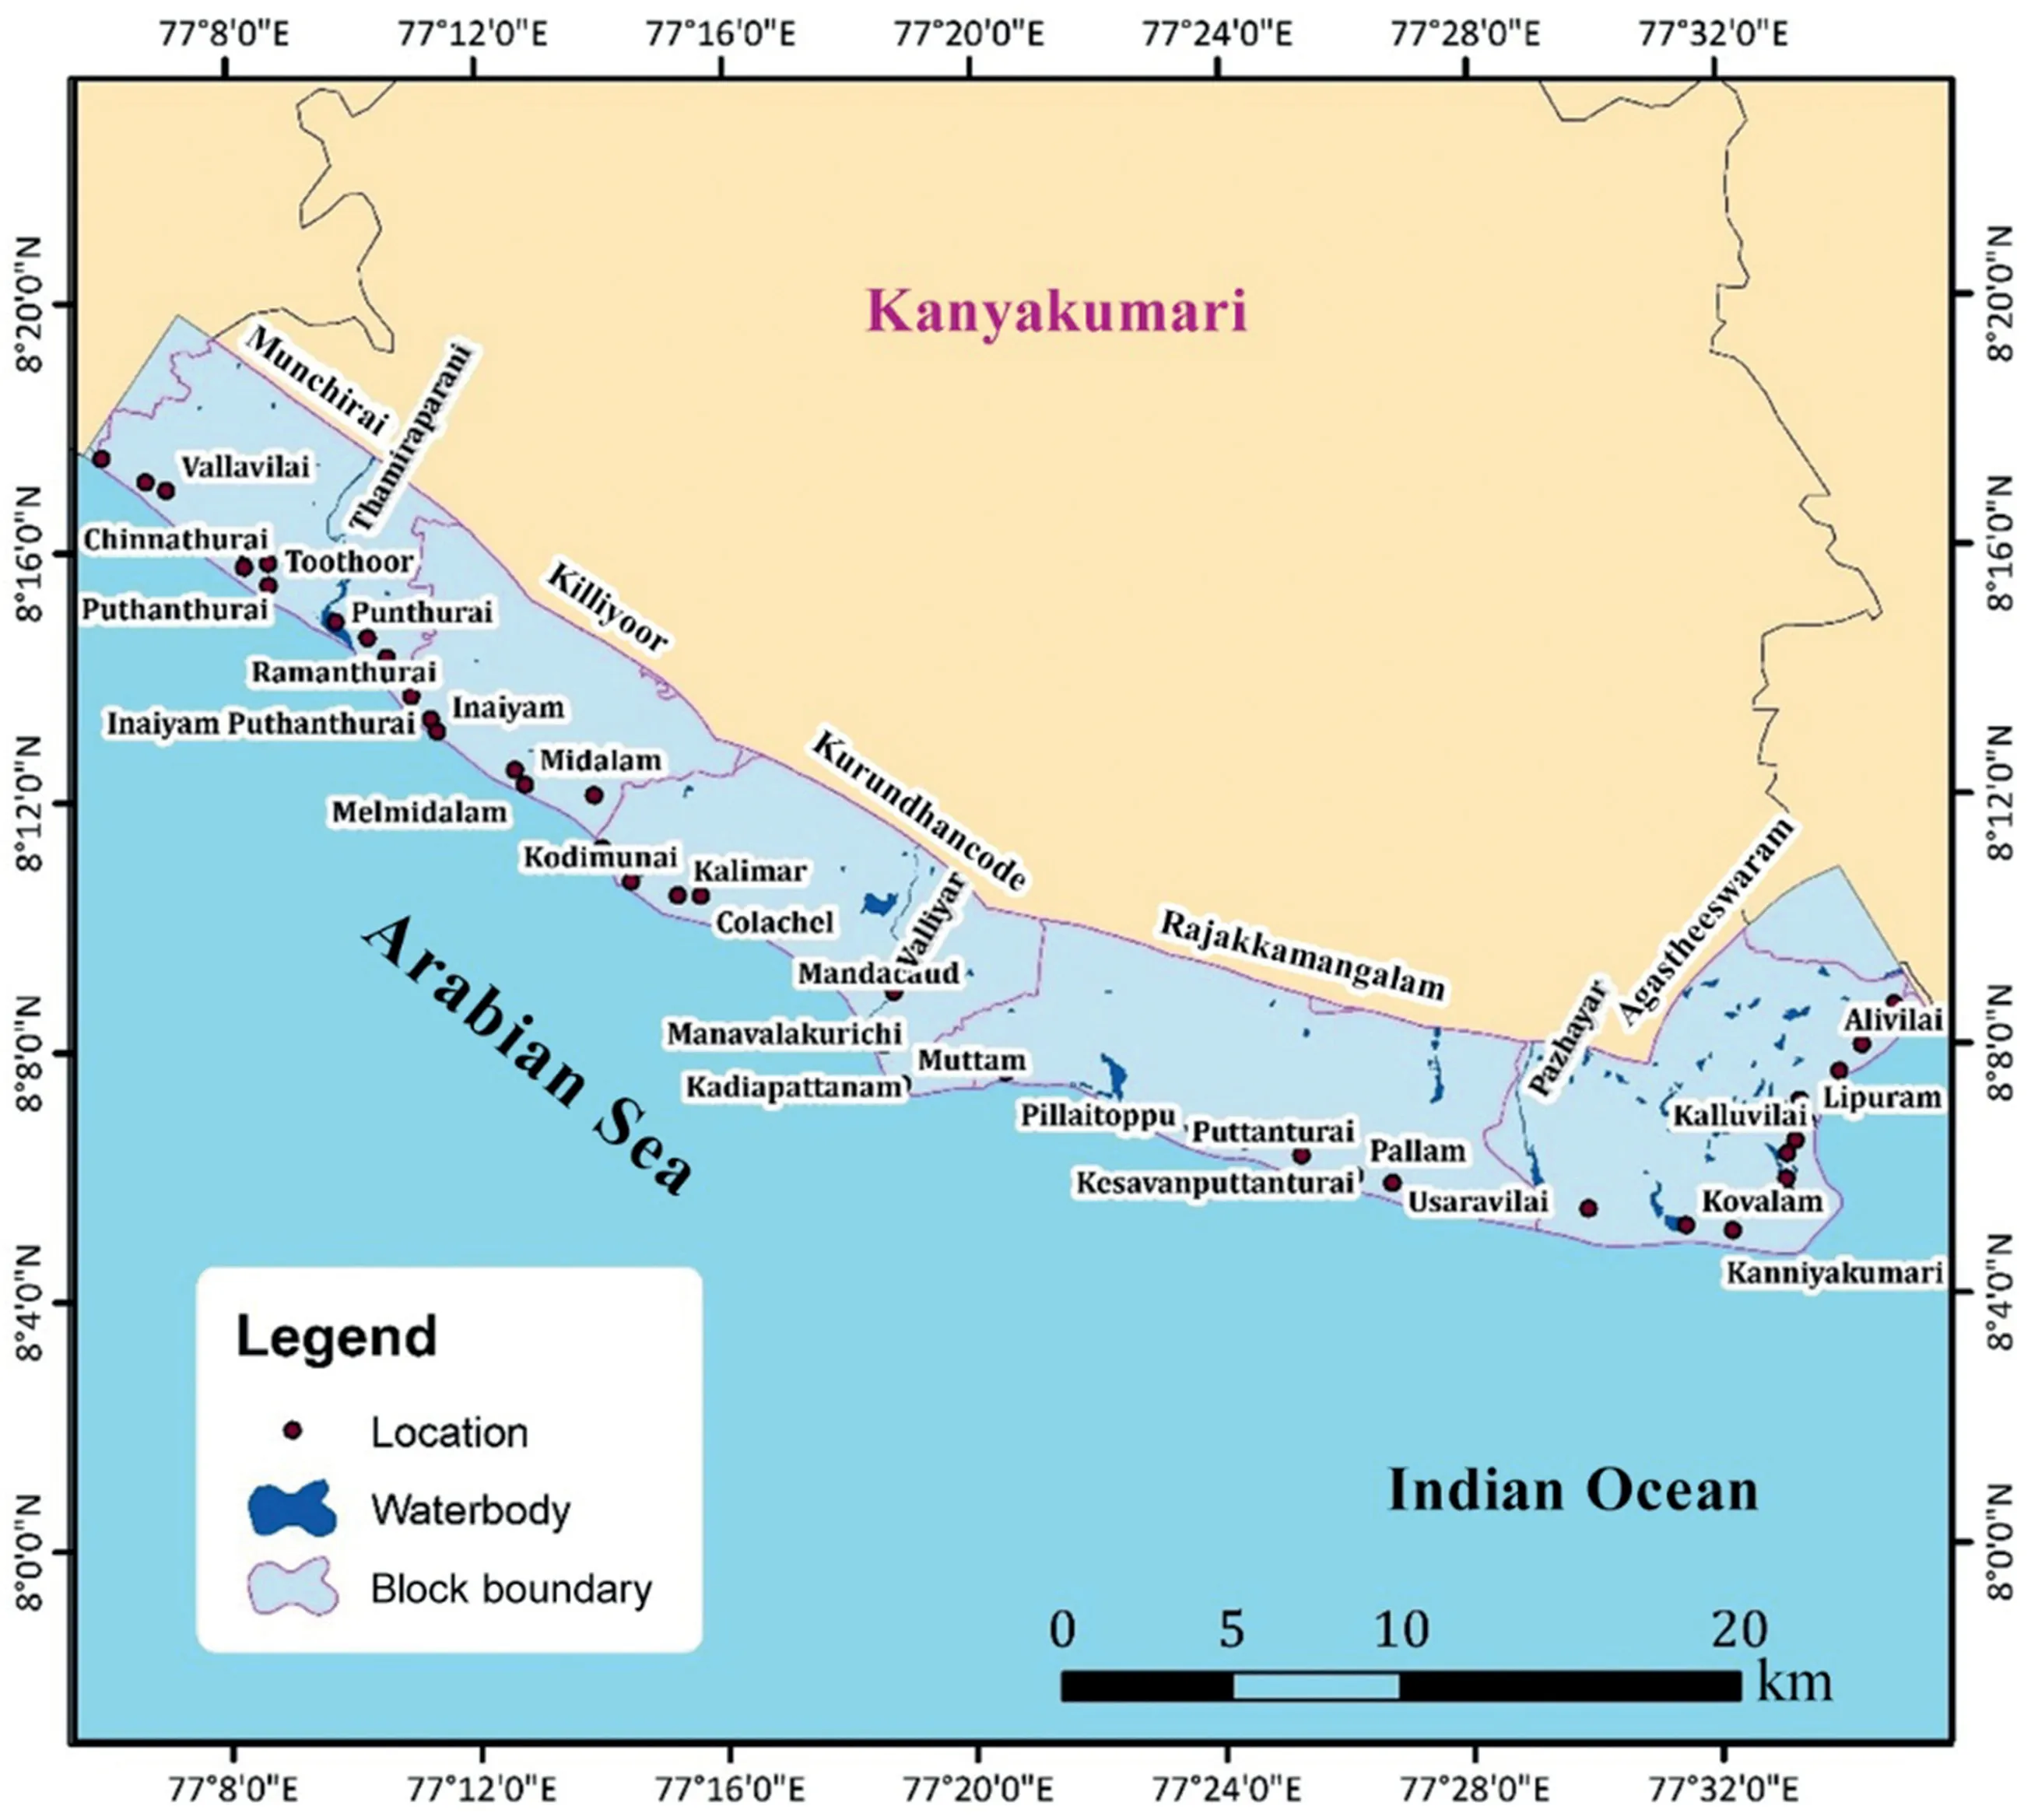
Fig.1. Study area.
Shoreline changes are analyzed and estimated using DSAS version 5.0 provided by the USGS. The shoreline change rate computation is done through the shoreline extraction, baseline creation,and generation of the transects[35].DSAS tool has created 702 transects with an interval of 100 m perpendicular to the shoreline to compute the change rates.The length of each transect is 500 m and the smoothing distance is set to 100 m.In this study,calculation of End Point Rate (EPR), Linear Regression Rate (LRR)and Net Shoreline Movement (NSM) are the statistical methods used to estimate the change rates.The assimilation of more years of satellite data maintains a higher accuracy in calculating the change rates [48].
The NSM is the distance between the first and last shorelines,a statistical parameter calculated for each transect cast perpendicular to the shoreline [28].

The calculation of the EPR is by dividing the distance between the oldest and the youngest shoreline by the elapsed time between the oldest and the youngest[28,49].The formula calculates EPR as follows:

The LRR is determined by fitting a least squares regression line to all shoreline transect points [28]. The upcoming shoreline change positions are predicted using this method [50].
The calculated statistical parameters in this study disclose that the rate of erosion and accretion along the coast of Kanyakumari is categorized into five categories in which the negative value signifies erosion and the positive value indicates accretion [51-53].The EPR and LRR ranges are shown in Table 2.
3.2. Prediction of future shorelines
The technique used in predicting the future shorelines is generally based on the EPR and LRR models [54]. In this study,predicting the future shoreline is made by the DSAS 5.0 beta forecast technique, which works based on the Kalman filter [22,45],combining the given shoreline positions to forecast future shoreline positions. The Kalman filter uses a statistically derived set of LRR values to predict the position of the impending shoreline more accurately [23]. With the combination of the historical shorelines,the successive shoreline positions are estimated with their time.The Kalman filter minimizes the error between the modeled and the observed shorelines by updating the rates and uncertainties[55]. The shoreline position is predicted for each following time with these updated rates. The shoreline uncertainty estimates the measurement error, and hence the foretold shoreline is exhibited along with an uncertainty band [28]. Though the shoreline is a highly dynamic feature, the forecast helps gather information about the beaches threatening ranges. The future shoreline prediction is made for the years 2030 and 2040. A framework of the present study on shoreline change rates computation and forecasting of the future shoreline is shown in Fig. 2.

Table 1Satellite data used for the study of shoreline changes at Kanyakumari.
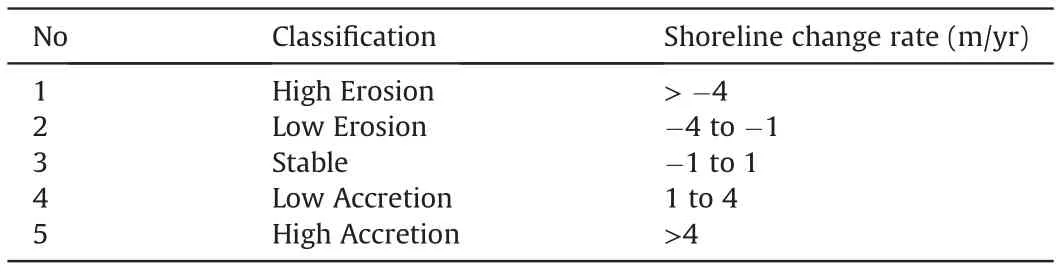
Table 2Classification of EPR and LRR based on erosion and accretion.
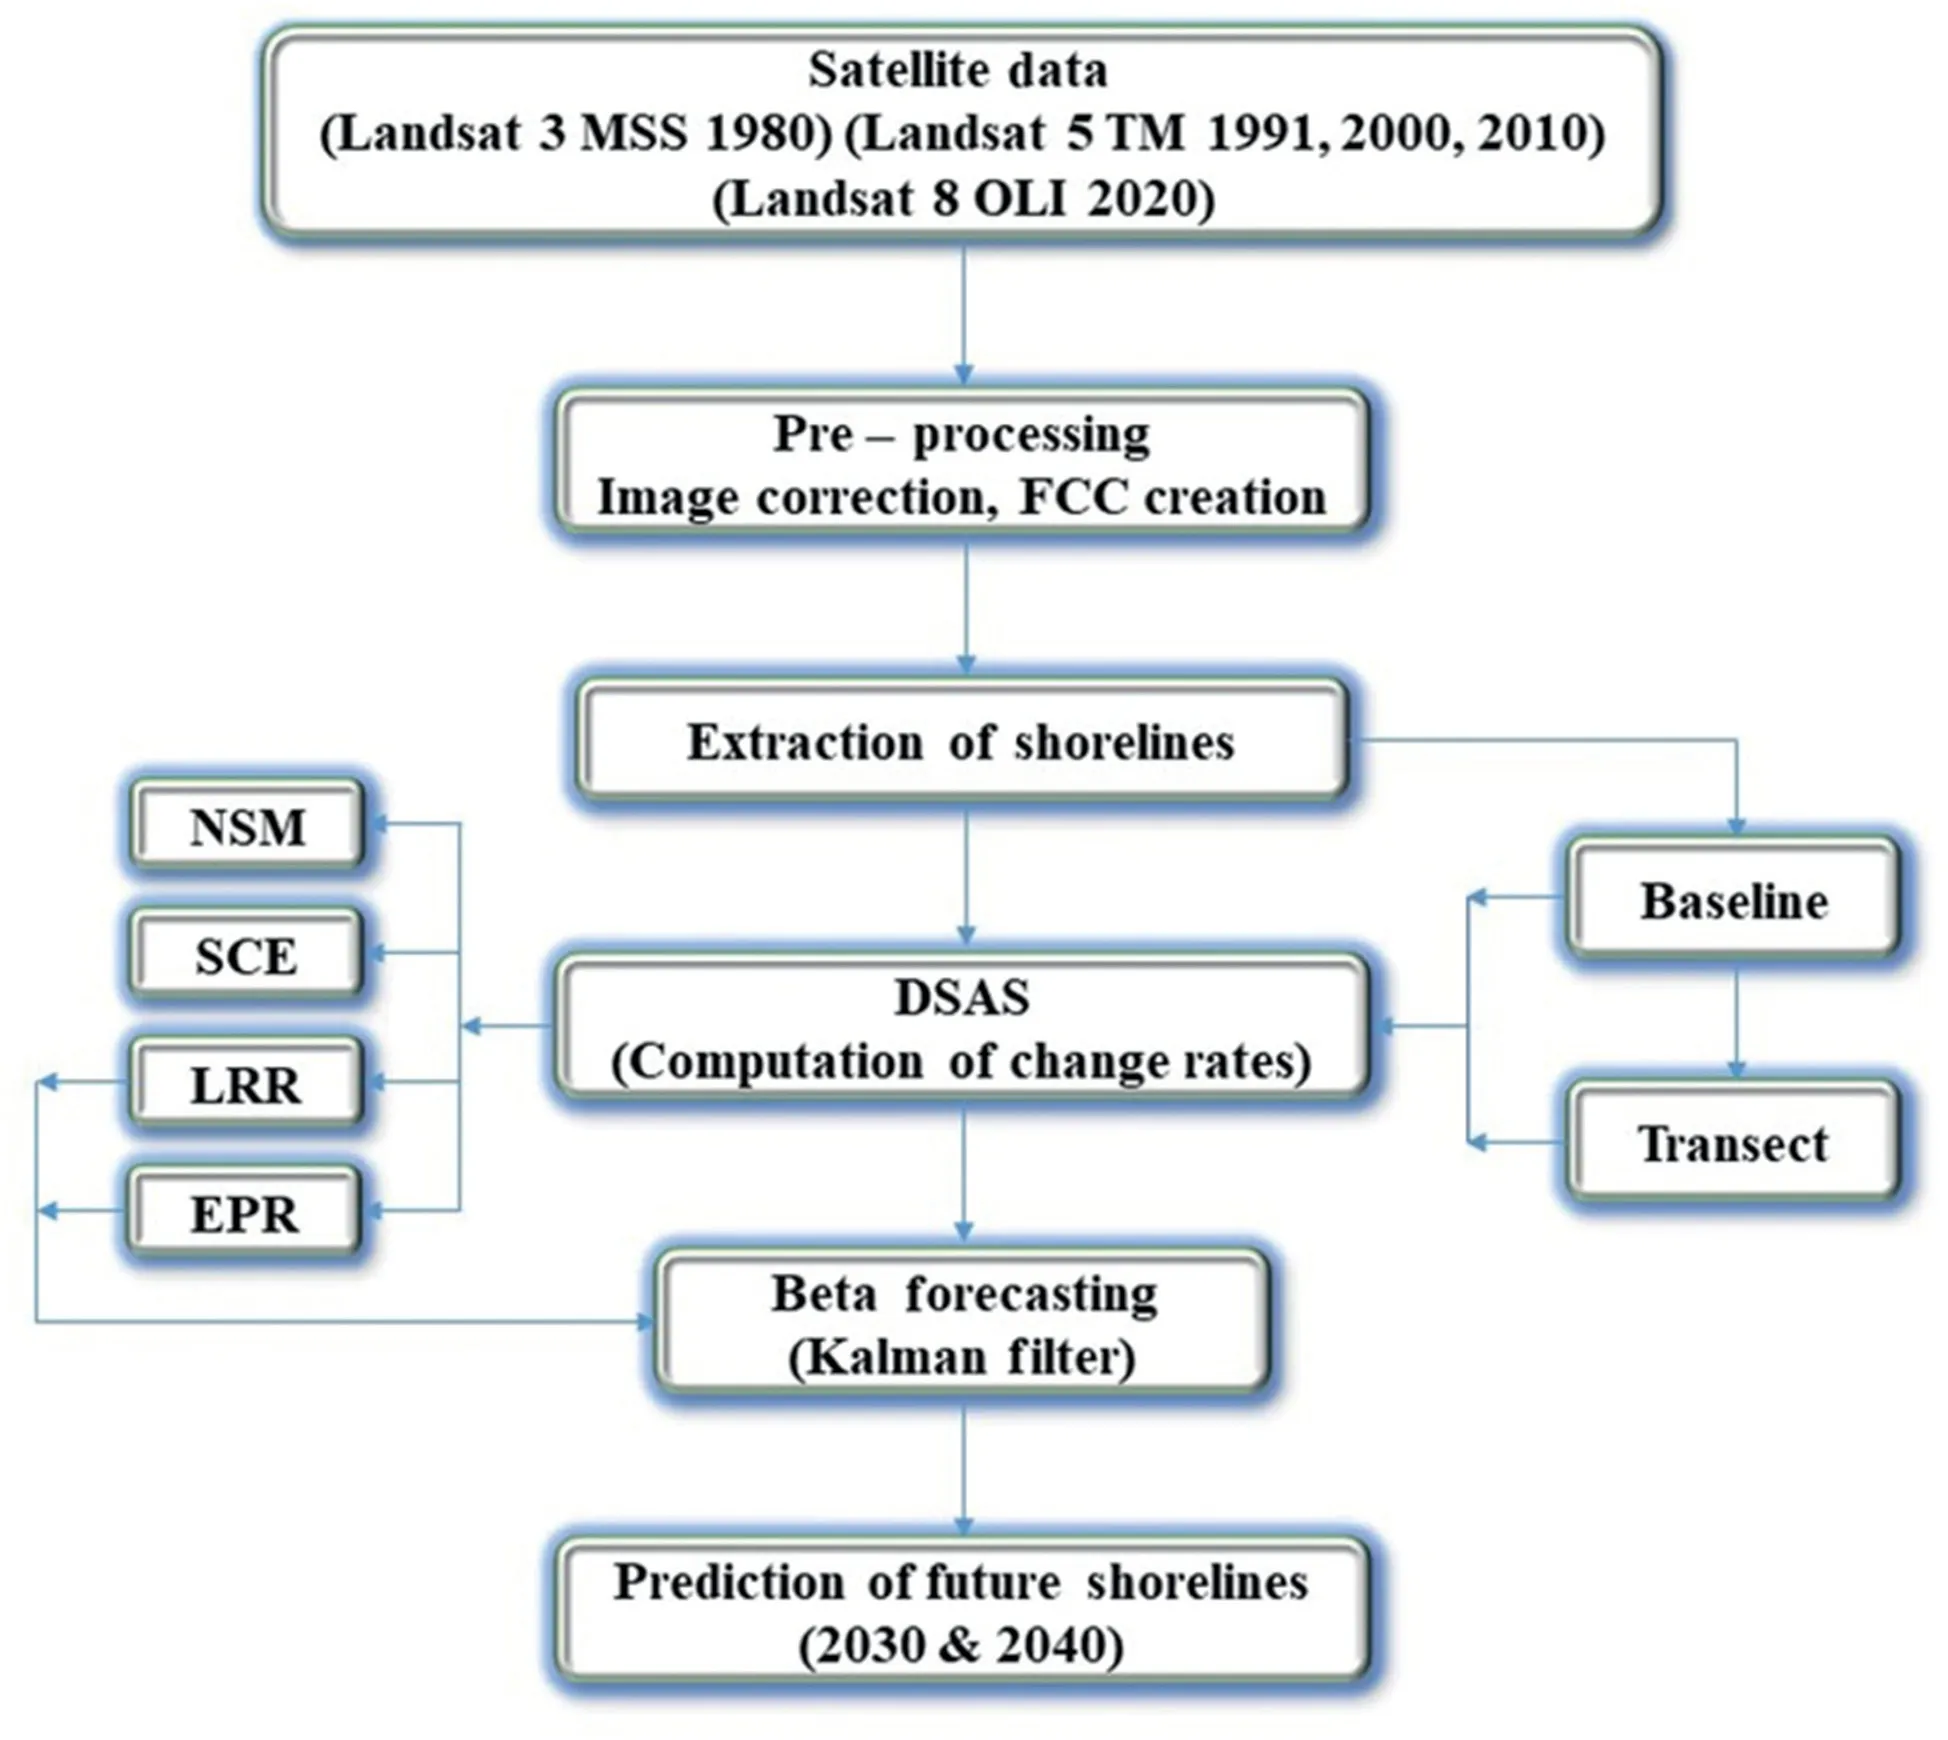
Fig. 2. Methodology framework.
4. Result and discussion
The shorelines in the study area are divided into five sectors with respect to the block boundaries to analyze the shoreline changes triggered by erosion and accretion over the last four decades,i.e.,from 1980 to 2020(Fig.3).The statistically derived EPR,LRR, and NSM, along with their graphical representation for each sector, are shown in Fig. 4, Fig. 5, and Fig. 6.
4.1. Shoreline change analysis
4.1.1. Munchirai
The transects 4 to 115 fall in this sector.Low accretion and stable shoreline are noticed throughout the stretch,with a low erosion rate at the jetties region.Vallavilai coast is observed with a low accretion rate of 3.55 m/yr (EPR) and 3.08 m/yr (LRR). The NSM is highest at 141.61 m in Vallavilai,which is accretion,and the lowest is noticed at 103.52 m at Thengapattanam, which is erosion. The low erosion observed at one side of the Thengapattanam jetties is 2.59 m/yr(EPR) and 1.6 m/yr (LRR). Low accretion (1-4 m/yr LRR) is also noticed at Nirodithurai, Marthandamthurai, Vallavilai, Iraviputhanthurai, Puthanthurai, Chinnathurai, Thoothoor, Punthurai, and Irayumanthurai. This region remains stable and has a low accretion zone because of the numerous groins structures constructed across the shoreline,reducing the wave energy that diminishes backwash.
4.1.2. Killiyoor
The transects segregate the erosion and accretion in this sector from 116 to 194. Low erosion, Stable and Low accretion zones are noticed in this region. This coast seems varied because of the sediments deposited from the river Thamirabarani and subsequent erosion by the backwash during the northeast and southwest monsoon, followed by the postmonsoon wave energy [37].The maximum erosion is 1.61 m/yr (EPR) and 2.04 m/yr (LRR) at the Inayam coast and the highest accretion is noticed as 3.35 m/yr(EPR) and 2.04 m/yr (LRR) at the Midalam coast. The maximum NSM noticed in the accretion zone is 133.97 m at Midalam and the lowest in the erosion zone is 64.31 m at Inayam.Low erosion(-4 to -1 m/yr LRR) is noticed at Ramanthurai, Inayam and Kilmidalam. In contrast, low accretion (1-4 m/yr LRR) is noticed at the Melmidalam and Midalam coasts.4.1.3. Kurundhancode

Fig. 3. The shorelines in five sectors.
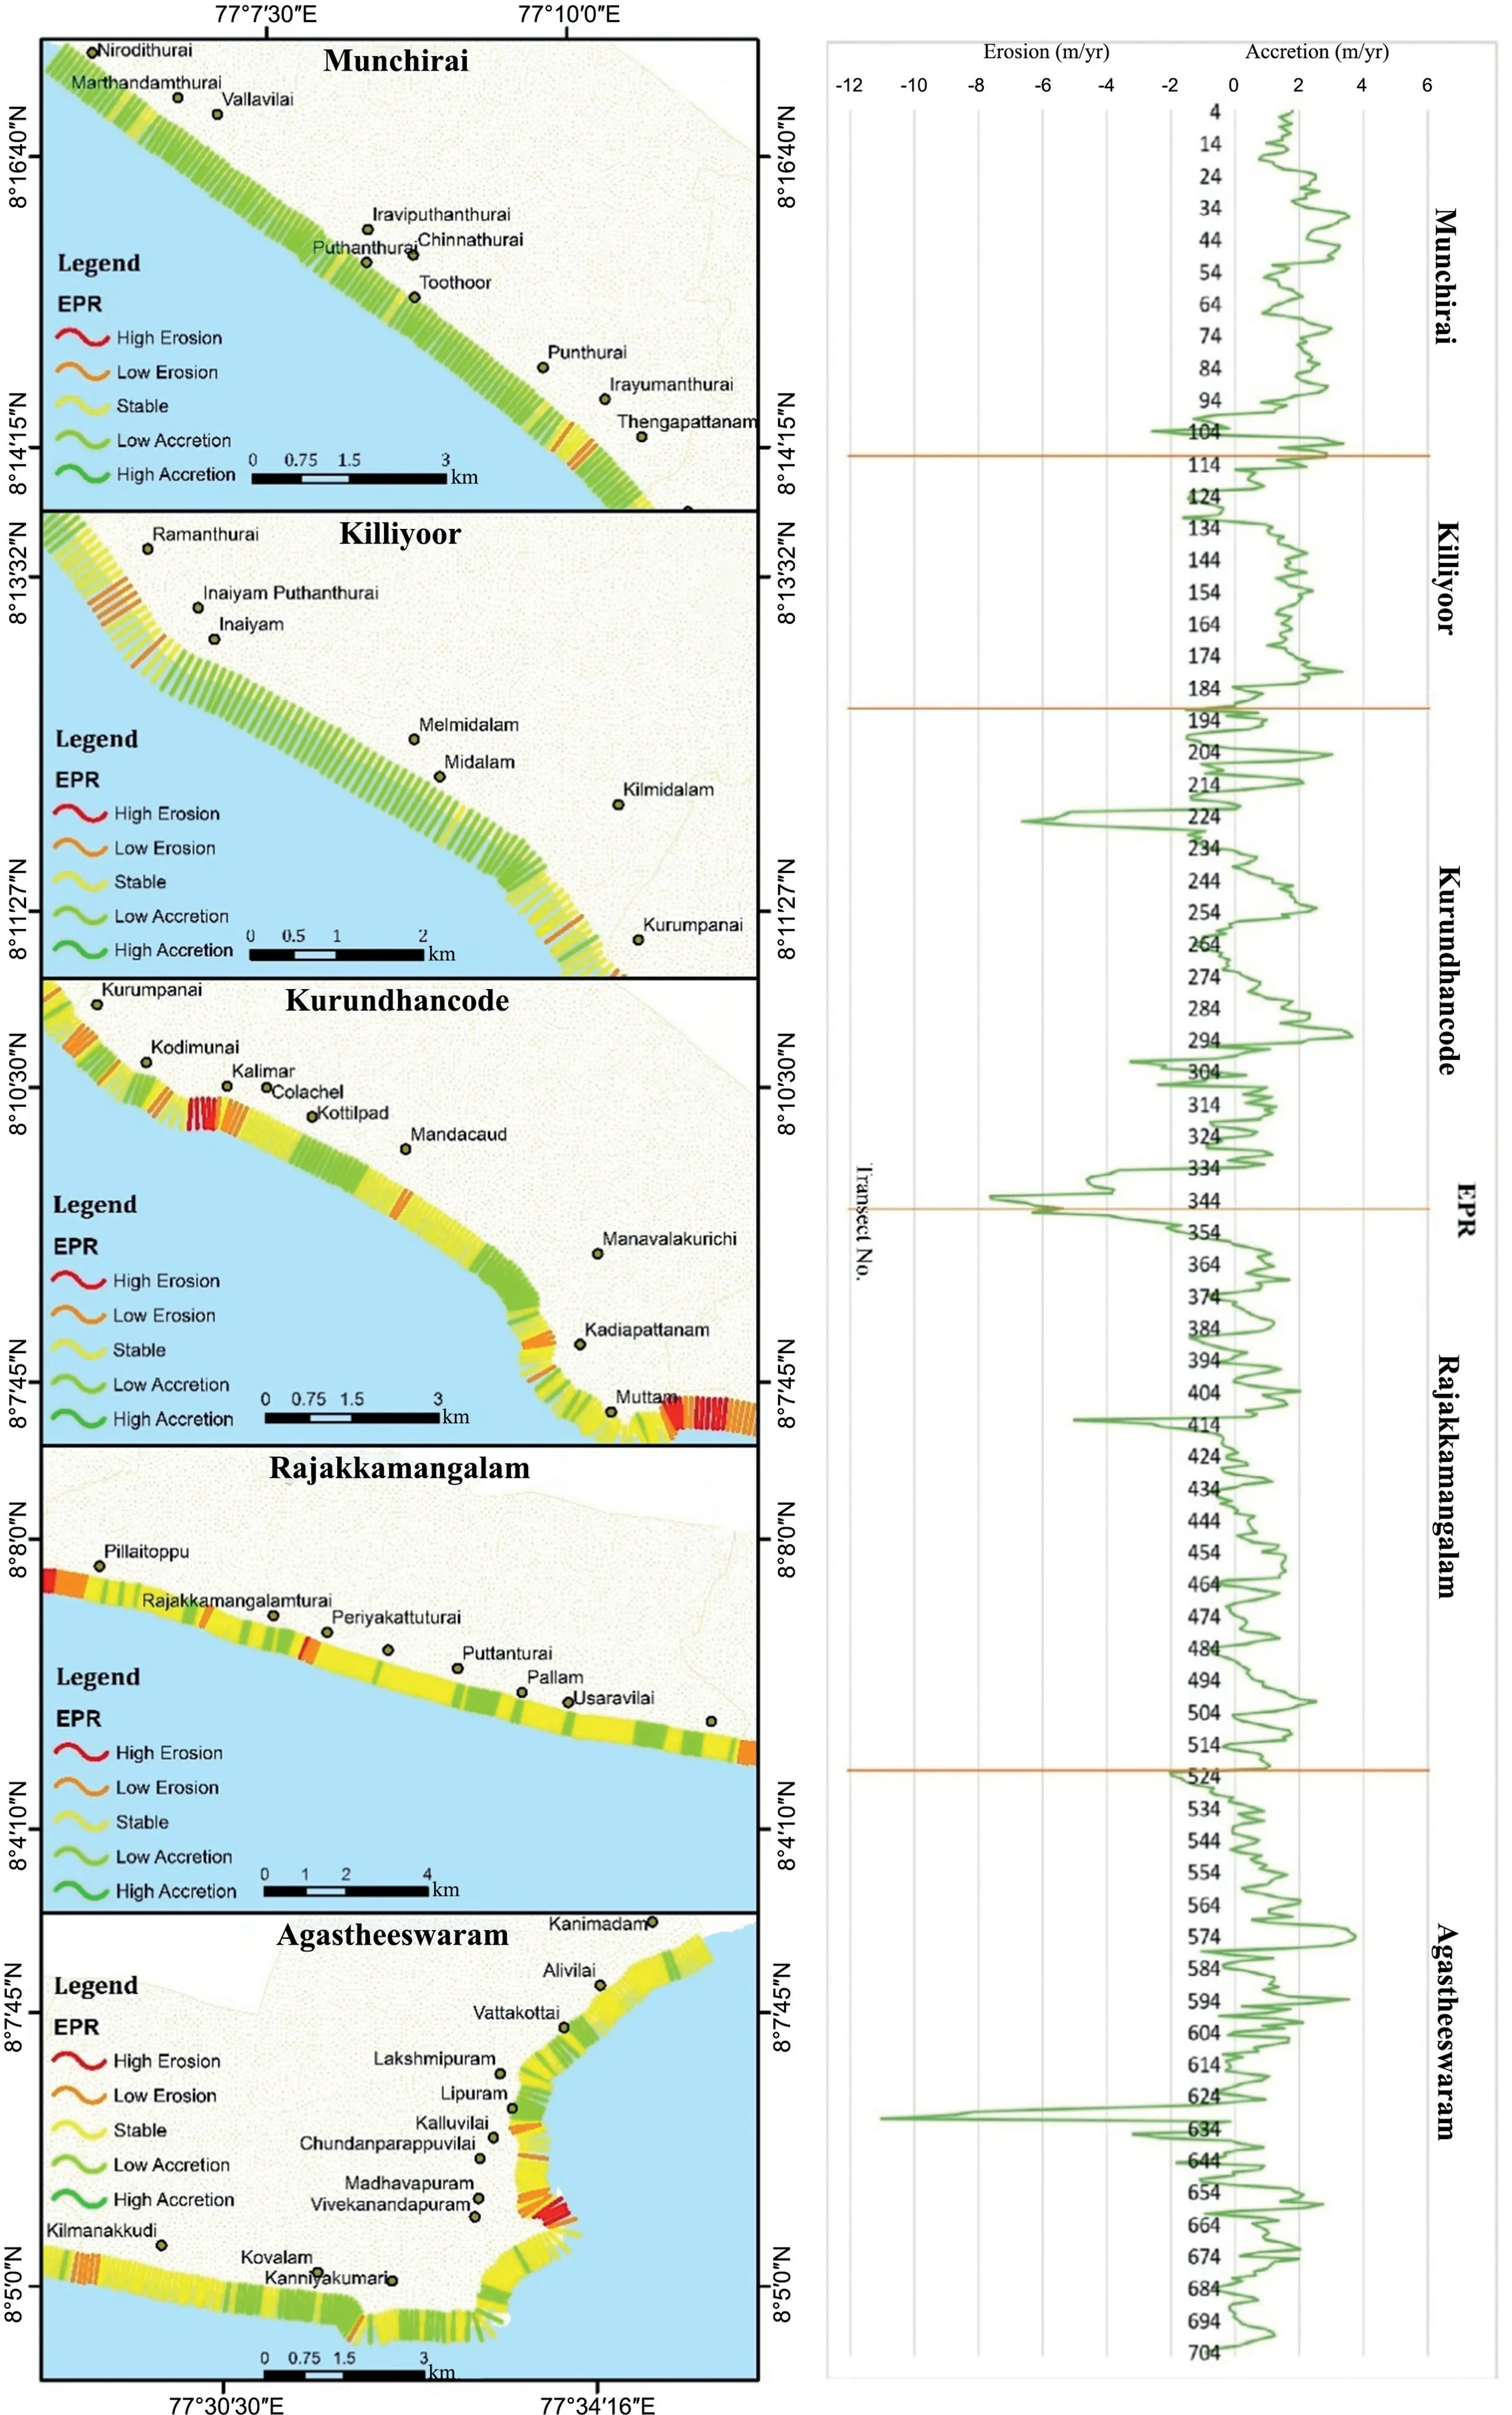
Fig. 4. The estimated EPR on all the five sectors between 1980 and 2020.

Fig. 5. The estimated LRR on all the five sectors between 1980 and 2020.
This sector enfolds the transects from 195 to 349. High erosion, low erosion, stable and low accretion zones are seen along the coast. The maximum erosion is noticed as 7.63 m/yr(EPR) and 6.54 m/yr (LRR) at one side of Muttom fishing harbor and the maximum accretion is 3.65 m/yr (EPR) and 2 m/yr (LRR)at Manavalakurichi. The highest noticed NSM at the accretion zone is 145.68 m at Manavalakurichi and the erosion zone is 304.94 m at Muttom.Though Muttom and Colachel is the coastal upland with rocky shine [56], the high erosion denoted is due to the anthropogenic influence by the fishing harbor construction works and the erosion caused by the impact of wave energy on one side and the drifted wave on the other side in these areas.Low erosion (-4 to -1 m/yr LRR) is seen in the villages Kurumpanai, Kodimuani and Kadiapattanam whereas low accretion (1-4 m/yr LRR) is at Kottilpad, Mandacaud and Manavalakurichi.
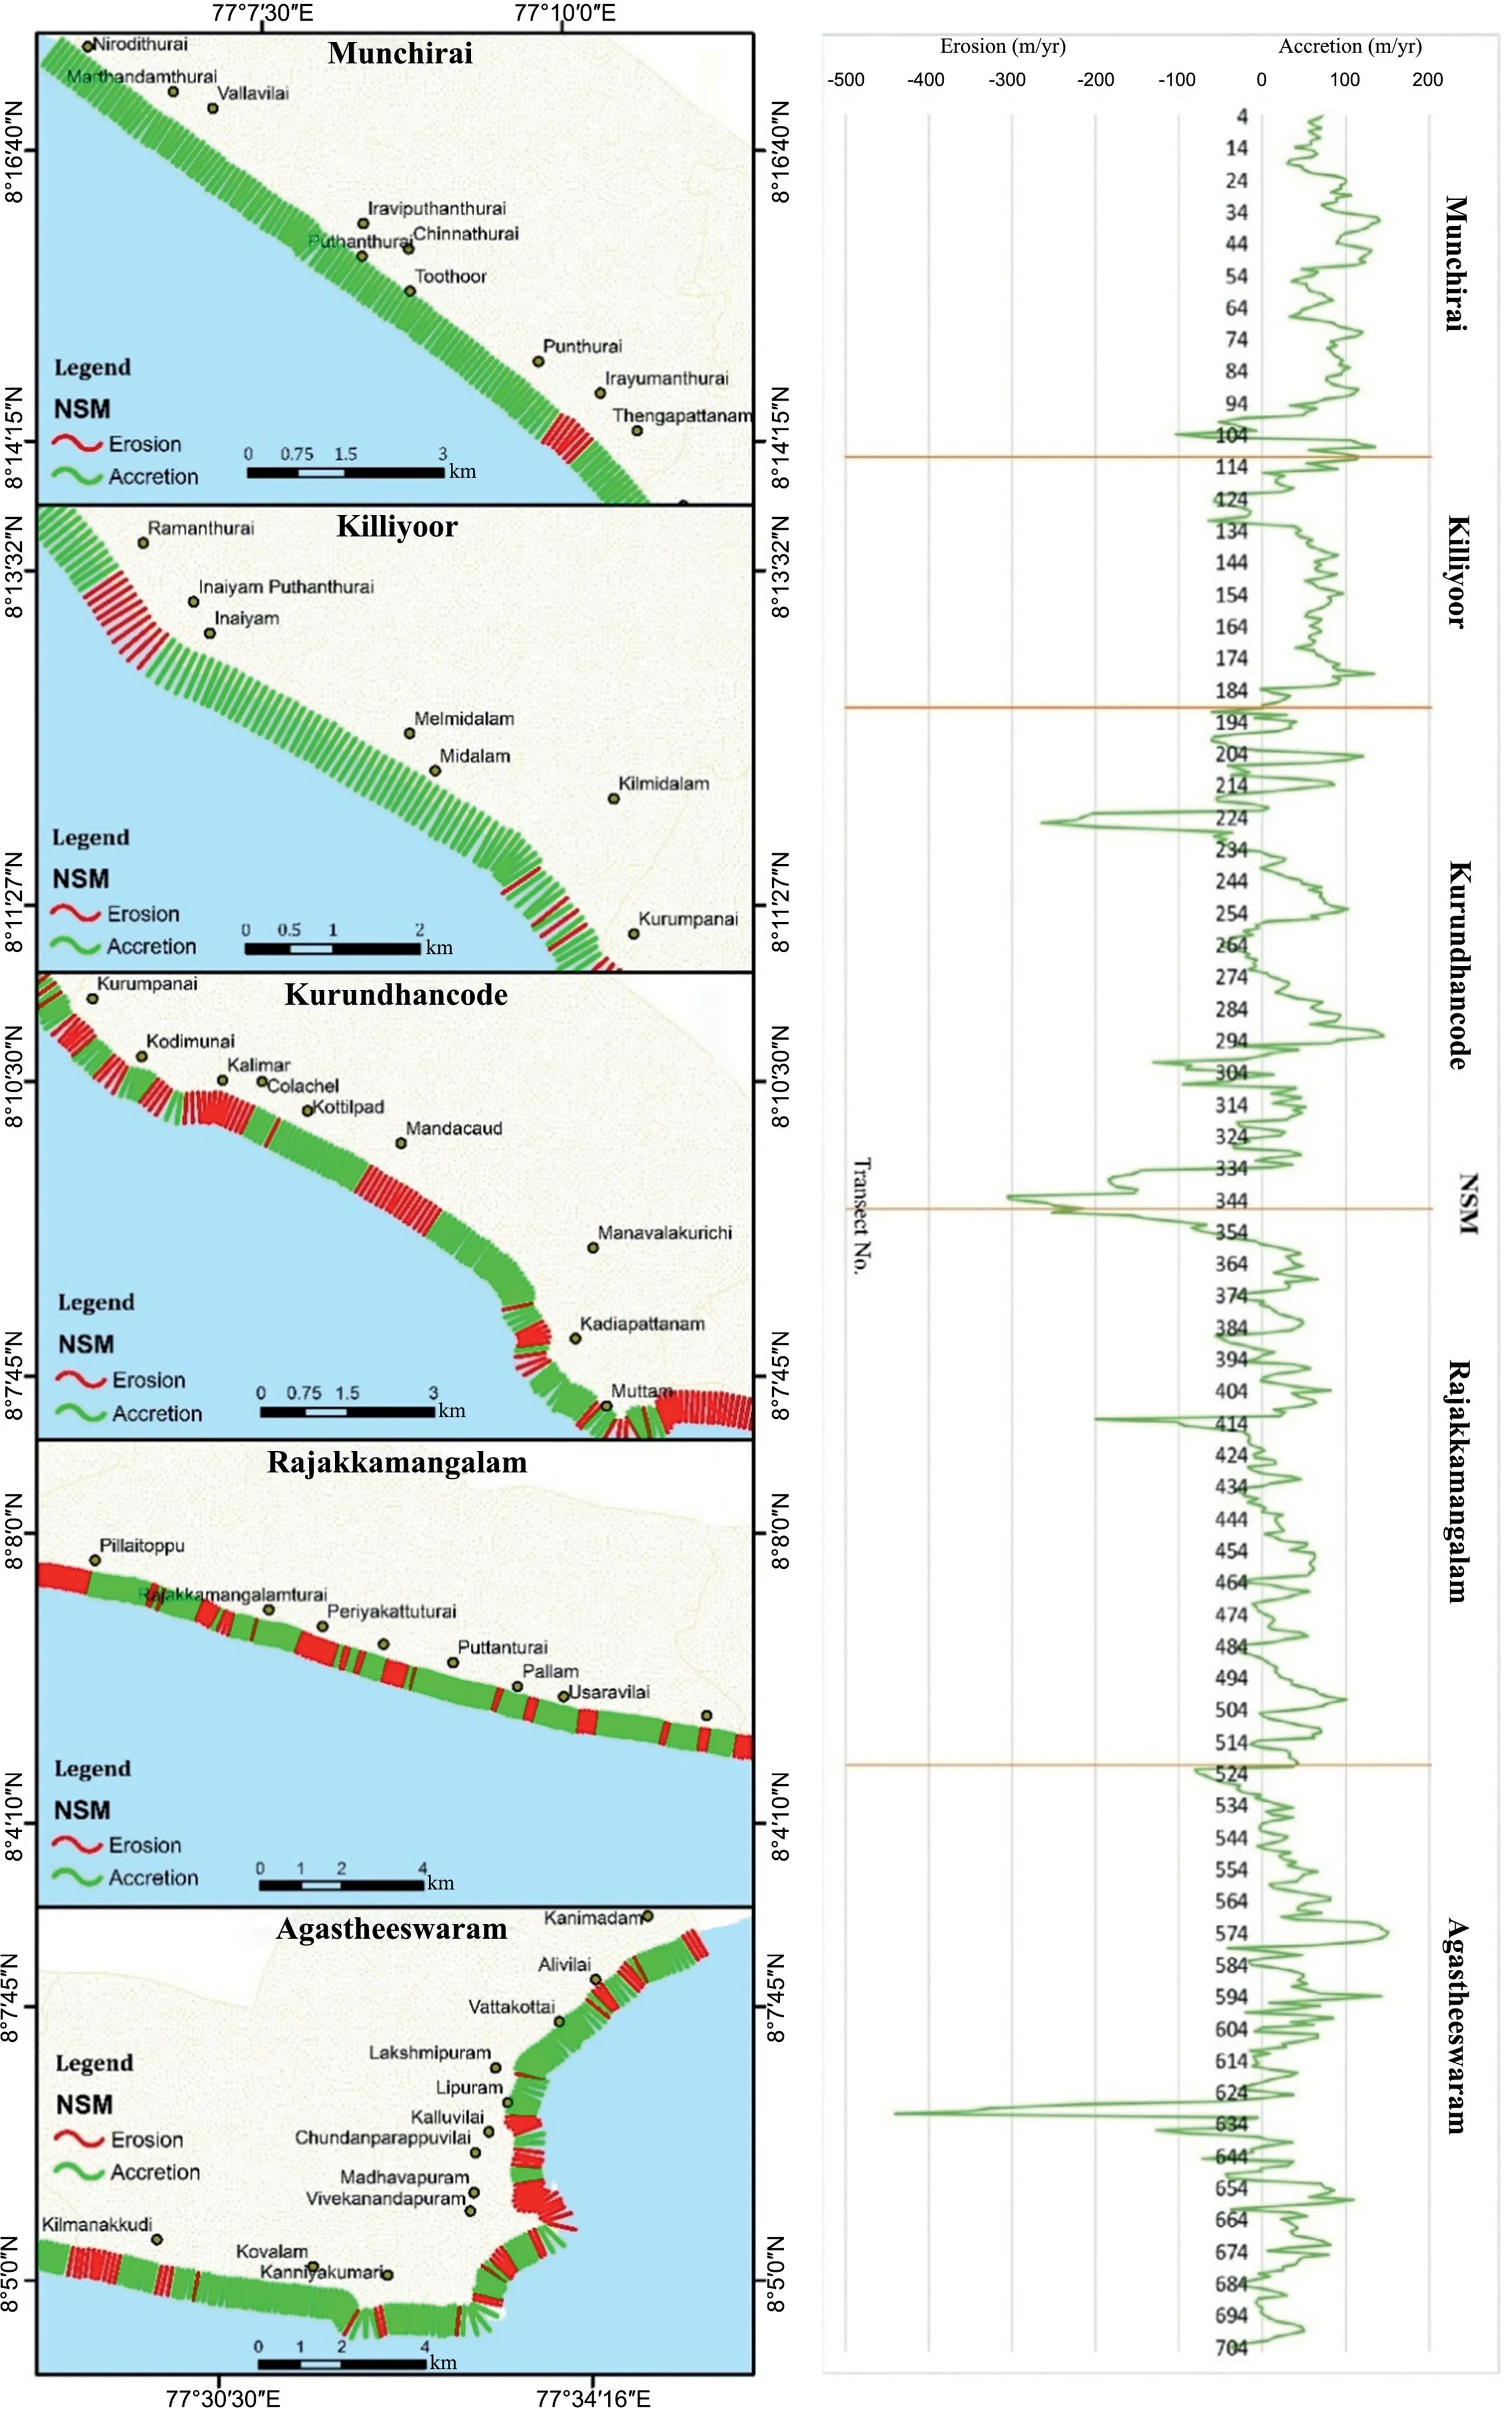
Fig. 6. The estimated NSM on all the five sectors between 1980 and 2020.
4.1.4. Rajakkamangalam
The transects fall in this sector is from 350 to 523. Mostly the coast remains stable with some high erosion, low erosion and low accretion zones.The highest erosion rate is noticed to be 5.01 m/yr(EPR) and 6.13 m/yr (LRR) at Periyakattuthurai, which is the backwash resulting from the wave drift caused by the groin constructed here.The maximum accretion in this region is 2.53 m/yr(EPR)and 2.08 m/yr (LRR) at Manakudi. Accumulation is high in this region because of the sediments transported and deposited by the Pazhayar river. The highest NSM is noticed at Periyakattuthurai,covering an area of 200.13 m of erosion and at Manakudi,an area of 101.06 m under the accretional zone. Low erosion (-4 to -1 m/yr LRR)is noticed at Pillaithoppu and Low accretion(1-4 m/yr LRR)is at Puthanthurai and Pallam. A large quantity of sediment deposition forms the sand beaches on Pillaithoppu and Rajakkamangalam coast [57].
4.1.5. Agastheeswaram
The transects 524 to 705 are enclosed in this sector.This coastal stretch is noticed with low erosion, low accretion and stable shoreline. The highest deterioration is due to the anthropogenic activity and the littoral drift instigated by the groins constructed in the Chinnamuttam fishing harbor.The maximum erosion is noticed to be 3.19 m/yr (EPR) and 2.81 m/yr (LRR) at Madhavapuram and the supreme accretion is 3.77 m/yr (EPR) and 3.11 m/yr (LRR) at Kovalam. The highest NSM accretion zone is 150.5 m at Kovalam and the erosion area is 127.31 m at Madhavapuram.The low erosion(-4 to -1 m/yr LRR) is noticed at Kilmanakudi, Kalluvilai and Madhavapuram. Low accretion (1-4 m/yr LRR) is seen in Kanyakumari, Kovalam, Vivekanandhapuram, Lipuram and Kanimadam.This region accumulates by deposition of the suspended sediments by the western and eastern colliding waves [58]. Also, the littoral drift and the river discharge maintain the coast's volume in this region[40].
4.2. Prediction of 2030 and 2040 shorelines
The Kalman filter model in the beta forecast predicts the future shoreline for 2030 and 2040.The high erosion-threatening villages for the foretold years and the future prediction map are given in Fig. 7.
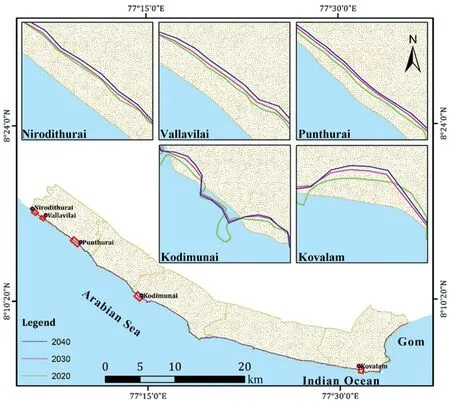
Fig. 7. The predicted shoreline of 2030 and 2040.
Ramanthurai, Inayam, Kodimunai, Kottilpad, Mandaicaud, Pillaithopu,Periakatuthurai,Pallam,and Manakudi might be prone to high risk of erosion. By 2030, the shorelines of the above villages might be 103 m,170 m,145 m,97 m,83 m,91 m,157 m,92 m and 81 m and might reach 111 m,194 m,165 m, 100 m, 85 m, 97 m,182 m, 100 m and 83 m by 2040 respectively. The villages Eraviputhenthurai, Thoothoor, Erayumanthurai, Midalam, Kurumpanai,Manavalakurichi, Puthanthurai, Vivekanandhapuram, Allivilai and Kanimadam might also be subjected to erosion ranging from 50 m to 80 m by 2030 and 2040.The very high wave energy experienced throughout the western coast[36]instigates the erosion along the west coast of the study area more than that of the eastern coast.
Even though Nirodithurai,Vallavilai,Punthurai and Kovalam are in the accretion zone, the expected future shoreline is prone to erosion based on the historical shoreline dynamics. By 2030 Nirodithurai might experience an erosion of 49 m and be withdrawn to 42 m in 2040.Vallavilai,Punthurai and Kovalam might experience erosion of 40 m,28 m and 31 m by 2030 and would be taken out to 24 m,11 m, and 16 m by 2040. Kodimunai is already experiencing erosion, might also likely to have a very high erosion of 138 m by 2030 and will increase to 156 m by 2040. These villages are unambiguously marked as further erosion resulting in substantial economic loss owing to the predicted backwash.
5. Conclusion
The long-term shoreline changes for the past four decades from 1980 to 2020 for the Kanyakumari coast are assessed using DSAS 5.0. The westerly and the easterly blown wind, waves, the littoral drift prompted by the constructed structures, and the anthropogenic influences play a vibrant role in erosion and accretion. The forthcoming shoreline for the years 2030 and 2040 is also predicted to formulate precautionary plans to reduce the effects of coastal vulnerability. Accordingly, during these decades, the maximum erosion recorded at Periyakattuthurai is 5.01 m/yr EPR and 6.13 m/yr LRR.In the same way,the maximum accretion of 3.77 m/yr EPR and 3.11 m/yr LRR is experienced at Kovalam, respectively. The shoreline shift is impended to 200 m at the erosion zone and advanced by 150 m at the accretion zone. In the study area, the following villages, namely Ramanthurai, Inayam, Kilmidalam,Kurumpanai, Kodimuani, Kadiapattanam, Pillaithoppu Kilmanakudi,Kalluvilai,and Madhavapuram are subjected to erosion due to the wave energy and wave drift caused by the jetties and the groins constructed in this region.
The Periyakattuthurai coast might be further depleted by 157 m by 2030 and extend to 182 m by 2040.Inayam(170 m by 2030 and 194 m by 2040)and Kodimunai(145 m by 2030 and 165 m by 2040)are also predicted with very high erosion risks.Though these coasts might experience a very high erosion, Nirodithurai, Vallavilai,Punthurai, Kovalam, and Kodimunai might experience erosion by 2030 and 2040, leading to the menace of losing the economy and livelihood of the people in this region.
Based on the study along these coastal villages and forecasting,it is determined that the risk of disaster along the west coast is high.Collective adaptive measures should be implemented to reduce the effect of erosion. These coastal protection measures must be constructed relevant to the existing coastal protection structures,where the erosion is recorded high due to the wave action.This will reduce the impact of the waves acting upon the coast to diminish the risk of erosion.
Conflict of interest
The authors declare that there is no conflicts of interest.
Acknowledgments
The authors are thankful to the Centre for Applied Geology,Gandhigram Rural Institute - Deemed to be University for providing facilities to carry out this study.
No funding was received.
杂志排行
Geodesy and Geodynamics的其它文章
- Models (form) of long-, medium- and short-term earthquake precursors
- Testing of new ionospheric models along the meridian 110° E over the Northern Hemisphere
- Non-carcinogenic health risk assessment of nitrate and fluoride contamination in the groundwater of Noyyal basin, India
- Possibilities of mapping neotectonic elements based on the interpretation of space images: A study of Fergana Depression
- Crustal structure of the Qiangtang and Songpan-Ganzi terranes(eastern Tibet) from the 2-D normalized full gradient of gravity anomaly
- Thermospheric density responses to Martian dust storm in autumn based on MAVEN data