Thermospheric density responses to Martian dust storm in autumn based on MAVEN data
2022-10-18PengHnShunggenJinJinongLiuYwenLi
Peng Hn , Shunggen Jin , Jinong Liu , Ywen Li
a School of Remote Sensing and Geomatics Engineering, Nanjing University of Information Science and Technology, Nanjing 210044, China
b School of Surveying and Land Information Engineering, Henan Polytechnic University, Jiaozuo 454000, China
c Shanghai Astronomical Observatory, Chinese Academy of Sciences, Shanghai 200030, China
d Nanjing University of Science and Technology, Nanjing 210094, China
Keywords:Mars Thermospheric atmosphere Dust storm GCM simulation
ABSTRACT The unique seasonal surface dust storms on Mars have a significant impact on the Martian atmosphere.However,due to the lack of observations,semi-empirical models are difficult to simulate the density changes in the thermosphere with the existence of dust storms in detail.Data from multiple Mars probes now offer new opportunities to study the detailed response of Martian dust storms to the upper atmosphere.In this paper, we use MAVEN accelerometer and mass spectrometer to study the variations of the Martian thermosphere density in autumn between MY 32 and MY34(The corresponding Earth dates:February 11,2015 to February 28,2019),and use the seasonal model with dust storm index to fit the annual data of the above three Martian years.The results show that the thermosphere density has a clear response to the surface dust storm activity. Furthermore, the spatial distribution of measured data in autumn (northern hemisphere) is compared with the atmospheric densitydistribution simulated by the general circulation model(GCM)under specific initial conditions. The model simulation results agree well with the thermospheric density distribution characteristics of each Martian year under the initial strong dust storm conditions. It proves the important role of global dust storm in changing the structure of the Martian thermospheric atmosphere.
1. Introduction
In recent years, Mars has gradually become the focus of researchers with the development of planetary science and related exploration activities as a terrestrial planet[1,2].Among them,the characteristics of the Martian atmosphere have become an important topic to explore the evolution of Martian habitability[3].Dust storms on the surface of Mars are widely studied by researchers as key internal factors controlling seasonal, annual, and even shortterm climate changes on Mars [3-5]. Observations by multiple probes show that the Martian atmosphere is strongly responsive to dust storm activity on the surface [6,7].
The first direct observations of surface wind speeds and dust storms come from landers such as Mariner 9 [8]. Keating et al. [9]found the strong responses of thermosphere density(around125 km)to dust storms on the surface of Mar observed in autumn density data from the Mars Global Surveyor (MGS) accelerometer. Subsequent accelerometer density data of several detectors show the existence of this impact response relationship [10,11]. At the same time, global duststorms have asignificant impacton thewaterand CO2circulation in the Martian atmosphere[5,7].Sand-tide cycles,driven primarily by dust storms,are important factors in the short-wave solar radiation and atmospheric circulation,and are believed to play a key role in the overall Martian climate system and atmospheric changes[2].Model studies show that upper atmospheric wind field,density,and thermal structure have immediate response to dust storms [12,13].Liu et al.[14]explain the coupling process of gravity wave and dust activity in the atmosphere by using multi-satellite accelerometer data and model data. The global dust storm occurs on Mars every year and provides a good observation opportunity to study the relationship between dust storms and upper global density distribution characteristics.
In this paper,the annual variation of atmospheric density caused by dust storms is fitted with the observation data of nearly three Martian years,and the time-varying characteristics of atmospheric density during autumn dust storms in the Northern Hemisphere are studied. The global distribution characteristics of atmospheric density during autumn dust storms in the Northern Hemisphere are explored and analyzed. The measured data are compared with the atmospheric density distributions simulated by the General Circulation Model (GCM) under specific initial conditions. The relationship between autumn atmospheric distribution and global dust storms is discussed by comparing model simulation,measured data, and phenomenon characteristics.
2. Data and processing methods
2.1. IR-CDOD data for dust storms
Laboratoire de M´et´eorologie Dynamique (LMD) uses the data from Thermal Emission Spectrometer(TES) data on MGS, Thermal Emission Imaging System (THEMIS) on Mars ODY, and the Mars Climate Sounder (MCS) on MRO from April 1999 to March 2018 to provide the dust storm data from MY 24 (Martian Year) to MY 34 year. The method is performed by griding the available retrieval values of the optical thickness of the column dust from the TES and THEMIS Nadir observations, as well as the estimated values of the MCS limb observations and quantities. To verify the CDOD observations, the irregular grid map is generated using PanCam camera and the Mini-TES spectrometer on the U.S. Rover Spirit and Opportunity, the Surface Stereoscopic Imager on the Phoenix lander,the Compact Reconnaissance Imaging Spectrometer for Mars, and the MRO The Mars Color Imaging Camera and the MastCam camera on the Mars Science Laboratory curiosity.Then the kriging method is used to interpolate the irregular gridded maps to generate the conventional CDOD maps.In this study,the three-dimensional data are presented in a planar form to further analyze the influence of dust storm activity on the Martian thermosphere density. The IRCDOD dataset can be found in http://www-mars.lmd.jussieu.fr/mars/dust_climatology/index.html.
2.2. MAVEN accelerometer and neutral gas and ion mass spectrometer data
Mars Atmosphere and Volatile Evolution Mission(MAVEN)aims to study the driving forces and related reactions of the Martian upper atmosphere in order to quantitatively understand the current escape mechanism and its possible contribution to the historical evolution of the atmosphere [16]. The Accelerometer (ACC)and Neutral Gas and Ion Mass Spectrometer(NGIMS)provide a new data source for studying the density structure and its long-term changes in the upper atmosphere of Mars.
The molecular number density and ACC mass density of various atmospheric components(O,CO,Ar and CO2)obtained by MAVEN/NGIMS from local observations are used for the study.As shown in Fig.1, the data has good coverage of time and space.
The NGIMS instrument onboard MAVEN is a quadrupole mass spectrometer that measures the density of neutral gases and ions between 2 and 150 atomic mass units in the Martian upper atmosphere [17]. Data used in this study spanned nearly three Martian years (MY32, MY33, and MY34; Corresponding Earth dates: February 11, 2015, to February 28, 2019) (https://lasp.colorado.edu/maven/sdc/public/pages/datasets/ngims.html). The coverage of data is shown in Fig.1.
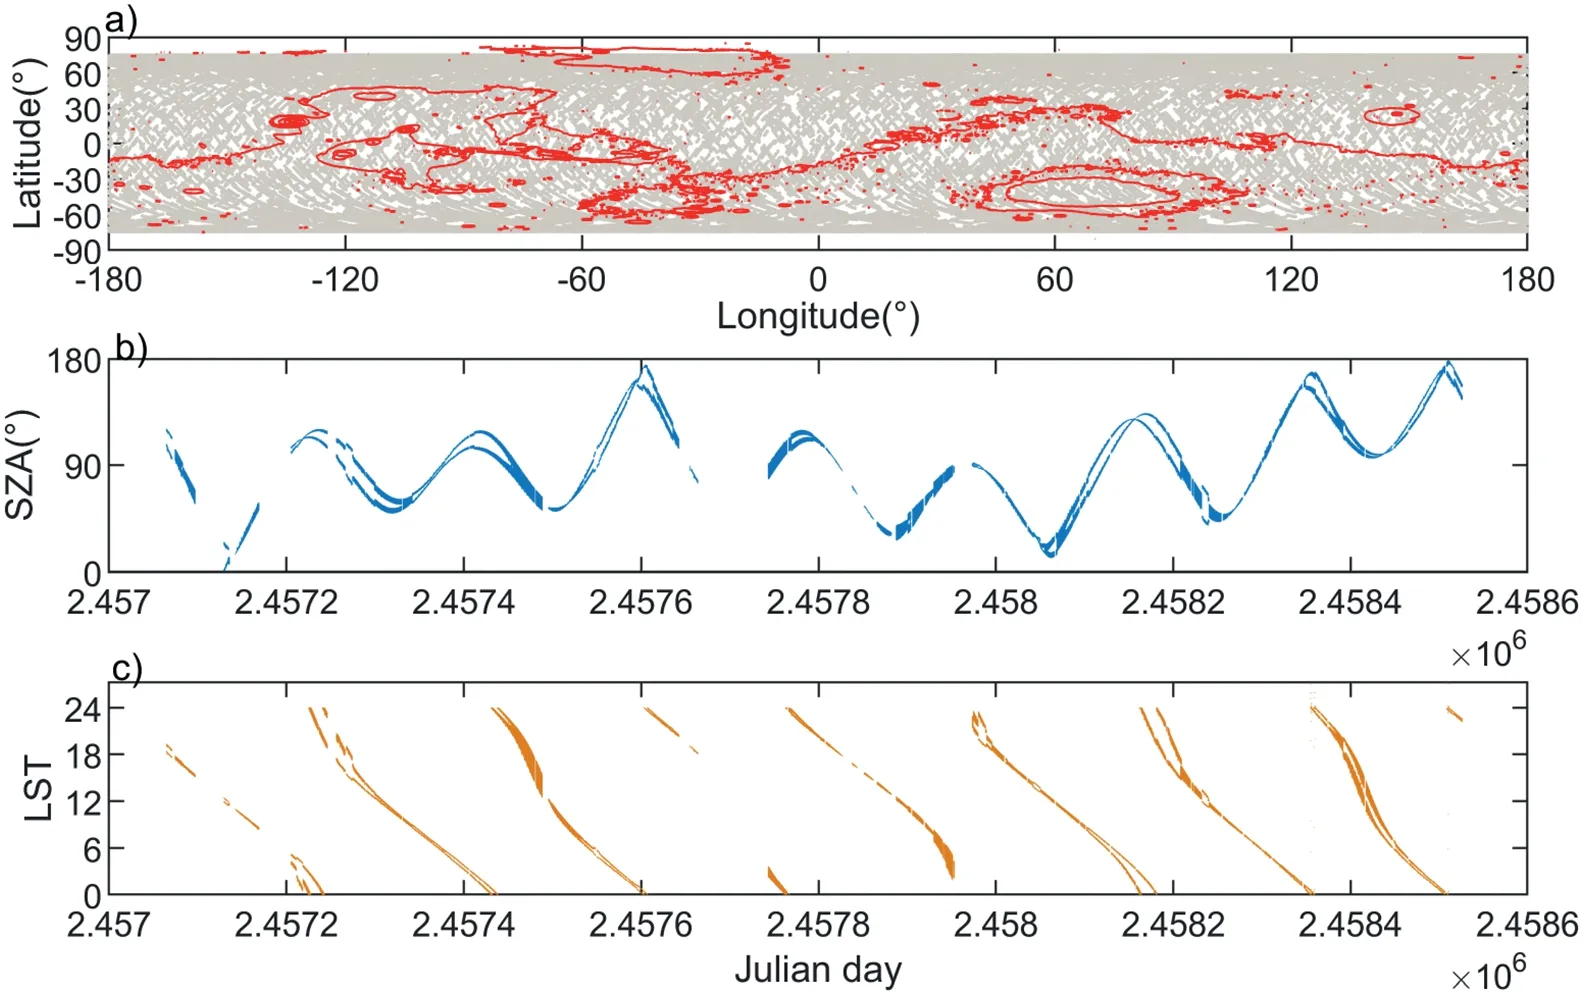
Fig.1. The sampling distribution diagram of accelerometer data and NGIMS data.Each point in the figure represents a data sampling point.The abscissa is longitude,and the ordinate is latitude. The red background is a topographic map based on Martian topographic data. Figure (b) shows the variation of the Solar Zenith Angle (SZA) with the acquisition time of all data. (c) The local time of collection is described.
2.3. Data fitting
This study uses the Mars Climate Database (MCD) from the Laboratoire de M´et´eorologie Dynamique to process the data above,and the projection is transformed to a specific height for analysis and mapping.
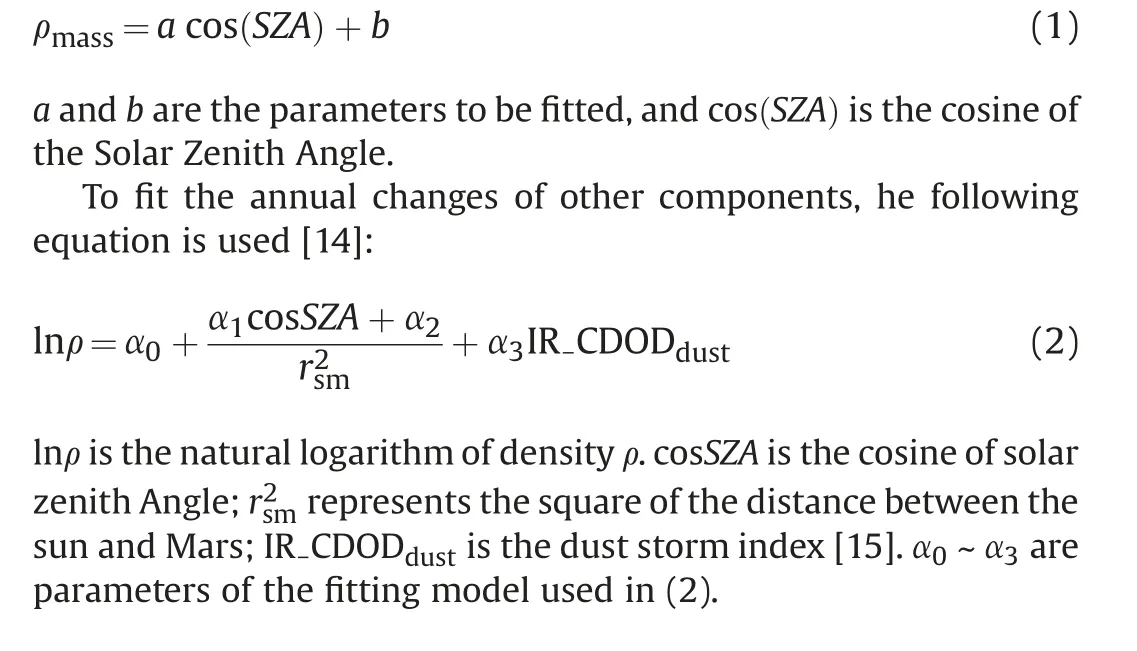
The density of O and CO are affected by photochemical reactions in the thermosphere as the derivatives of CO2.The intersection of O and CO2density occurs at an altitude of about 220 km, suggesting that solar heating becomes decisive at and above this altitude[18].For density fitting of O, we apply the equation at the height of 150 km-260km [19]:
3. Analysis of dust storm response
Results of thermospheric atmospheric components fitted by formula(1)and(2)are shown in Fig.2,and corresponding fitting parameters are given in Table 1.At different heights,the overall structure in autumn represents different density amplitude in the whole thermosphere with the increase of height only, and the changing trend tends to be the same.Therefore,the figure lists the data at the projected height of 160 km,and the fitting results at other heights are shown in the table above without further description.O content at low altitudes(below 200 km)is very low,and poor fitting may occur.Therefore,this paper uses data of high O atomic density at 220 km for fitting.Formula(2)is used to fit the atmospheric components sensitive to dust storms,suchasArandCO2.Inordertostudytheresponsesofthethermospheric atmosphere to autumn and winter dust storms,the influence of dust storm factors is particularly important. The dust storm cycle has accumulated observations over many years, and its scale is generally assessed by the IR-CDOD index described above(Fig.2e).Generally,if IR-CDOD data is greater than 0.15 Pa/Pa, global dust storms are considered to occur[4].The seasonal variation of atmospheric density in the Martian thermosphere is highly correlated with the dust storm index. The response of thermospheric atmospheric density to dust storms is captured for the first time by MGS[9].Thermospheric density is closely related to surface dust storms [12,13]. Even regional dust storms outside of the dust season can contribute to the Martian thermospheric changes with thedust activity increasing the amountof dust in the atmosphere and heating the lower atmosphere over a wide area,where the directeffects are upto 50-60km high,even to 200 kmwhen the dust storm is strong enough [20]. However, more detailed effect process of dust storms on the Martian thermosphere should be further studied in the future.

Fig.2. ModelfittingresultsofAr(Fig.a),CO2(Fig.b)andCO(Fig.c)molecularnumberdensityat160kmandO(Fig.d)at220kmnearlythreeMartianyearsbasedonNGIMSmoleculardensity data.The black dotted line represents the demarcation line for each Martianyear,and the green dottedline represents the demarcation line for the beginning of that Martianyear in autumn,Fig.e shows the variation of the dust storm index intensity and location over time in three Martian years on a Julian day and a latitude axis.

Table 1 Fitting parameters of each component at different projection heights using equation(1).
Long-term observations of these dust storms show seasonal and annual patterns.The dates of the autumn beginning of MY 33 and MY 34 are marked with a dotted green line in Fig. 2e, corresponding to January 3, 2016 (2457390.6939 for Julian Date) and November 20,2017(2458077.6746 for Julian date),respectively.From the perspective of seasonal variation,the Martian dust storms are a quiet period in the spring and summer seasons,when the autumn and winter are active. In terms of scale, spring and summer dust storms tend to be small-scale.Then the autumn and winter develop into high-intensity global dust storms.The annual variation shows a cyclic pattern of the movement and intensity change of dust storm regions:most of them occur in the high latitude polar regions of the northern and southern hemispheres in spring and summer, and move toward the equator and expand before the global dust storm season in autumn,and then move toward the poles in autumn and winter[10].
The fitting results are shown in Fig.2a-c,and the calculated fitting parameters are shown in Table 1.In order to highlight the influence of dust storms on fitting results, the fitting parameters and Root Mean Squared Error(RMSE)of Ar,CO,and other gases in formula(1)and(2)are listed. The Sum of Squares due to Error (SSE) are also given in Tables 1 and 2,respectively.In the fitting using formula(2)with dust storm factor(Table 2),all regression evaluationparameters are superior to formula (1) (Table 1) by comparison. Taking CO2 fitting as an example,RMSE of Table 1 at 160 km decreased by 66%compared with that of Table 2 (from 1.27× 10⁹to 4.34× 10⁹). The other fitting parameters are the same. It indicates that the observed data are less discrete,and the fitting result is better for the fitting curve of Formula(2). The fitted evaluation parameters in Table 2 are superior to those in Table 1 on the whole,suggesting that regional and even global dust storm activities play a key role in the annual changes in the density of the upper atmosphere of Mars. Supported by long-term data, the annual variation trend of the Martian atmosphere is well fitted in Fig.2.In the global dust storm of MY34,the density of all components except atomic O increases by about 2-5 times.Despite some missing data,the similar density increase is also seen in the MY32 dust storm season.Dust storm in MY33 is very weak,which is also one of the least active duststormsever recorded.However,MY33fittingresultsalsoindicatea clear response of thermosphere density to dust storms.
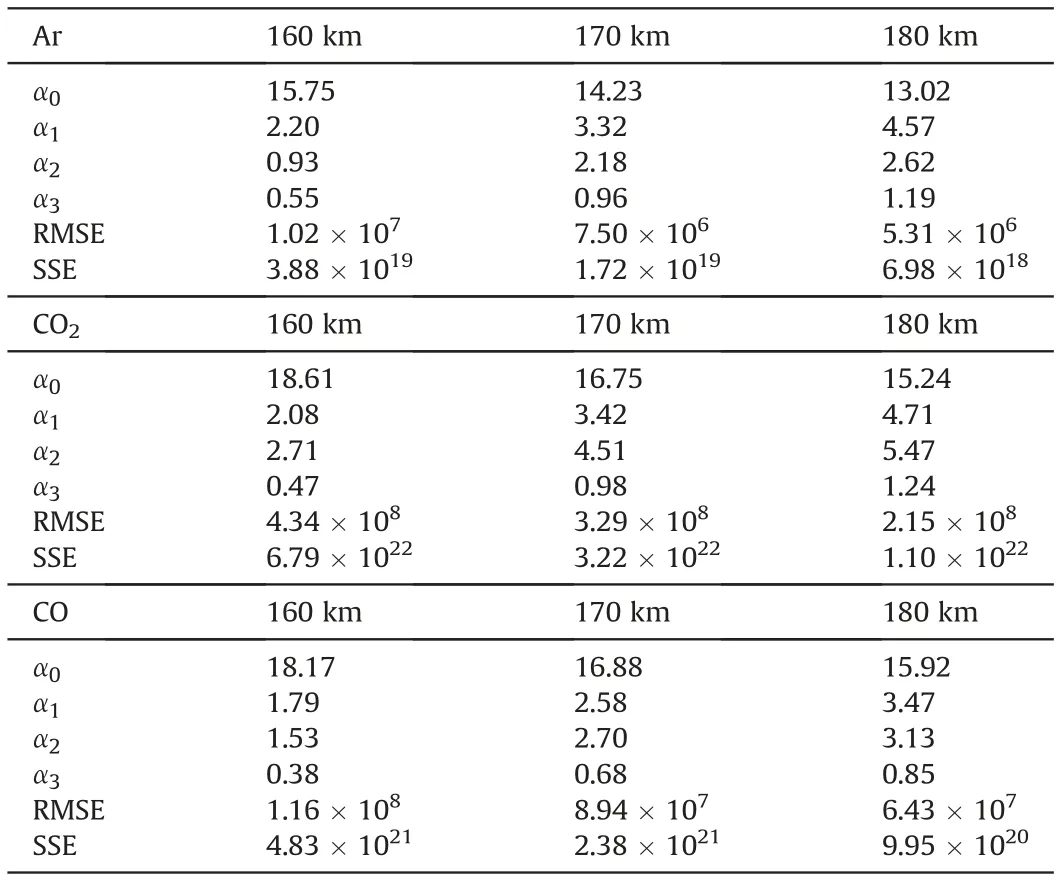
Table 2 Fitting parameters of each component at different projection heights using equation(2).
The analysis above shows that under the background of a strong dust storm, formula (2) has a better fitting effect on the season (e.g., MY34 years). During the autumn and winter season,the thermospheric atmospheric density produced an extremely obvious uplift and lasted long. This fitting reflects the global atmospheric density fluctuation from early autumn to winter in the whole dust storm season, and this density fluctuation also has relatively consistent trend characteristics with the global dust storm index represented by IR-CDOD. The density signatures of these four components all indicate the presence of mid-latitude planetary waves. The fluctuations of CO2(Fig. 2b) and Ar(Fig. 2a), which are highly responsive to dust storms and support the probable origin of this effect. For derivative O, the photochemical reaction is dominant, and dust storm response is not obvious. In other words, the overall uplift by a dust storm of the atmosphere caused a large increase in atmospheric density at a fixed altitude, which further affected the structure and characteristics of the atmospheric circulation.As an active factor existing on the surface of Mars for a long time, dust storms must play an irreplaceable role in the atmospheric evolution of Mars. Further effects of dust storms on the global distribution of atmospheric composition are discussed below.
4. Comparison with simulation results
LMD Martian Atmospheric General model Circulation Model(LMD-MAGCM) is used to verify and explain the observational results of the paper. The model is a large-scale atmospheric circulation model. This model is one of the best of its kind [21,22].Currently,the model covers altitudes from the surface to the outer layers of Mars 260 km altitude [23].
For the lower and middle atmospheres, models include carbon dioxide,water vapor,the dust storm cycle[21] and photochemical reaction process [24]; A series of small-scale dynamic processes such as turbulent diffusion, convection, topography, and gravitational waves are also considered. For the upper atmosphere,Infrared radiation transfer, ultraviolet/extreme ultraviolet (UV/EUV) heating, oxygen content variation, and photochemical reaction model are applied tothe thermosphere [25,26]. At the same time, the molecular diffusion and friction effects neglected are considered and added plasma multifluid dynamics nuclei [27].
Three-dimensional finite difference method is used to solve the basic dynamic equation on the sphere.The horizontal latitude and longitude grids are 3.75°× 5.625°; Vertical spacing is achieved by combination: for the atmosphere below 50 km, adopt σ=p/psas coordinates,where psrepresents the surface pressure of Mars;For above 50 km,barometric coordinates are used.The interval is about half of the atmospheric elevation (7 km).
The basic calculation process is as follows: (1), When a value is assigned to a variable, initial value of the moment is given by observation or empirical value; (2) calculate the partial derivative for each physical process acting on the variable,;3)For the variable at the next moment of an equal interval, numerical integration is performed to ensure the value of the current moment.
We selected the observation density data of three different projection heights (170 km, 180 km, 190 km), different components (accelerometer, CO2, CO, etc.) and different measurement methods (accelerometer and mass spectrometer) for analysis. The time coverage of data is MY33 (Fig. 3) and MY34 (Fig. 4). MY32 is not discussed in this part due to the lack of autumn data. Almost all local time or solar zenith angle conditions are included (Fig.1b and c).
As shown in Figs. 3 and 4, it can be observed from the global density distribution at different altitudes in autumn. During the autumn of the northern hemisphere,the density in the middle and high latitudes of the southern hemisphere increases to the highest density region in the world, while the equatorial region and the northern hemisphere have extremely low density distribution.The data distribution from different altitudes and discontinuous observation show this characteristic. In addition, MY33 and MY34 show similar distribution patterns in the data records of three Martian years, proving that the distribution is a feature of global atmospheric density distribution occurring in Martian autumn,rather than the result of observational error. The extremely low autumn equatorial density of the four components and the accelerometer density suggests that the structure may be mainly caused by large-scale dynamics such as trans-hemispheric atmospheric circulation and dust storm impact, but weakly related to solar radiation. During the Martian dust storm, the thermospheric atmospheric density of Mars is extremely disturbed, indicating global heterogeneity of density distribution and annual variations in longterm development.

Fig.3. Global griddistribution diagramof density data of Mars Year 33 atthree naturalizedaltitudes(170 km,180 km,190 km),the abscissa of eachsubgraph is longitude,and the ordinate is latitude.Each pixel represents a sampling point,representing the accelerometer data(Fig.a,f,k),Ar(Fig.b,g,l),CO2(Fig.c,h,m),CO(Fig.d,i,n)and O(Fig.e,j,o)respectively.
To further verify this conclusion, this paper uses the GCM model with dust storm factor to simulate the global atmospheric density distribution. The intensity of dust storm between the quiet global dust storm MY33 (IR-CDOD less than 0.5 Pa/Pa)and the great global dust storm MY34 (IR-CDOD peak more than 0.9 Pa/Pa) is selected to use. Fig. 5 shows the global density distribution of GCM model simulated under strong dust storm conditions(IR-CDOD >0.75 Pa/Pa).The model shows that at the beginning of the dust storm season with global data coverage (Fig. 5a and b), the high density is mainly concentrated in the middle and high latitudes near the southern hemisphere, and the density in the equatorial latitudes is relatively low. This simulation result is highly consistent with the distribution characteristics of the observed data. At this time, the dust storm season just begun, the global dust storm began to have a significant impact on the atmospheric structure, and the atmospheric density distribution had an obvious response. Although the detector could not collect the data of the poles ideally (as shown in Fig. 4f, k, j, l, etc.), the measured high-density data are still distributed in the mid-latitude region of the southern edge of the data sampling. In MY34 with the highest dust storm intensity and MY33 with complete data distribution, the measured results are both in good agreement with the simulated data. The seasonal evolution of the northsouth asymmetry suggests that the Martian thermosphere is influenced by the interhemispheric circulation of the lower and middle atmospheres, such as solar and dust storm activity. As a matter of fact, with the approach of winter, the CO2ice sheet in the southern polar region is vaporized, leading to a violent CO2hemispherical cycle. It results in the CO2circulation from the polar region to the equator and even the global, and intensifies the jet circulation in the mid-latitude region, thus changing the global density distribution to some extent. This hemispheric cycle, driven by solar energy input and dust, will dominate the Martian thermosphere during the winter and produce extreme heat [6]. Autumn is the dustiest season of the year, and dust storms can affect the thermosphere through large-scale dynamics or dust radiation, a process not yet dominated by solar heat. The results of the atmospheric circulation model under the condition of strong dust storms are in good agreement with the observed data, which presents that the thermosphere density in autumn is low in the north and high in the south.That means the process is driven by dust storms and not the other way around. The global dust storms have a key influence on this phenomenon. In addition, in September (Fig. 5c), the simulation results show the high-density distribution in the polar regions, which shows that the dust storms affect this process more than models prediction, and the process of atmospheric impact in the early and late autumn dust storms is not exactly the same. The specific impact range and physical mechanism, as well as the subsequent impact of dust storms on atmospheric circulation patterns,need to be further explored in the future.
5. Conclusion
The responses of autumn dust storms to the thermospheric atmosphere of Mars are studied.Firstly,the main components of the Martian thermospheric atmospheric density are analyzed by using a four-parameter fitting model, and the annual characteristics and seasonal variation characteristics are described.It proves the effect of dust storms on atmospheric density at a fixed height. Secondly,the distribution feature of the Martian thermospheric density in autumn is discovered, andthe accelerometer data (secondary derivation data) and mass spectrometer data (in-situ observation data)of MAVEN are used to verify.Finally,the GCM model is used to simulate the atmospheric density distribution of Mars in autumn.The effects of dust storms are evaluated,and the spatial distribution of density is investigated.

Fig. 4. Global grid distribution diagram of density data of MY 34, the abscissa of each subgraph is longitude, and the ordinate is latitude. Each pixel represents a sampling point,representing the accelerometer data (Fig. a, f, k), Ar (Fig. b, g, l), CO2 (Fig. c, h, m), CO (Fig. d, i, n) and O (Fig.e, j, o) respectively.
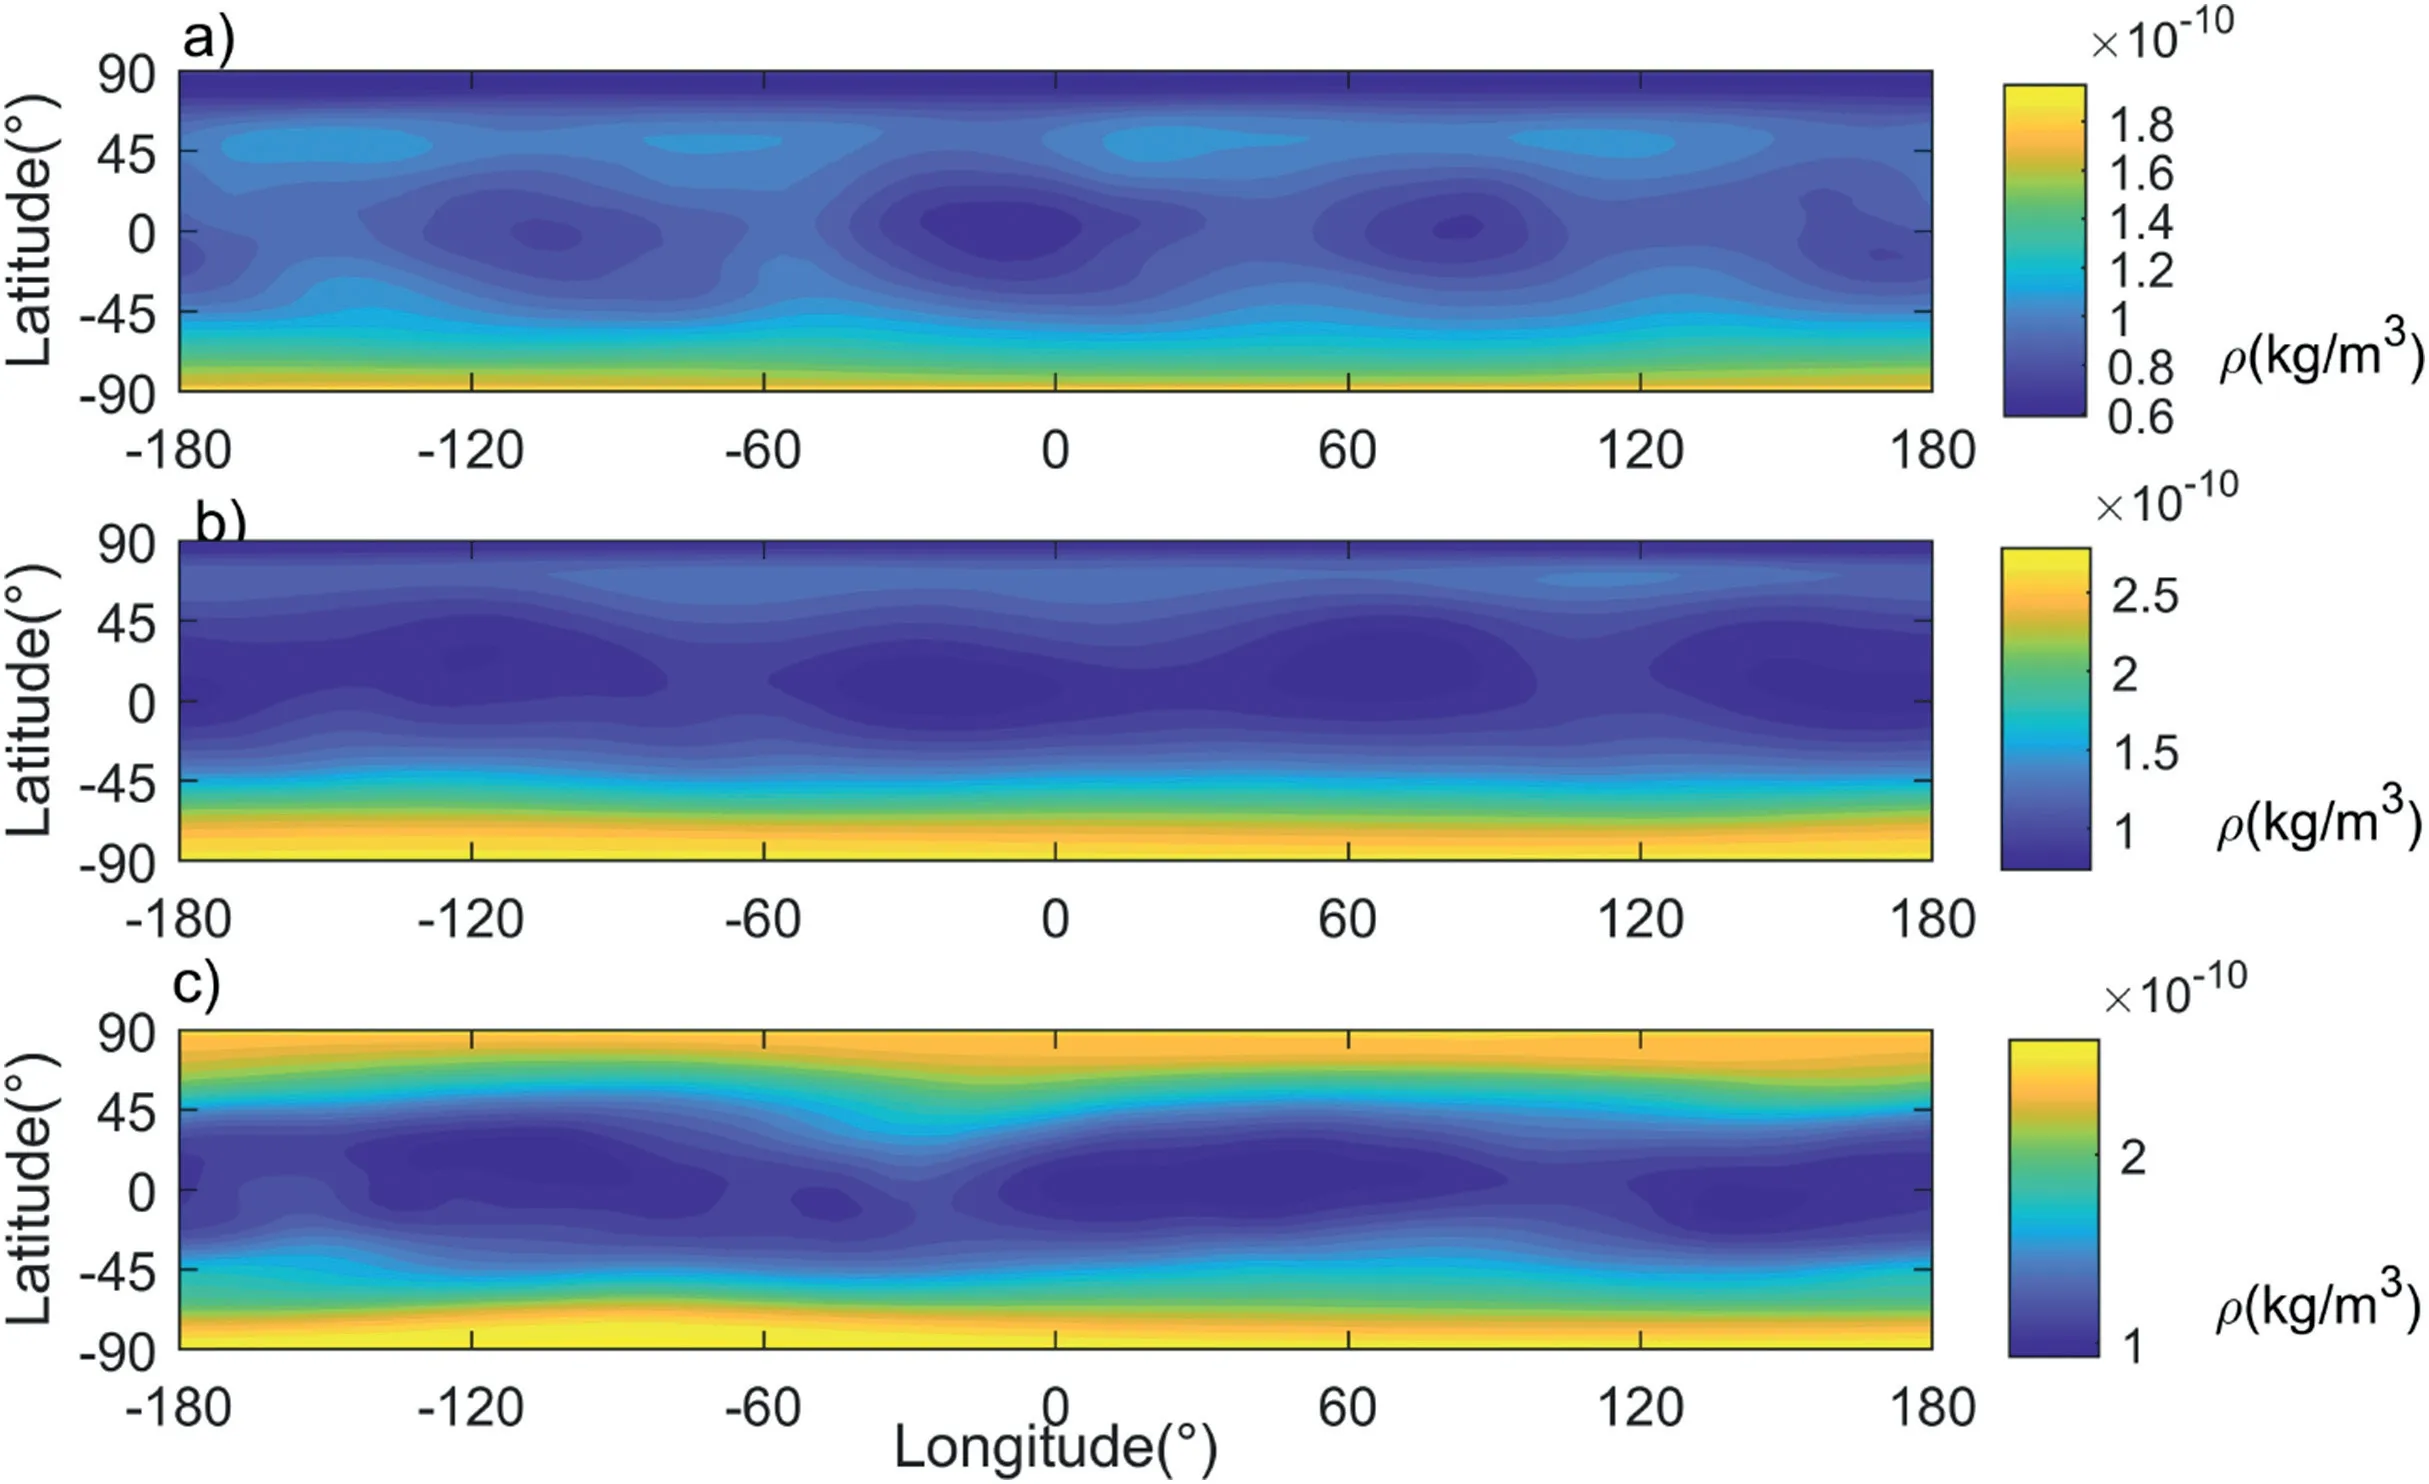
Fig.5. Global density distribution data in July(a),August(b)and September(C)of the Martian year fitted by the model.abscissa is longitude,when ordinate refers to latitude,figs.a,b, c are density contour maps generated by simulation results.
The results show that the model is in good agreement with the variation and distribution characteristics of the thermospheric atmosphere in autumn, especially in the Martian years with high dust storm intensity and the components more sensitive to dust storm. The model simulation results are consistent with the occurrence and development rules of dust storms mentioned above. The model correctly predicts the characteristics of autumn cooling in the equator and arctic and high density distribution in the polar regions of the southern Hemisphere caused by dust stroms, which shows the feasibility of the model to correctly simulate the effects on atmospheric circulation. This makes it possible to study the specific mechanism and subsequent development of the dust storm on the thermospheric atmosphere. GCM simulation results explain the key role of dust storm and CO2cycle on Mars global atmospheric structure through the influence of dust storm factor. Dust storm has an equatorial cooling effect on the spatial distribution of Mars atmospheric density through the influence of atmospheric circulation called two-cell meridional circulation pattern[28-30]. The influence of global dust storms on the spatial distribution of global atmospheric density in autumn is crucial. It may provide strong verification and follow-up support for the establishment of the Mars atmosphere model and the study of the evolution of the Martian atmosphere.
Credit author statement
Han Peng: Conceptualization, Methodology, Software, Investigation, Formal Analysis, Writing - Original Draft.
Shuanggen Jin: Data Curation, Review & Editing.Jiandong Liu: Data Curation, Visualization, Investigation.Yawen Li: Resources, Supervision.
Conflicts of interest
The authors declare that there is no conflicts of interest.
杂志排行
Geodesy and Geodynamics的其它文章
- Models (form) of long-, medium- and short-term earthquake precursors
- Testing of new ionospheric models along the meridian 110° E over the Northern Hemisphere
- Non-carcinogenic health risk assessment of nitrate and fluoride contamination in the groundwater of Noyyal basin, India
- Possibilities of mapping neotectonic elements based on the interpretation of space images: A study of Fergana Depression
- Crustal structure of the Qiangtang and Songpan-Ganzi terranes(eastern Tibet) from the 2-D normalized full gradient of gravity anomaly
- Coastal transgression and regression from 1980 to 2020 and shoreline forecasting for 2030 and 2040, using DSAS along the southern coastal tip of Peninsular India