The effect of the density difference between supercritical CO2 and supercritical CH4 on their adsorption capacities: An experimental study on anthracite in the Qinshui Basin
2022-09-23SiJieHanShuXunSangPiaoPiaoDuanJinChaoZhangWenXinXiangAngXu
Si-Jie Han , Shu-Xun Sang ,,*, Piao-Piao Duan , Jin-Chao Zhang ,Wen-Xin Xiang , Ang Xu
a Jiangsu Key Laboratory of Coal-based Greenhouse Gas Control and Utilization,China University of Mining and Technology,Xuzhou,Jiangsu,221008,China
b Carbon Neutrality Institute, China University of Mining and Technology, Xuzhou, Jiangsu, 221008, China
c School of Resources and Geosciences, China University of Mining and Technology, Xuzhou, Jiangsu, 221116, China
Keywords:CO2 geological storage Competitive adsorption Deep unmineable coal Average number of layers of adsorbed molecules Density ratio between free phase and adsorbed phase Micropore filling
ABSTRACT Deep unmineable coals are considered as economic and effective geological media for CO2 storage and CO2 enhanced coalbed methane (CO2-ECBM) recovery is the key technology to realize CO2 geological sequestration in coals. Anthracite samples were collected from the Qinshui Basin and subjected to mercury intrusion porosimetry, low-pressure CO2 adsorption, and high-pressure CH4/CO2 isothermal adsorption experiments.The average number of layers of adsorbed molecules(ANLAM)and the CH4/CO2 absolute adsorption amounts and their ratio at experimental temperatures and pressures were calculated.Based on a comparison of the density of supercritical CO2 and supercritical CH4,it is proposed that the higher adsorption capacity of supercritical CO2 over supercritical CH4 is the result of their density differences at the same temperature. Lastly, the optimal depth for CO2-ECBM in the Qinshui Basin is recommended.The results show that:(1)the adsorption capacity and the ANLAM of CO2 are about twice that of CH4 on SH-3 anthracite.The effect of pressure on the CO2/CH4 absolute adsorption ratio decreases with the increase of pressure and tends to be consistent.(2)A parameter(the density ratio between gas free and adsorbed phase (DRFA)) is proposed to assess the absolute adsorption amount according to the supercritical CO2/CH4 attributes. The DRFA of CO2 and CH4 both show a highly positive correlation with their absolute adsorption amounts, and therefore, the higher DRFA of CO2 is the significant cause of its higher adsorption capacity over CH4 under the same temperature and pressure. (3) CO2 adsorption on coal shows micropore filling with multilayer adsorption in the macro-mesopore,while methane exhibits monolayer surface coverage. (4) Based on the ideal CO2/CH4 competitive adsorption ratio, CO2 storage capacity,and permeability variation with depth,it is recommended that the optimal depth for CO2-ECBM in the Qinshui Basin ranges from 1000 m to 1500 m.
1. Introduction
In the context of China's coal-dominated energy structure,CCUS(carbon capture, utilization, and storage) technology is an important part of the country’s large-scale carbon emissions reduction strategy, which aims to achieve carbon neutrality by 2060. Of the different geological storage methods, CO2storage enhanced coalbed methane (CO2-ECBM) is considered to be an important pathway for achieving both carbon emissions reduction and the efficient development of CBM since the injected CO2displaces methane from CH4-bearing coal seams in the process of being stored (Yang et al., 2015; Liu et al., 2019). Although a few studies have suggested that CH4has stronger interactions with coal compared to CO2at low pressures(Busch et al.,2006),most studies regarding the competitive adsorption of CO2/CH4mixtures on coals indicate that it is CO2which has the higher adsorption capacity(e.g.Tang et al.,2004;Dai et al.,2009;Weniger et al.,2012;Zhou et al.,2013a; Luo et al., 2018). In these studies, the CO2/CH4adsorption ratio varies from 1 to 10, and a relative decrease in the adsorption ratio with the increase of coal rank has also been observed (Busch and Gensterblum, 2011). The adsorption selectivity of CO2/CH4is affected by moisture, vitrinite content, temperature, gas concentration,pressure,and other factors(Busch et al.,2006;Ottiger et al.,2008; Weishauptov′a et al., 2015). Although these influencing factors have different ways of acting on adsorption selectivity,the root causes of CO2/CH4competitive adsorption are their various gas-soil interaction mechanisms under different environmental conditions.The higher adsorption of CO2over CH4on coal has been attributed to the reasons such as: (1) gas-coal interactions and (2) the thermodynamic properties of the gases (Milewska-Duda et al., 2000;Cui et al.,2004;Harpalani et al.,2006;Sakurovs et al.,2010;Zhang et al.,2015;Jin et al.,2017).The smaller molecular diameter of CO2(0.33 nm)versus CH4(0.38 nm)also favors the entry of the former into the micropores in the coal structure. CO2uptake in coal is a combination of adsorption and absorption; hence, the amount of CO2adsorbed is higher than that of CH4(Milewska-Duda et al.,2000). The results of quantum chemistry and molecular simulations indicate that the Van der Waals’forces between CO2and coal are stronger than those between CH4and coal (Harpalani et al.,2006; Sakurovs et al., 2010). Molecular simulation is a powerful tool to investigate gas adsorption behavior on coal, especially to properly explain the controlling effect of pore size and functional groups on the competitive adsorption of multi-component gases(Mosher et al.,2013;Dong et al.,2019).Molecular simulation results exhibit the effects of different influencing factors on CO2/CH4competitive adsorption and provide strong evidence for CO2’s preferential adsorption on coal over CH4based on the molecular dynamics theory (Asif et al., 2019; Zhou et al., 2019; Long et al.,2021). The test and modeling results from the CO2-ECBM pilot in the Qinshui Basin indicate that CO2injection can significantly improve CBM recovery, but can also lead to problems such as unstable gas production and a lower-than-expected amount of stored CO2(Ye et al., 2012, 2016; Zhou et al., 2013b). Generally, CO2and CH4are both in a supercritical state in deep coal reservoirs (>1000 m)but however show significant differences in their free gas density due to changes in temperature and pressure.These results indicate that a variety of supercritical gas adsorption behaviors are induced on coal owing to the dramatic density changes in supercritical gases(Do and Do,2003;Sakurovs et al.,2007;Gensterblum et al.,2013;Song et al.,2015;Han et al.,2019).However,few,if any,studies have focused on the precise relationship between the density of supercritical gas and its adsorption onto coals.Hence,it is unclear whether gas density contributes to the preferential adsorption of supercritical CO2on coal over CH4under the same reservoir conditions.To investigate this,it is necessary to conduct a comparative study on the different adsorption capacities of the two gases under the same reservoir conditions from the perspective of their different supercritical density attributes.
Against this backdrop, the present study utilized mercury intrusion porosimetry (MIP) and low-pressure CO2adsorption(LPCA) techniques to investigate pore size distributions and pore structure parameters of SH-3 anthracite in the Qinshui Basin.Highpressure CO2/CH4isothermal adsorption experiments were carried out at different temperatures. The differences in the adsorption isotherms of the two gases were evaluated from the perspective of the differences in the gas density and a parameter,which is defined as a density ratio between the free and adsorbed phases (DRFA),was proposed to compare adsorption behavior between supercritical CO2and CH4. The modified Dubinin-Radushkevich (MDR)adsorption model was then applied to interpret the CO2/CH4adsorption behavior in coal. Finally, considering ideal geological CO2storage conditions,a potential depth range was recommended for CO2-ECBM in the Qinshui Basin.
2. Samples and methods
2.1. Sample
The SH-3 anthracite investigated in this work was collected from the No.3 coal seam of the Shanxi Formation in the Sihe coalfield in the Qinshui Basin.The SH-3 anthracite was received in particle sizes ranging from fine powders to large particles of 50 mm in diameter from the same working face. Representative samples were obtained by coning and quartering, and crushing and screening methods were employed to obtain the required size ranges for the experiments.The samples were initially flushed with nitrogen gas and stored in a thick, vacuum-sealed polyethylene container that was placed in a desiccator. Vitrinite reflectance,proximateand maceral analyses were conducted according to the Chinese national standards GB/T 6948-2008,GB/T 8899-2013,and GB/T212-2008,and the results are summarized in Table 1.The coal size and quality required by the different experiments in this study are shown in Table 2.
2.2. Determination of pore structure parameters
MIP measurements were conducted on anthracite with a particle size of 1-3 mm using an AutoPore IV 9510 instrument(Micromeritics, USA), with both degassing and intrusion being automatically controlled by the supplied software.During the MIP measurement, which was conducted according to the Chinese national standard GB/T 21650.1-2008,the samples were pressurized from 0.0099 to 413.46 MPa and the mercury contact angle and surface tension during intrusion were assumed to be 130°and 0.485 N·m-1(Okolo et al., 2015), respectively. The CO2surfaceareas and porosity properties of the samples were determined using an Autosorb-IQ-MP surface area and porosity analyzer(Quantachrome, USA). The samples (~20 g) were degassed under vacuum at 90°C for 48 h prior to the adsorption analysis(0°C in an ice bath). Adsorption data were acquired in the relative pressure range of 0 < P/P0< 0.032. LPCA was conducted according to the Chinese national standard GB/T 21650.3-2011.

Table 1 Results of proximate analyses and maceral analyses.

Table 2 Sample sizes and quality for the different experiments.
2.3. High-pressure CO2/CH4 isothermal adsorption experiments
To compare the differences of adsorption between CH4and CO2at a given temperature,high-pressure gas adsorption experiments were conducted using the manometric method.Prior to the drying process, the coal samples (as received) were crushed to particle sizes ranging from 60 to 80 mesh (0.18 to 0.25 mm) and then preserved in a vacuum bag. The adsorption experiments were carried out using 100 g coal samples that were dried at 105°C in a vacuum drying oven for 1.5 h before being rapidly weighed and transferred to the adsorption cell.Prior to the adsorption isotherm measurements, the void volumes of the adsorption cell with and without the coal sample were determined using helium(99.999%)due to its non-adsorptive nature. The experimental temperatures were 40°C, 50°C, 60°C, 70°C, and 80°C, and the maximum equilibrium pressures were 12 MPa for CH4and 16 MPa for CO2.The maximum equilibrium pressure for CO2was higher since the large changes in the CO2adsorption curves at high pressures required the measurement of more data points to improve the fitting accuracy.The high-pressure adsorption isotherm experiments were carried out according to the Chinese national standard GB/T 19560-2008.
The adsorption amounts obtained from the manometric method are excess adsorption amounts. For low-pressure gas adsorption,the difference between the excess adsorption amount and the absolute adsorption amount is negligible, but for high-pressure gas adsorption, especially for high-pressure CO2adsorption, their difference is significant. Therefore, the analysis of supercritical CO2adsorption should be based on absolute adsorption. Excess adsorption is defined as the net amount of gas adsorbed on a sorbent without gas of free density,and the absolute adsorption can be calculated from the following equation:
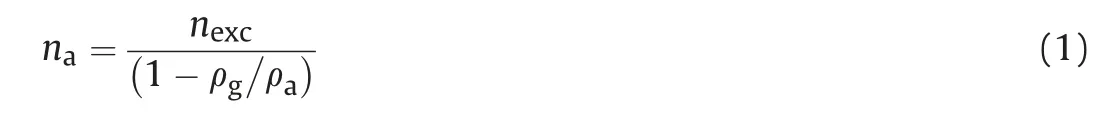
where nais the absolute adsorption amount, (mmol/g), nexcis the excess adsorption amount, (mmol/g), ρgis the free gas density(cm3/g),ρais the adsorbed gas density(1.0 g/cm3for CO2and 0.42 g/cm3for CH4(Day et al., 2008; Tang et al., 2017)).
2.4. MDR adsorption model
Previous studies have shown that gas adsorption on coals mainly occurs in micropores(Moore,2012;Feng et al.,2017;Wang et al.,2017).The widely-used micropore filling methods,such as the Dubinin-Astakhov(D-A)and Dubinin-Radushkevich(D-R)models,tend to adopt saturated vapor pressure; however, this pressure loses its physical significance for supercritical gas. Therefore,instead of equilibrium pressure and saturated vapor pressure,Sakurovs et al. (2007) employed the free- and adsorbed-phase densities, respectively. In addition, an empirical parameter, k, was introduced to establish a modified D-R (or MDR) adsorption equation based on the D-R model:

where n0is the adsorption capacity,D is a function of both the heat of adsorption and the affinity of the gas for coal, and k is the correction coefficient related to adsorption swelling.
2.5. Calculation of the average number of layers of adsorbed molecules (ANLAM)
In addition to adsorption capacity, the number of layers of adsorbed molecules is also a measure of a gas’s adsorption behavior.For the assessment of adsorbed gas molecules,Zhou et al.(2003) proposed an equation to calculate the ANLAM as follows:

where Vais the maximum volume of the adsorbed phase (calculated from the maximum absolute adsorption capacity), A is the specific surface area(SSA)of the adsorbent,ρais the density of the adsorbed phase, Av is Avogadro’s number (6.022 × 10²³), and λ is the average number of adsorbate layers.
3. Results
3.1. Pore structure parameters

Fig.1. Pore size distribution of the SH-3 anthracite determined by the MIP and LPCA methods. (a) Pore volume; (b) Specific surface area.
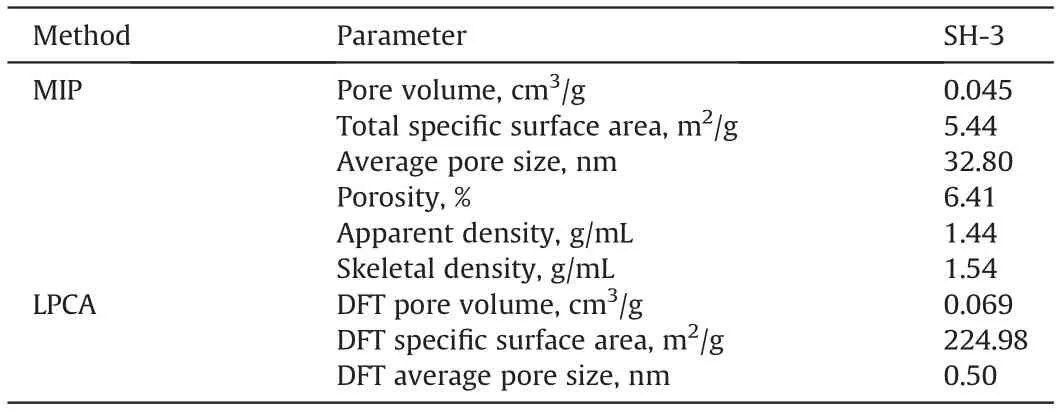
Table 3 Results of pore structure parameters determined by different measuring methods.
The results of the pore structure parameters of the SH-3 anthracite determined using the MIP and LPCA methods are summarized in Fig.1 and Table 3.The pore size distribution of the SH-3 anthracite determined by the different methods has good continuity and the distributions of pore volume and pore surface area are similar.The pore volume and surface area decrease as pore size increases and their maximums occur between 0.5 and 0.6 nm.However,there is a weak peak near 0.1 μm in Fig.1a,indicating the development of micro-fractures. The MIP results show that the pore sizes were>3 nm,i.e.,meso-macropores,with a pore volume of 0.045 cm3/g, an SSA of 5.44 m2/g, and an average pore size of 32.8 nm.The pore size range determined via LPCA was 0.3-1.8 nm,i.e. micropores, with a pore volume of 0.069 cm3/g, an SSA of 224.98 m2/g, and an average pore size of 0.5 nm. These results indicate that the SH-3 anthracite has a stronger development of micropores since the pore size ranges determined by MIP and LPCA were completely different,with no overlap whatsoever.In addition,the SSA value obtained from LPCA was>40 times greater than that from MIP; therefore, it is evident that the available SSA for gas adsorption is mostly provided by the microporosity of the coal.
3.2. High-pressure CH4/CO2 adsorption isotherms
The experimental results of the high-pressure adsorption of CH4and CO2are shown in Fig.2,in which the CH4adsorption isotherms show obvious Langmuir-like behavior, with the adsorption amounts negatively correlated with temperature.However,the CO2adsorption isotherms all showed maximum excess adsorption amounts in the range of 6-10 MPa.In addition,these maxima were shifted to the right at higher temperatures. The adsorption isotherms at different temperatures all intersected, and the intersection points also tended to shift rightwards with increasing temperature. The excess adsorption amounts of CO2were negatively correlated with temperature at low pressures but showed an opposite trend at high pressures. At the experimental pressure range,the maximum excess adsorption amounts of CH4at elevated temperatures were 1.08,1.05, 0.97, 0.85, and 0.72 mmol/g, respectively,while those of CO2at the corresponding temperatures were nearly twice as large, which were 2.12, 1.94, 1.79, 1.66, and 1.59 mmol/g, respectively.
3.3. Fitting of the MDR adsorption model
The results of fitting the MDR adsorption model to the highpressure adsorption data of the CO2and CH4are shown in Table 4. As the table shows, all the R2values for all the fits were>99%, indicating that the model can accurately characterize the adsorption behavior for both the supercritical gases on coals. The adsorption capacities of supercritical CH4on coal ranged from 1.17 to 1.65 mmol/g, which is significantly lower than those of supercritical CO2at the same temperature(2.49-3.06 mmol/g).Although the adsorption capacities of both gases decreased with increasing temperature, as expected, the CO2/CH4adsorption ratio ranged from 1.85 to 2.2, with no significant temperature dependence observed. The values of D (from Eq. (1)) for the supercritical adsorption data were also not obviously correlated with the temperature,with those for CO2being lower at all temperatures except at 70°C. This anomaly may be related to the slight changes in the temperature of the adsorption cell during the experiments. The k values for the supercritical CH4were positive and uncorrelated with temperature, while those for the supercritical CO2were negative and decreased with increasing temperature. This may be interpreted as being due to a higher swelling induced by CO2adsorption, which caused a larger reduction in the adsorption amount.
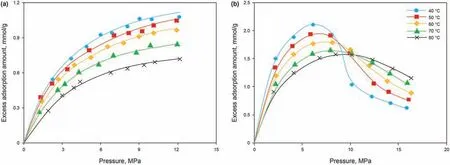
Fig. 2. Isothermal adsorption curves at different temperatures (the fitted lines are calculated by the MDR adsorption model). (a) CH4; (b) CO2.
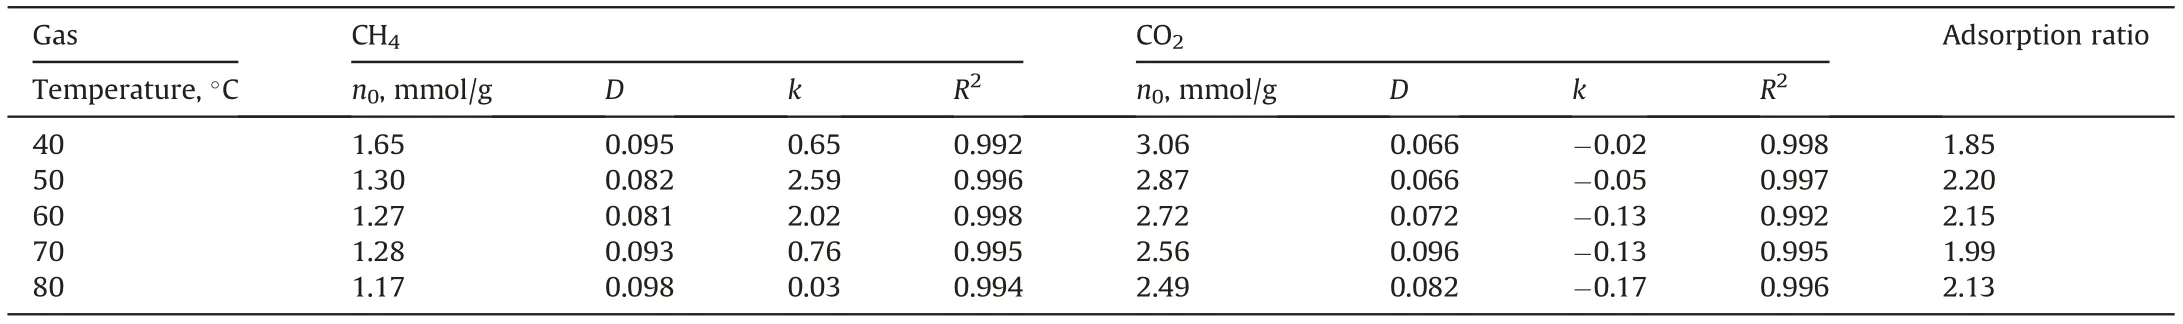
Table 4 The fitted results of the high-pressure CH4/CO2 adsorption on the SH-3 anthracite.
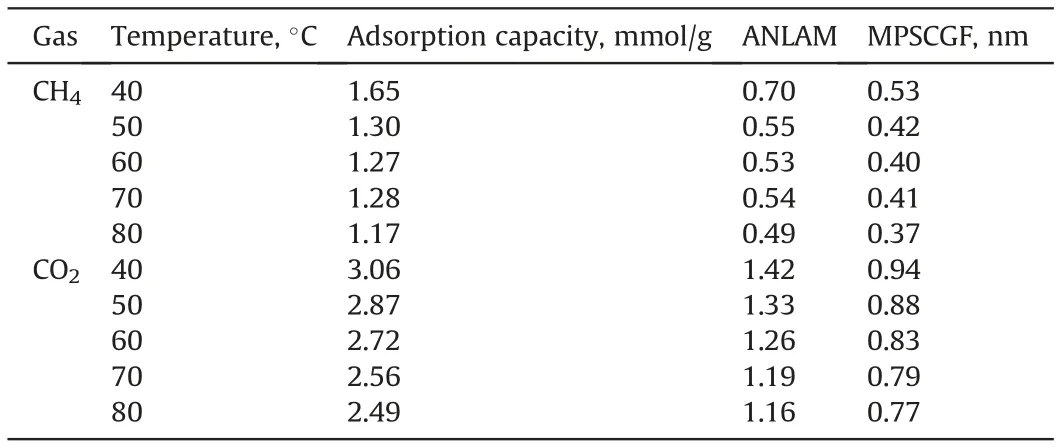
Table 5 ANLAMs of CH4/CO2 and their MPSCGFs in the SH-3 anthracite at different temperatures.
3.4. Calculation of the ANLAM
The pore sizes of SH-3 anthracite from MIP and LPCA were completely different, with the former technique being used mainly to investigate macro- and meso-pores, while the latter mainly representingmicropores. The results showed that the SSA of the micropores was significantly 40 times larger than that of the macro-mesopores, making the latter negligible in terms of gas adsorption, which is consistent with the adsorption potential theory due to the narrower pore sizes of micropores. The adsorption potential on the micropore surface is larger than that on the macroporous surface due to the superposition of the adsorption potential on the relative pore wall, which causes the adsorbate molecules to preferentially occupy the micropore adsorption sites; therefore, the assumption that the SSA of micropores can be considered as the total SSA was applied when calculating the ANLAM using Eq. (2). The results of the ANLAM and the maximum pore sizes for complete gas filling (MPSCGF)are listed in Table 5.
Table 5 shows that the ANLAM values for CO2and CH4were significantly different, and both were negatively correlated with temperature.The ANLAM of CH4ranged from 0.49 to 0.7,indicating that the adsorption state of CH4on coal consists of unsaturated monolayer surface coverage, which is typical of monolayer adsorption; however, that of CO2ranged from 1.16 to 1.42, indicating full surface coverage for the first layer, and unsaturated surface coverage for the second or third layer (i.e., multi-layer adsorption). The MPSCGF ranges of CO2and CH4were 0.77-0.94 nm and 0.37-0.53 nm,respectively,suggesting that the pore sizes that can be completely filled by CO2are about twice as large as those for CH4, which helps to explain the significantly higher adsorption capacity of CO2over CH4on coal.
4. Discussion
4.1. Comparison of supercritical CO2/CH4 adsorption on coal
The fitted results from the MDR adsorption model show that,within the experimental conditions used,the supercritical CO2absolute adsorption amounts on the SH-3 anthracite are higher than those of the supercritical CH4(Fig.3a).The adsorption curve shapes of CO2and CH4are also significantly different. The absolute adsorption curvesof CH4are close tolinear,and the increasing rateof the adsorption amount at low pressure is slightly higher than that at high pressure.In contrast,the slopes of the CO2adsorption curves before and after the critical pressure are quite different.Below the critical pressure of CO2, the adsorption amounts show a rapid increase,while at high pressures,the increasing rate of the adsorption amount significantly reduces and the curve shapes of CO2are similar to those of CH4. In addition, the ratio of the absolute adsorption amounts (CO2/CH4) can be divided into two distinct stages: at pressures<2 MPa,the initial absolute adsorbed amounts of the two gases varied greatly, but these differences decreased sharply with increasing pressure.Atpressures>2 MPa,this ratio decreased slowly with increasing pressure, gradually approaching 2 (Fig. 3b). These results suggest a decreasing effect of pressure on the CO2/CH4absolute adsorption ratio,which is consistent with the results of previous molecular simulation studies(Zhang et al.,2015).The ultimate ratio of 2 indicates that twice the number of CO2molecules can be held at a given adsorption site compared with CH4.At low pressures,the ratio was >2, which increased significantly as the pressure decreased due to the fact that CO2micropore filling occurs at low pressures,while CH4molecules interact weakly with coal and only form a monolayer on the surface. However, as the pore size increases, the adsorption potential cannot continue to be superimposed on the relative pore wall,which results in no adsorption in the pore centers; hence, volume filling is not sustainable at high pressure.This leads to surface-only adsorption of CO2molecules in unfilled pores at high pressure, thereby significantly reducing the growth of CO2adsorption amount.In addition,most of the available adsorption sites in coal are occupied by CO2molecules at low pressure.Therefore,under the combined action of these two phenomena,the ratio of the absolute adsorbed amount gradually decreases with increasing pressure until the surface is saturated.
4.2. Supercritical CO2 and CH4 density attributes
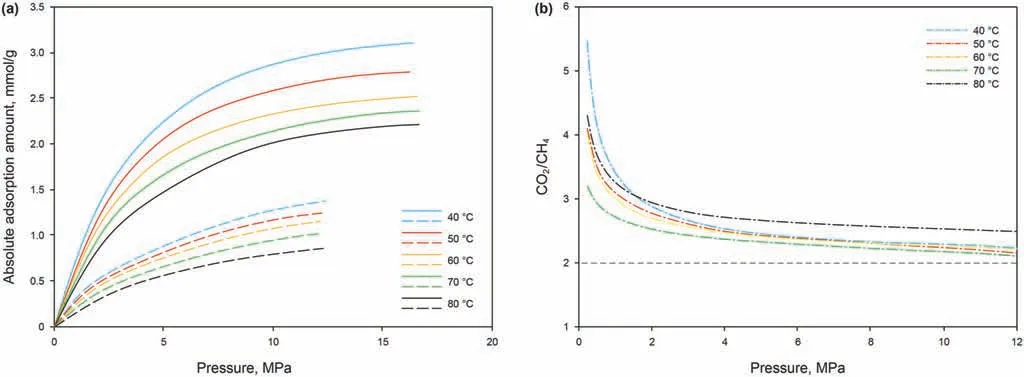
Fig. 3. (a) Fitted results of the CH4/CO2 absolute adsorption amount on the SH-3 anthracite at different temperatures (dotted line: CH4; solid line: CO2); (b) Ratio of the absolute adsorption amount between CO2 and CH4.
The NIST REFPROP software package was used to calculate the free-phase densities of CO2and CH4as functions of temperature and pressure and these results are shown in Fig. 4a. As the figure shows, the CH4density is relatively small, and increases nearly linearly with pressure, while not showing a visible temperature dependence.The CO2density is controlled by both temperature and pressure, especially near its critical point. The lower the temperature,the more obvious the variation of the density of CO2near the critical point. For example, at 40°C, the CO2density increased almost vertically near 8 MPa. However, as the temperature increased,not only did the CO2density at a given pressure decrease,but the increase in density also became stagnant, suggesting that the variation of CO2density was inhibited by the high temperature.To better understand this attribute of supercritical CO2, curves of the CO2density at 150°C and 200°C were also calculated. The results show that at these temperatures,the CO2density showed a linear increase similar to that of CH4, and the density curves were also closer to CH4. Therefore, it is speculated that when the temperature is high enough, the changes in CO2density are similar to those of CH4. This phenomenon can be interpreted by considering the high critical temperature of CO2.The experimental temperature is close to the critical temperature of CO2,but it is much higher than the critical temperature of CH4; hence, under the experimental conditions, the gases exhibit different fluid densities and different changes in density,which result in their free-phase densities being quite different in real reservoir environments. For a better comparison,the CO2and CH4density curves were calculated at depths ranging from 0 to 2000 m, as found in the Qinshui Basin (Fig. 4b).The results show that the CH4density curve is similar to that in Fig. 4a, but the CO2density curve only resembles that at low temperature(for example,40°C),which suggests that the change in CO2density plays a significant role in its adsorption behavior in actual reservoir environments.The free-phase density ratio between CO2and CH4shows a maximum value with the depth of ~950 m.After the depth is greater than 950 m,the increase in CO2density slows down considerably, implying that the effect of supercritical CO2density on adsorption is reduced at greater depths.
According to the adsorption potential theory, the gas adsorbed on the pore surfaces of coal is in a highly condensed state due to the interactions between the gas and coal.The adsorbed phase density is high on the coal’s surface,but decreases with increasing distance from the pore surface, due to the weakening of the adsorption potential, until it is equal to the free-phase density in the pore centers. Based on this, the closer the free- and adsorbed-phase densities, the greater the gas density at the boundary between the adsorbed and free phases, resulting in an increase in the adsorbed amount.Therefore,once a certain temperature is fixed,an increase in the free-phase density directly induces an increase in the number of gas molecules in the adsorption space.This process is explained intuitively in Fig.5.Hence,the relative sizes of the freeand adsorbed-phase densities can reflect the increase or decrease in the adsorbed amount caused by changes in the gas density.Accordingly, a critical parameter for assessing the amount of gas adsorbed on coals, DRFA, is proposed here.

Fig. 4. (a) Density changes of CO2/CH4 with the increase in pressure at different temperatures; (b) the density of CO2 and CH4 under coal reservoir environments in the Qinshui Basin.
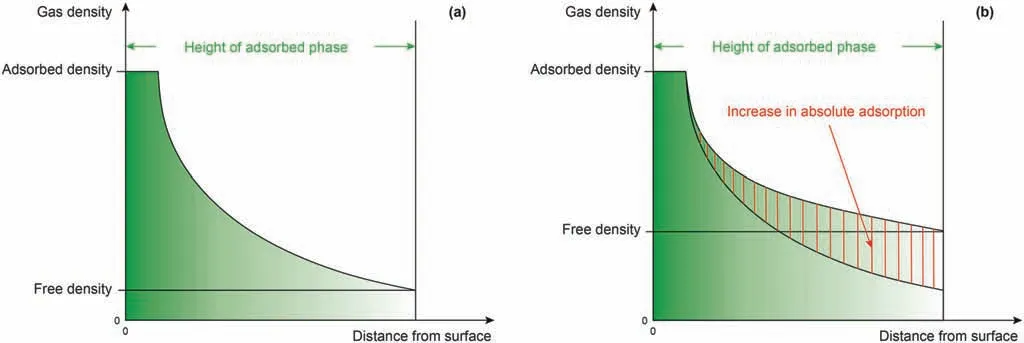
Fig. 5. Effect of free phase density on adsorption capacity. (a) Low free phase density; (b) After an increase in density.
The DRFA values for CO2and CH4as a function of pressure and temperature are shown in Figs. 6a and b. As the figure shows, the DRFA of CO2has a clearer temperature dependence.The lower the temperature, the faster the DRFA of CO2increases near the critical pressure. The DRFA of CH4showed a linear increase, which was significantly smaller than that of CO2, and was not significantly affected by temperature (Fig. 6b). In general, the DRFA of CO2/CH4showed a peak value that decreased with increasing temperature.When the temperature was 80°C, the DRFA increased monotonically with pressure (Fig. 6c). Under the experimental conditions, the DRFA of CO2was greater than that of CH4and the maximum ratio of the DRFA between CO2and CH4approached 3.78 at the temperature of 40°C. In the range of 15-20 MPa, the DRFA of CO2was over twice that of CH4.Compared to the difference in the free-phase density between the two gases in Fig.3,the DRFA of CH4is closer to that of CO2as a whole. For example, at 20 MPa,the DRFA of CH4was~0.3,while the actual CH4free-phase density was<0.15 g/cm3.This is because the CH4adsorbed phase density is less than that of CO2. Moreover, the DRFA not only intuitively reveals the gas density differences between CO2and CH4at different temperatures and pressures but also reflects the relative sizes of the free- and adsorbed-phase densities. The large differences in DRFA at different temperatures are due to the supercritical CO2/CH4attributes. Previous studies have shown that supercritical CO2exhibits an obvious two-phase attribute including a gas-like phase and a liquid-like phase but that as the temperature increases, this two-phase attribute fades away (Simeoni et al., 2010; Artemenko et al., 2017). In fact, the critical temperature of CH4is low, and it shows no such two-phase attribute under the experimental conditions; therefore, the DRFA ratio between the two gases basically reflects the drastic change of the supercritical CO2density near the critical conditions.In addition,it may be inferred from the trend in DRFA that at the experimental temperature, the ratio approaches 2 at infinite pressure. This value is consistent with the corresponding ratio of the absolute adsorption capacity,suggesting that the DRFA is a key factor in determining the adsorption capacity of coal towards different gases.
4.3. Gas density-induced differences in adsorption capacity
To better understand the gas density effect on adsorption, the changes in the absolute adsorbed amounts of CO2and CH4with DRFA at different pressures were further calculated (Fig. 7). The results show that the absolute adsorption capacities of both gases show a strongly positive linear correlation with the DRFA, confirming the inference from section 4.2 that the DRFA values of gases determine their adsorption capacities. In addition, Fig. 7 also reveals that within the ranges of the experimental temperature and pressure, the DRFA of CH4was always lower than that of CO2, and there was a significant difference in the growth rate (slope) of the absolute adsorbed amount between the two gases. The absolute adsorbed amount of subcritical CO2increased rapidly with the DRFA, and its growth rate decreased significantly as the CO2entered the supercritical state. Although the growth rate of the absolute adsorbed amount of CH4also decreased with increasing pressure,this decrease was significantly smaller than that for CO2.This is because the change in the DRFA of CH4was smaller than that of CO2under the experimental temperature and pressure, especially owing to the significant difference in the CO2density around the critical point. These results not only illustrate the high adsorption capacity of CO2resulting from its high DRFA, but also reflect the weakening of the contribution of supercritical CO2to the increase in the absolute adsorption capacity at high pressures;therefore,the difference in the DRFA values between CO2and CH4directly indicates their different adsorption capacities on coals.
The ANLAM intuitively indicates that the difference in the adsorbed amount of the different gases is closely related to the DRFA.This is because the higher the DRFA,the closer the free-and adsorption-phase densities and the shorter the distance between gas molecules in the free phase, which allows more free-phase molecules to enter the adsorption space, thereby increasing the number of adsorbed molecular layers. As the adsorption potential range on the pore surface of a given coal is fixed,it is the number of adsorbate molecules in the adsorption space that determines the adsorption capacity.Due to the low critical temperature of CH4,the DRFA of supercritical CH4is small and does not change appreciably under reservoir conditions. At reservoir pressures, the intermolecular distance of the free-phase CH4is not sufficient for it to enter the adsorption potential range. This limits the increase in the ANLAM, resulting in the adsorbed CH4maintaining a monolayer state. After a short but rapid increase in the adsorption amount of CH4at low density resulting from the strong adsorption potential in the micropore, monolayer surface coverage dominates the contribution on the increase of the CH4adsorption amount (Fig. 8a). In contrast, since the critical temperature of CO2is close to the coal reservoir’s temperature, the free-phase CO2density changes drastically with pressure, resulting in a large change in DRFA and ANLAM. In addition, since CO2has a higher DRFA, its free-phase intermolecular distances are closer to those in the adsorption phase, facilitating capture by the pore surface and increasing the possibility of multi-molecular layer adsorption (Fig. 8b). The formation of multilayer adsorption inevitably leads to an increase in the upper limit of pore sizes that can be completely filled with gas and then the larger micropore is completely filled. Therefore,compared to CH4, the contribution of micropore filling on the increase of the CO2adsorption amount is more durable at high gas densities. The calculated results also show that the pore sizes that can be completely filled by CH4range from 0.37 to 0.53 nm,which is similar to the average pore size (0.5 nm) of the SH-3 anthracite,whereas the corresponding pore size range for CO2of 0.77-0.94 nm is significantly larger than the preponderant micropore size distribution of the SH-3 anthracite (0.3-0.65 nm).Accordingly, it can be concluded that due to their different adsorption behaviors, supercritical CO2exhibits a combination of micropore filling and multilayer surface coverage,and a high DRFA contributes to the appearance of the multilayer adsorption at high pressures. Furthermore, CH4always shows monolayer adsorption with minor volume filling in the small micropores.As a result, the adsorption capacity of CO2is greater than that of CH4under the same reservoir conditions.
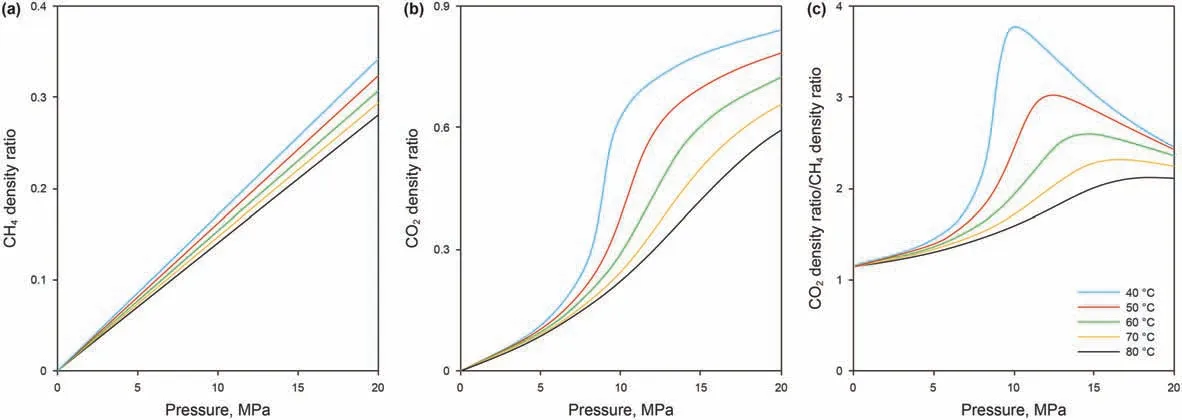
Fig.6. The CO2/CH4 density ratio between the free phase density and the adsorbed phase density with the increase in pressure at different temperatures.(a)DRFA of CO2;(b)DRFA of CH4; (c) The ratio of DRFA between CO2 and CH4.
4.4. Implications for CO2-ECBM
In coal reservoirs, the gradual increase in temperature and pressure with depth results in significant changes in the CO2density during CO2injection into deep unmineable coal seams. In this study, the Qinshui Basin was taken as an example to calculate the absolute adsorbed amount of CO2and CH4at different depths using the MDR adsorption model. The depths were calculated from the matching relation between the experimental temperatures and temperature gradient in the Qinshui Basin (the depth of the constant-temperature zone, at 15°C, is 20 m), and the reservoir pressure gradient was assumed as 1 MPa/100 m. The results show that the maximum values of the absolute adsorbed amounts of CO2and CH4were 2.68 and 1.23 mmol/g,respectively,at depths of 1012 and 1295 m,respectively(Fig.9a).These results,which are similar to those obtained in previous studies(Hildenbrand et al.,2006;Han et al., 2017), show that the occurrence of the maximum absolute adsorption amount is a result of the joint effects of DRFA and temperature. The adsorption capacities of CO2and CH4are negatively correlated with temperature(Fig. 9b); hence, the higher the temperature, the faster the adsorption capacity declines. On the one hand, the change rate of the DRFA value for CO2decreases gradually at greater depths(Fig.9c),indicating that the DRFA has a smaller influence on the adsorbed amount of CO2in deeper reservoirs.On the other hand,the DRFA of CH4was positively correlated with depth, suggesting a more-or-less constant influence of the DRFA on the increase in the adsorption capacity.Accordingly,it may be concluded that as the depth increases,the effect of the DRFA of CO2is reduced,and the peak CO2adsorption is reached first,while due to the stable effect of the DRFA of CH4,the maximum adsorbed amount of CH4lags behind that of CO2under the same reservoir conditions. These results demonstrate that the appropriate depth for implementing geological CO2storage and enhanced CBM recovery should be separately considered as follows: (1) for geological CO2storage in the Qinshui Basin, the recommended depth is about 1000 m; (2) for CO2-ECBM in the Qinshui Basin, CO2/CH4competitive adsorption and the recoverable CBM reserves require extra consideration.Therefore the potential depth for CO2-ECBM is expected to be greater than that for CO2storage alone.

Fig. 7. Relationship between the absolute adsorption of CH4/CO2 and their density ratio at various pressures.
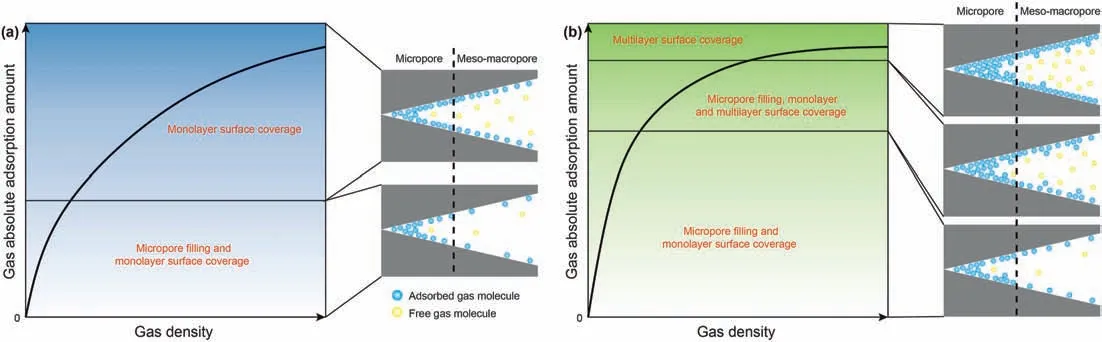
Fig.8. Gas adsorption models on coal as gas density increases and the contribution of different gas adsorption behaviors on the increasing of the gas adsorption amount.(a)CH4;(b) CO2.
Although in current CO2-ECBM demonstrations,methane in coal cannot be completely replaced by injected CO2, experimental and simulated results of CH4displacement by CO2in coals show that with the improvement of CO2injection technology, process, and efficiency, CH4displacement efficiency can reach 100%(Ranathunga et al.,2017;Fang et al.,2019).Therefore,the ideal CO2/CH4competitive adsorption ratio (whereby CH4in coal seams is completely replaced by CO2) can be used to theoretically evaluate the optimal depth for CO2-ECBM projects. The ideal competitive adsorption ratio between CO2and CH4in coal seams showed a reverse parabola in the range of 500-2000 m, and its minimum value appeared at ~1500 m (Fig. 10a). A higher competitive adsorption ratio is conducive to the storage of CO2. Under the coal reservoir conditions in the Qinshui Basin, the ideal CO2/CH4competitive adsorption ratios above and below 1500 m both showed an increasing trend, but their increases have different reasons.The high ratio in the shallow part of the reservoir is due to the rapid increase in CO2adsorption capacity,while that in the deep part results from the decrease in the adsorption of CH4.Taking the changes in CO2density and adsorption capacity with depth into consideration, it may be concluded that the shallow coal seams have both a high adsorption replacement ratio and a high CO2adsorption capacity. During CO2-ECBM processes, permeability is the controlling factor for CO2injectability, and it decreases exponentially with increasing depth (Fig.10b). Bachu et al. (2007)proposed that the permeability of coal for favorable CO2injection should be>1 mD.A very low coal permeability is not conducive to CO2entering the pores from the cleat,resulting in injection failure or slow progress.Liu et al.(2020)also observed that after CO2-coal interactions at the temperature and pressure conditions below 1500 m, the pore volume and surface area of coals showed a significant reduction, which plays a negative role in CO2geological storage. Therefore, from the perspective of enhancing the geological storage capacity of CO2, CO2injectivity, and the CO2/CH4replacement rate, CO2injection into coal seams at depths of 1000-1500 m appears to be more advantageous.
The CO2adsorption-induced swelling of coal plays a significant role in reducing its permeability, causing it to decrease by two orders of magnitude(Cui et al.,2007).A previous study indicated that the permeability of Qinshui Basin anthracite decreases by ~70%after supercritical CO2adsorption at 10 MPa and that the contribution of supercritical CO2adsorption to the permeability attenuation of coal is >30% (Niu et al., 2018); however, several studies have indicated that in the long term following CO2injection, the permeability of coal can recover or even increase as compared with its original value(Fujioka et al.,2010;Wei et al.,2010;Vishal et al.,2013).Hence,the original permeability of the coal and the variation in the relative permeability caused by injecting CO2are key factors in economically and efficiently implementing CO2-ECBM projects.
At present, China has put forward the goal of reaching peak carbon emissions by 2030 and attaining carbon neutrality by 2060.Hence, the development and utilization of non-fossil energy sources and the reduction of CO2emissions have gradually become priority development paths in the fields of energy and resources,which inevitably requires the goal of CO2-ECBM projects to shift focus from CBM development to the safe and efficient geological storage of CO2. To this end, future research on CO2-ECBM projects should prioritize finding the optimum depth and the structural or/and stratigraphic traps for geological CO2storage in different types of coal-bearing basins.
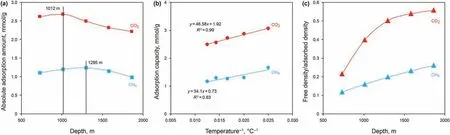
Fig.9. (a)Changes of CO2/CH4 adsorption amount on SH-3 anthracite under the reservoir condition in the Qinshui Basin;(b)Relationship between the adsorption capacity of CO2/CH4 and temperature; (c) Changes in the CO2/CH4 density ratio under the reservoir condition in the Qinshui Basin.

Fig.10. (a)CO2/CH4 adsorption ration vs.depth under reservoir conditions of the Qinshui Basin;(b)Permeability vs.depth in the Qinshui Basin(Meng et al.,2011;Song et al.,2013;Sun et al., 2014).
5. Conclusions
(1) The adsorption capacities of CH4on the SH-3 anthracite in this study ranged from 1.17 to 1.65 mmol/g and the ANLAMs ranged from 0.53 to 0.70, while for CO2, the corresponding numbers were 2.49-3.06 mmol/g and 1.16-1.42, respectively. The ratio of the absolute adsorbed amount between CO2and CH4decreases with increasing pressure, and the adsorption capacity of CO2is about twice that of CH4.
(2) CO2has a high critical temperature that is comparable to the experimental temperature; therefore, it presents a high density and shows rapid changes in its density near the critical point. CH4has a low density that shows a positive linear relationship with pressure. To better compare the absolute adsorption amount, a critical parameter (DRFA) is proposed according to the supercritical CO2/CH4attributes.The DRFA shares a high affinity with the ANLAM and determines the gas adsorption behavior in pores of different sizes.
(3) The higher DRFA of supercritical CO2is an important factor contributing to its greater adsorption capacity over CH4.The DRFA values of CO2and CH4both show a positive relationship with the absolute adsorbed amounts. The high DRFA of CO2facilitates the entry of free CO2molecules in the adsorption space and the adsorbed CO2molecules fill the micropores as multilayer surface coverage, whereas CH4shows monolayer adsorption.
(4) As depth increased, the adsorbed amounts of CO2and CH4showed the maxima at depths of 1012 and 1295 m, respectively,in the Qinshui Basin.Considering CO2storage capacity,CO2/CH4adsorption ratio, and permeability changes, the recommended depth range for CO2-ECBM projects in the Qinshui Basin is 1000-1500 m. Future CO2-ECBM projects should emphasize the geological storage of CO2in deep,unmineable coal seams under the pressure of carbon reduction, and the economic conditions, like the CO2injection speed,increment of CH4production,sources of CO2and carbon credit, etc., should also be considered.
Acknowledgements
We are very grateful to three anonymous reviewers for their constructive comments and helpful suggestions that significantly improved the original manuscript. The authors would like to acknowledge the financial support provided by National Natural Science Foundation of China(Nos.42102207 and 42141012),Major Project supported by Jiangsu Key Laboratory of Coal-based Greenhouse Gas Control and Utilization, CUMT (2020ZDZZ01C), the Fundamental Research Funds for the Central Universities(2021YCPY0106) and A Project Funded by the Priority Academic Program Development of Jiangsu Higher Education Institution(PAPD).
杂志排行
Petroleum Science的其它文章
- Primary logistics planning of oil products under the imbalance of supply and demand
- Advances in enhanced oil recovery technologies for low permeability reservoirs
- A novel method of quantitative evaluation and comprehensive classification of low permeability-tight oil reservoirs: A case study of Jidong Oilfield, China
- Measurement of pore diffusion factor of porous solid materials
- Catalytic oxidation of pentanethiol on basic nitrogen doped carbon hollow spheres derived from waste tires
- Temperature effect on the dynamic adsorption of anionic surfactants and alkalis to silica surfaces