A novel method of quantitative evaluation and comprehensive classification of low permeability-tight oil reservoirs: A case study of Jidong Oilfield, China
2022-09-23DongLiangJiangHaoChnJianPngXingLinShangQunHuiWangYanChunSunYaoZhaoJianCuiIanDuncan
Dong-Liang Jiang , Hao Chn ,*, Jian-Png Xing , Lin Shang , Qun-Hui Wang ,Yan-Chun Sun , Yao Zhao , Jian Cui , Ian Duncan
a State Key Laboratory of Petroleum Resources and Prospecting, China University of Petroleum (Beijing), Beijing,102249, China
b Key Lab of Petroleum Eng. of MOE, China University of Petroleum (Beijing), Beijing,102249, China
c Postdoctoral Station of PetroChina Jidong Oilfield Company, Tangshan, Hebei 063000, China
d Postdoctoral Program of PetroChina Research Institute of Petroleum Exploration and Development, Beijing,100083, China
e Exploration and Development Research Institute, PetroChina Jidong Oilfield Company, Tangshan, Hebei, 063000, China
f Bureau of Economic Geology, The University of Texas at Austin, 78705, United States
Keywords:Low permeability-tight reservoir Classification boundary Correlation analysis Probability distribution Clustering algorithm
ABSTRACT The classification of low permeability-tight reservoirs is the premise of development.The deep reservoir of Shahejie 3 member contains rich low permeability-tight reserves, but the strong heterogeneity and complex micro pore structure make the main controlling factors subjective and the classification boundaries unclear.Therefore,a new indicator considering the interaction between fluid and rock named Threshold Flow Zone Indicator (TFZI) is proposed, it can be used as the main sequence of correlation analysis to screen the main controlling factors,and the clustering algorithm is optimized combined with probability distribution to determine the classification boundaries. The sorting coefficient, main throat radius, movable fluid saturation and displacement pressure are screened as the representative parameters for the following four key aspects: rock composition, microstructure, flow capacity and the interaction between rock and fluid. Compared with the traditional probability distribution and clustering algorithm, the boundary of the optimized clustering algorithm proposed in this paper is more accurate.The classification results are consistent with sedimentary facies, oil levels and oil production intensity.This method provides an important basis for the development of low permeability-tight reservoirs.
1. Introduction
Low permeability-tight sandstone oil resources are abundant and widely distributed in China, which are becoming research hotspot due to the huge resources and broad exploration prospects(Jiang et al., 2015; Zou et al., 2015; Zhang et al., 2016). Compared with conventional oil reservoirs,low permeability-tight sandstone generally experiences destructive diagenesis, such as strong compaction and cementation,it is easy to cause smaller pores and complex pore throat connection(Shao et al.,2017;Li et al.,2018;Ma et al.,2018;Zhang et al.,2022;Chen et al.,2020).Reservoir quality is key for low permeability-tight sandstone oil reservoir evaluation,which determines the oil content and production capacity. However,it should be noted that these reservoirs usually have very poor porosity and permeability relationship. For example, reservoirs with similar porosity may have distinct permeability while reservoirs with very high porosity may exhibit an ultra-low permeability.Therefore,the conventional reservoir classification methods are not applicable for the evaluation and classification of low permeability-tight sandstone reservoirs.
Generally, there are two main methods for the reservoir classification.One is qualitative evaluation based on technologies,such as production, logging and seismic results (Li et al., 2011; Feng et al.,2020;Ashraf et al.,2019;Ali et al.,2020;Sohail et al.,2020).However,these methods are mostly macroscopic and qualitative for the reservoir evaluation. And the huge cost is another limit for the practicability of the qualitative evaluation. In addition, more sophisticated classification is needed for low permeability-tight reservoirs which always comprised of fine grained lithologies. The other method is quantitative evaluation based on mathematical methods, such as fuzzy evaluation, grey correlation, hierarchical analysis,and machine learning(Qian et al.,2018;Wang et al.,2019;Gao et al.,2010;Yu et al.,2020;Li et al.,2008).Comparatively,these mathematical methods can realize the quantitative evaluation and classification of low permeability-tight reservoirs. However, the screened classification factors are mostly subjective which lacks strict screening and evaluation. In addition, the classification boundaries are always obscure with obvious overlap. Thus, the screening of the main controlling factors and the determination of classification boundaries are very important for quantitatively classification of low permeability-tight reservoirs.
The factors for reservoir classification are required to be representative.Thus,correlation analysis is often used to screen the main controlling factors, and the screenion of the main sequence is key for correlation analysis (Chen et al., 2022a). Scholars choose different main sequences for correlation analysis, such as oil production, permeability and porosity (Wang et al., 2013; Tu et al.,2012). Although the production capacity can reflect the reservoir property to some extent,it is also greatly affected by the production system. Similarly, considering the high heterogeneity of low permeability-tight reservoirs, it is unreasonable to screen permeability or porosity as the main sequence. Therefore, a comprehensive indicator which can be used as the main sequence to characterize the physical properties of reservoirs is necessary.
Based on the screened factors, reservoirs are evaluated and classified into several types by different methods, such as analytic hierarchy process,machine learning and fuzzy logic(Hu et al.,2019;Shi et al., 2019; Wang et al., 2021; Artun and Kulga, 2020; Dong et al., 2017; Zhou et al., 2021). However, previous studies on the screened initial control input value are mostly subjective, which may lead to unreasonable reservoir classification results. In addition,another problem of previous research is that the boundaries of the classification factors are always unclear due to the limited data.Cluster algorithm is a multivariate statistical analysis method to classify samples, and it is widely used in reservoir classification because of its good applicability to highly heterogeneous reservoirs(Zhao et al.,2018;Szab′o et al.,2019;Oliveira et al.,2020; Mahjour et al., 2020). However, it should be noted that cluster analysis requires high integrality and accuracy of data, which is greatly affected by the amount of data.Thus,it is necessary to optimize the clustering algorithm.
In this paper, a database contains 18 characteristic factors of 452 natural rocks from 10 wells is established. On this basis, a new indicator named “Threshold Flow Zone Indicator” (TFZI) is proposed as the main sequence of correlation analysis, and the main controlling factors are screened by Grey correlation, Pearson correlation, Kendall correlation and Spearman correlation. Then,classification coefficients are calculated by both of multivariate analysis and grey evaluation, and multi-information superposition method is used to obtain a new indicator named“Comprehensive Classification Coefficient” (Z) to further improve the rationality of classification. Moreover, to avoid the conventional problems of fuzziness and overlap of classification boundaries, a clustering algorithm combined with probability distribution is proposed. Finally, sedimentary facies, oil levels and oil production intensity are used to validate the reliability and practicability.
2. Methodology
Firstly, the database of low permeability-tight reservoir is established, and the main controlling factors are screened by the correlation analysis. Then, multi-information superposition based on multivariate analysis and grey evaluation is used to comprehensively and quantitatively evaluate the reservoir. Finally, the classification boundaries are determined by the optimized clustering algorithm combined with probability distribution.
2.1. Database construction
Based on a series of tests including permeability, porosity, clay content, threshold pressure gradient (TPG), mercury injection capillary pressure(MICP)and nuclear magnetic resonance(NMR),a reservoir classification database with 452 samples of natural cores is established from 10 typical wells of low permeability-tight reservoirs, as shown in Table 1.
2.2. Screenion of the main controlling factors
In order to ensure factors objectively and representatively,Grey correlation,Pearson correlation,Kendall correlation and Spearman correlation are used in this paper to screen the main controlling factors of reservoir classification. According to the degree of similarity or difference of the development trend among the factors,grey correlation can measure the correlation degree among factors.Pearson correlation is mainly used to measure the linear correlation between data, Spearman correlation and Kendall correlation are mainly calculated by the rank of data matrix (Chen et al., 2022b).
2.2.1. Screenion of the main sequence
The main sequence of the correlation analysis is that one of the factors which is arranged in a certain order,it can reflect the nature of the judged objects, and the relationship between the judged objects and their influencing factors.As shown in Fig.1,the porosity and permeability of the natural core samples of low permeabilitytight reservoirs are not closely related. For the same porosity, the permeability varies by 2-3 orders of magnitude.Thus,we proposed a new indicator named Threshold Flow Zone Indicator(TFZI)as the main sequence.
According to micropore structure and physical properties of the reservoir, the “Flow Zone Indicator” (FZI) was proposed to divide the reservoir flow unit (Amaefule et al.,1993):
Based on the mean hydraulic unit radius (rmh), as shown in Eq.(1), Kozeny and Carmen applied this concept to Poisseuille's and Darcy's Laws, and deduced the relationship between porosity and permeability as shown in Eq. (2).
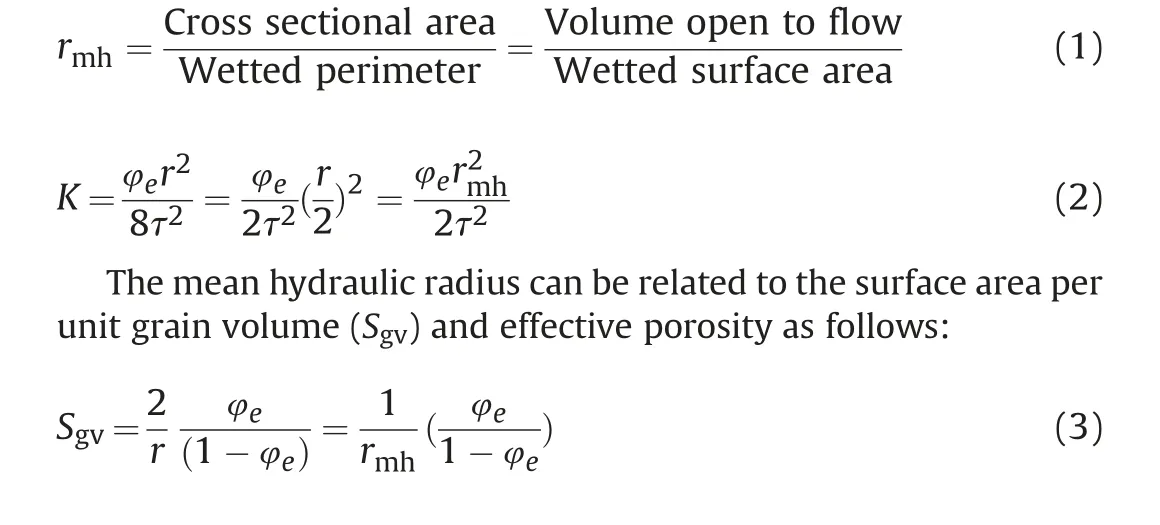
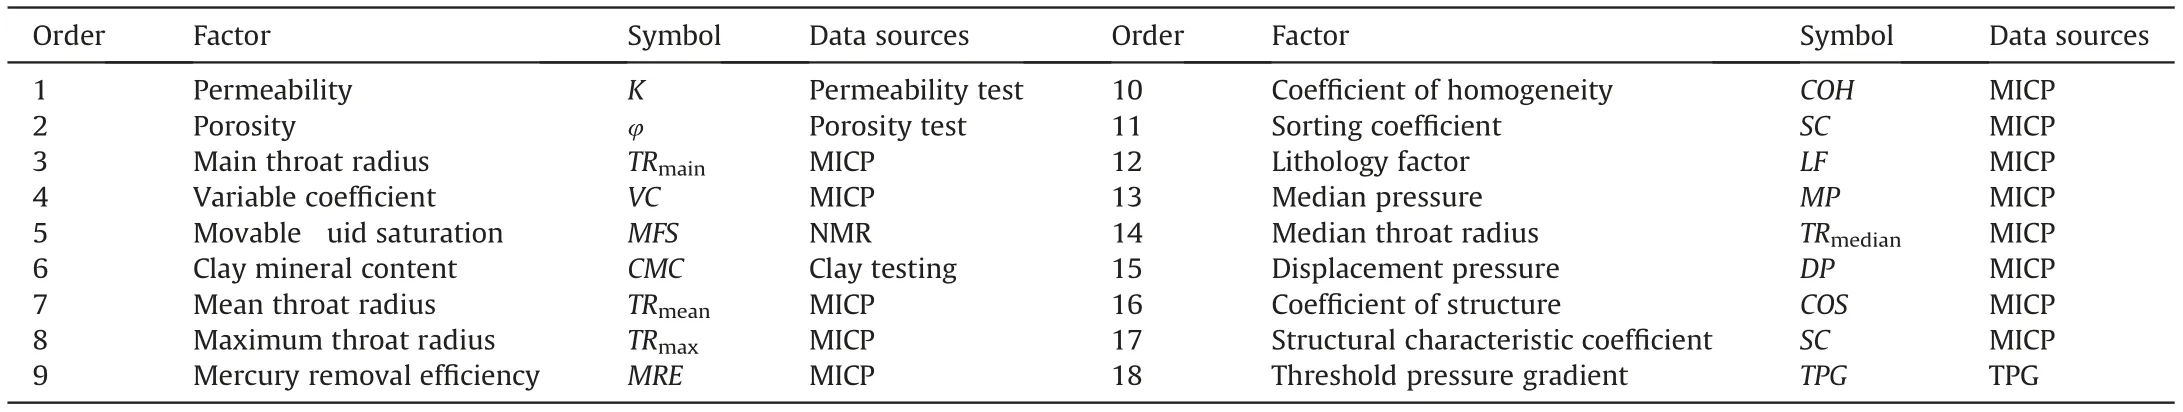
Table 1 Reservoir classification database.
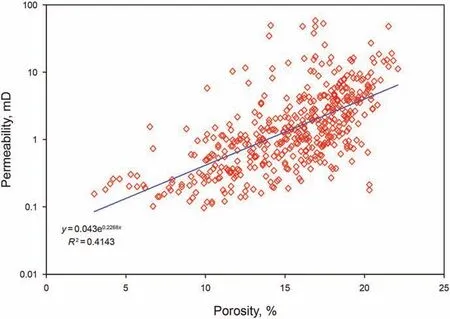
Fig. 1. Porosity and permeability correlation of low permeability-tight reservoirs in Jidong Oilfield.
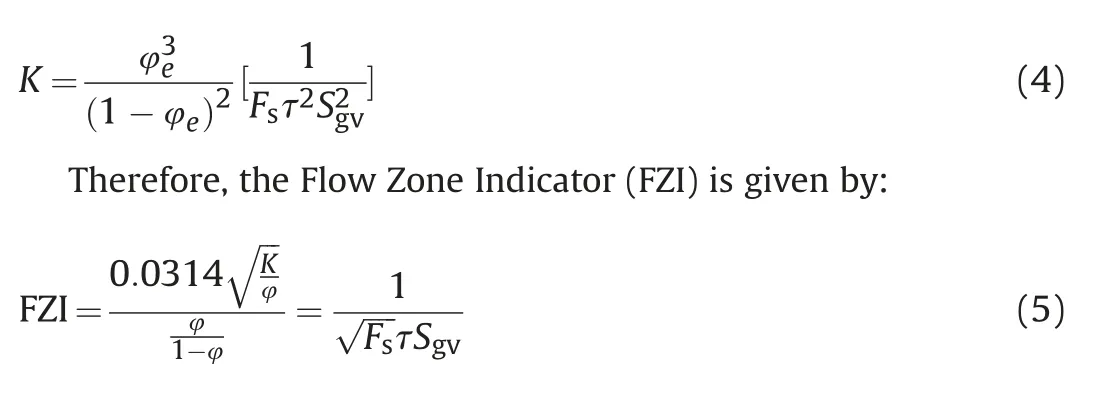
Substituting Eq.(3)for rmhin Eq.(2),the generalized form of the Kozeny-Carmen relationship is given by Eq. (4).where, K is permeability; φ is porosity; Fsis the shape factor introduced to account for non-circular capillary tubes; τ is the hydraulic tortuosity; Sgvis the surface area per unit grain volume.
FZI has been widely used and recognized in rock classification(Lu et al.,2021).And many scholars have made optimization on this basis, such as the “Shale Zone Indicator” (SZI), the “Modified Flow Zone Indicator” (MFZI) and FZI* (Redha et al., 2006; Izadi and Ghalambor, 2013; Soleymanzadeh et al., 2019; Paiaman et al.,2018). However, for the low permeability-tight reservoirs with strong heterogeneity, it is not enough to only consider the characteristics of rock. The characteristics of fluid and the interaction between fluid and rock also cannot be ignored.
When the pressure gradient is lower than a certain limit, the fluid cannot overcome the flow resistance to flow, there is a minimum threshold pressure gradient, and the threshold pressure gradient is the embodiment of the interaction between fluid and rock (Chen et al.,2022c;Miller and Low,1963; Chen et al.,2022a).As shown in Fig. 2, compared with pore parameter φ1.5/(1-φ), the correlation between threshold pressure gradient and median pressure and median radius is significantly better, indicating that threshold pressure gradient can effectively reduce the impact of reservoir heterogeneity.
Hence, “Threshold Flow Zone Indicator” (TFZI) is proposed to comprehensively characterize the quality of low permeability-tight reservoirs:
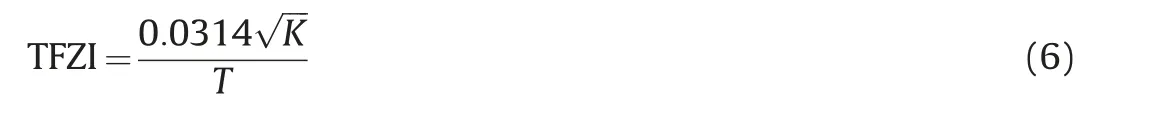
where,TFZI is Threshold Flow Zone Indicator;K is permeability;T is threshold pressure gradient.
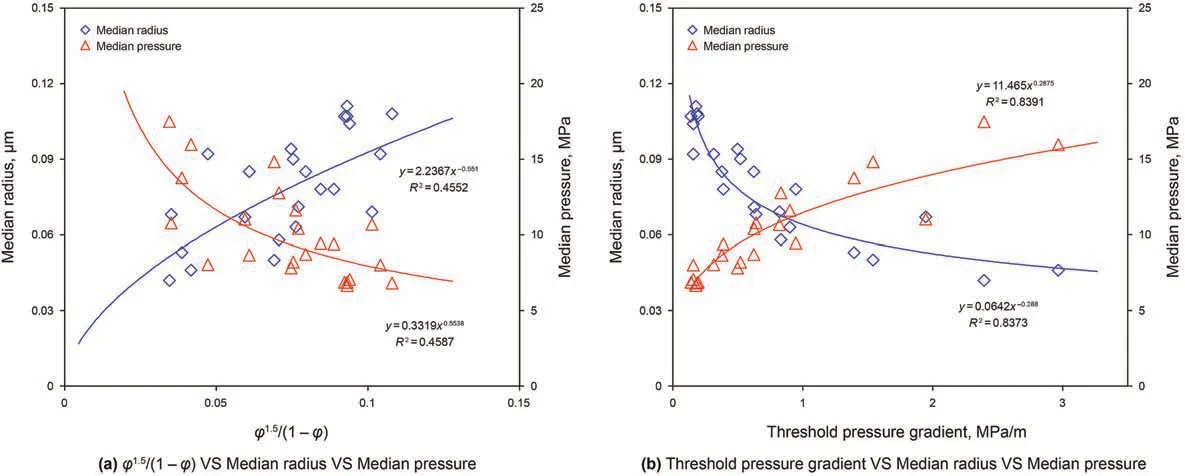
Fig. 2. Comparison of pore parameters φ1.5/(1-φ) and threshold pressure gradient.
As shown in Fig. 3, the poor relationships of FZI VS median radius VS median pressure show that FZI cannot avoid the influence of reservoir heterogeneity. Conversely, the good relationships of TFZI VS median radius VS median pressure show that TFZI can represent the microstructure and seepage capacity of reservoirs and avoid the influence of reservoir heterogeneity effectively.
2.2.2. Threshold pressure gradient experiment
In this paper, the threshold pressure gradient is measured by equilibrium method, the experimental device is shown in Fig. 4.Before the experiment,the core was dried at 108°C for more than 24 h, then the porosity and permeability were measured respectively, and the formation water (salinity 3979 mg/L) was vacuumized. Subsequently, the core was filled into the core gripper and the equipment was assembled.The upper overburden pressure and formation pressure were gradually pressurized with a step length of 2 MPa and an interval of 30 min.The pressure was kept constant and the temperature was heated to 100°C. The injection pump injected simulated oil (0.6 mPa s) at different pressures, and each pressure was stable for 20 min. Finally, turn off the displacement pressure, wait for the pressure to stabilize, record the pressure monitoring indication every 1 h,three consecutive errors less than 4%is qualified.At this point,the pressure is the minimum threshold pressure, and the pressure gradient is the minimum threshold pressure gradient.
2.2.3. Nuclear magnetic resonance experiment
The NMR responses of bound fluid and movable fluid are different.There are obvious differences between movable fluid and bound fluid in NMR T2 spectrum: movable fluid shows larger T2 relaxation time and bound fluid is contrary.

Fig. 3. Comparison of FZI and TFZI.
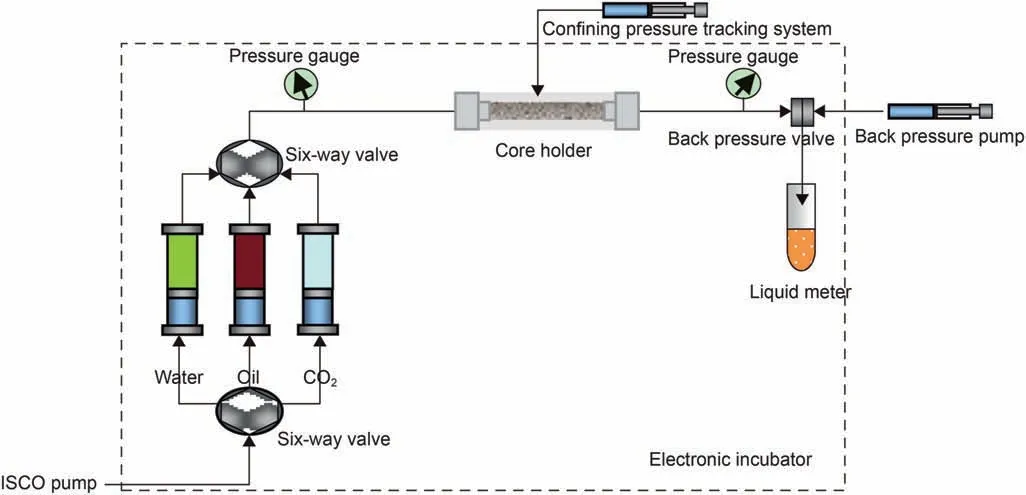
Fig. 4. Threshold pressure gradient experimental device.
MacroMR12-150H-I large-scale nuclear magnetic resonance imaging analyzer is used in the experiment.Before the experiment,the samples were dried for 24 h at 105°C,and the dry weight was weighed.The dry samples were put into NMR equipment to test T2 spectrum signal.Then,the sample was vacuumized(-0.1 MPa)for 2 h,and saturated oil was pressurized(15 MPa,12 h).The saturated sample was taken out, and the sample surface was wiped with a wet paper towel to weigh the wet weight. Then, the sample was placed in a nuclear magnetic equipment to measure the T2 spectrum and nuclear magnetic image of the saturated sample. The relation between oil volume and NMR semaphore is established,and the volume and saturation of saturated oil in core are calculated by weighing method and NMR method respectively. A back pressure of 4 MPa was set at the outlet end, and heavy water was injected at different pressure until the spectral line no longer changed.2-3 T2 spectra and 1 image were tested at each injection pressure. Finally, the movable fluid in the pores was calculated according to the spectral line variation.
2.2.4. Mercury injection capillary pressure experiment
Different from the conventional mercury injection, the low velocity of constant velocity mercury injection (usually 0.00005 mL/min)can ensure the quasi-static mercury injection process.The test results can provide capillary pressure curves of pores and throats respectively, and provide rock micro structure characteristic parameters such as pore radius distribution,throat radius distribution and so on.
ASPE-730 Automated System for pore examination was used in the experiment. Before the experiment, the core was washed and dried,and then the porosity and permeability were measured.Mercury is injected at a constant speed(0.00010 mL/min),the maximum mercury inlet pressure is 900 psi,and the temperature is 25°C.
2.3. Comprehensive and quantitative evaluation
The complex reservoir classification can be transformed into a systematic mathematical operation process by quantitative evaluation such as the multivariate analysis method and the grey correlation method. In this study, both methods are screened for further multi-information superimposition to obtain a comprehensive classification coefficient (Z).
2.3.1. Multivariate analysis
The reservoir classification is affected by many factors, thus, a comprehensive indicator which can reflect reservoir characteristics synthetically and quantitatively is needed (Bertolini et al., 2015).
According to the positive and negative effects of various factors on reservoir properties,the main controlling factors are normalized and combined:
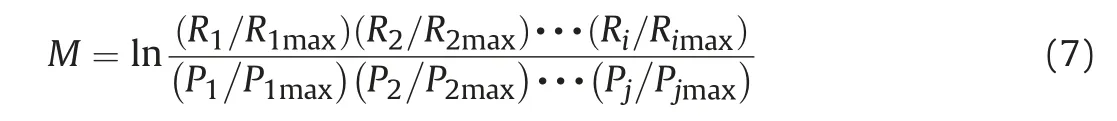
where M is the multivariate classification coefficient;Riis the main controlling factor which is positively related to the effective reservoir space and actual percolation ability; Pjis the main controlling factor which is negatively related to the effective reservoir space and actual percolation ability.
2.3.2. Grey evaluation
Multivariate analysis regards the degree of influence of each main controlling factor on reservoir quality as the same.Using grey evaluation method to determine the weight coefficient of the main controlling factors can objectively and quantitatively reflect the importance of the main controlling factors (Song et al., 2007).The weight of each main controlling factor is determined by the result of correlation degree:
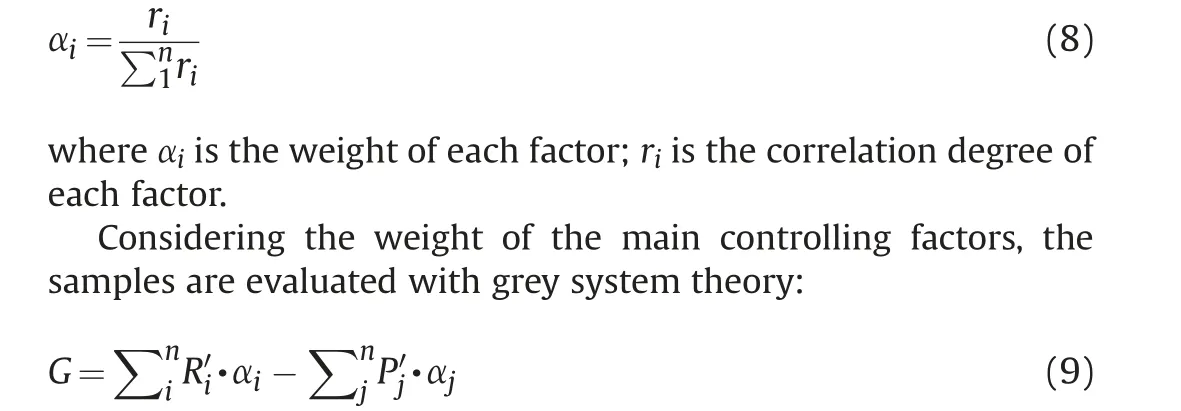
where G is the grey classification coefficient;R'iis the normalization value of main controlling factor which is positively related to the effective reservoir space and actual percolation ability; P'jis the normalization value of main controlling factor which is negatively related to the effective reservoir space and actual percolation ability.
2.3.3. Multi-information superimposition
The concept of multi-information superimposition is to combine many kinds of relevant information screenively according to a certain algorithm to obtain the combined information and realize further comprehensive evaluation. A new indicator named comprehensive classification coefficient (Z) which describes the comprehensive property of low permeability-tight reservoirs, is proposed by multiplying multivariate classification coefficient (M)and grey classification coefficient (G):
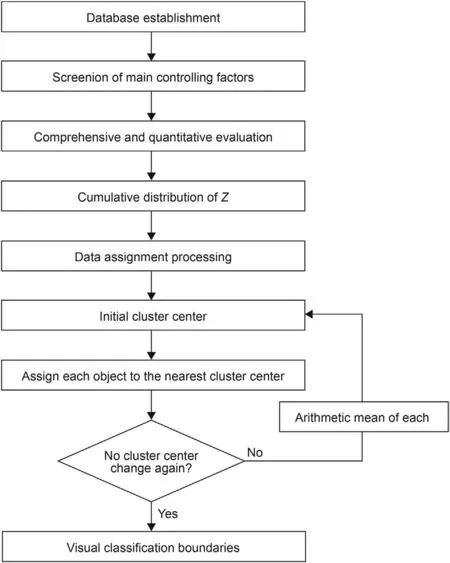
Fig. 5. Determination process of classification boundaries.
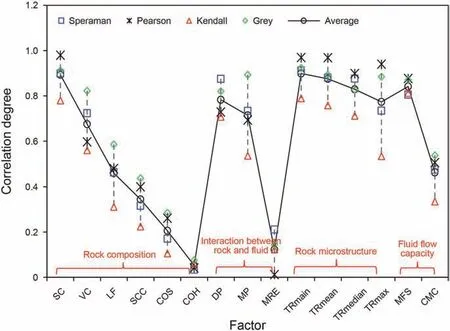
Fig. 6. Correlation degree of Speraman correlation, Pearson correlation, Kendall correlation and grey correlation.

where Z is comprehensive classification coefficient; M is the normalized multivariate classification coefficient; G is the normalized grey classification coefficient.
2.4. Identification of classification boundaries
The K-means clustering algorithm is an iterative clustering analysis algorithm to divide M points in N dimensions into K clusters so that the within-cluster sum of squares is minimized.The procedure is to divide the data into K groups, randomly screen k objects as the initial cluster centers,and then calculate the distance between each object and each seed cluster centers, assign each object to the nearest cluster center.Clustering terminates when any of the three conditions are met:no object is assigned to a different cluster,no new cluster center is assigned,and the sum of squares of error is minimum (Hartigan and Wong,1979).
It is not practical to require that the solution has minimal sum of squares against all partitions,except when M,N are small and K=2.Due to the limitation of time and cost,it is not practical for oilfield to provide enough data to fit the classification boundaries. This paper uses the sample data that can fully represent the reservoir properties of the area to establish the cumulative distribution of comprehensive classification coefficient Z, and the classification boundaries are divided by combining with K-means clustering algorithm. The determination process of classification boundaries is shown in Fig. 5.
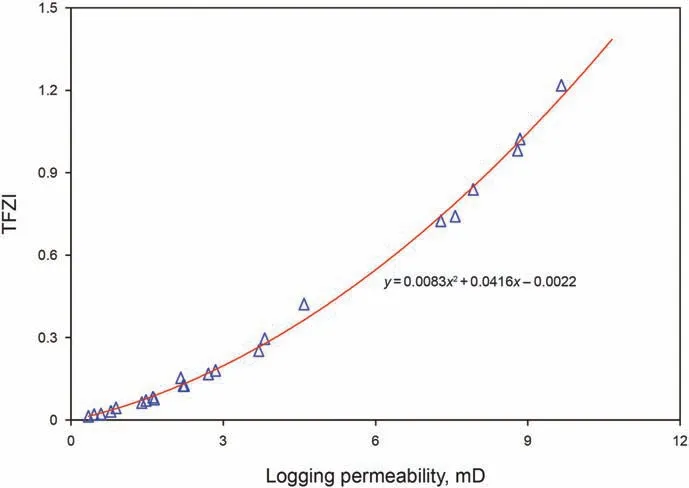
Fig. 7. Conversion relationship between logging permeability and TFZI.
3. Results and conclusion
First, the main controlling factors are screened, on this basis,reservoirs are evaluated comprehensively and quantitatively.Then,classification boundaries are determined,and finally,the reliability and practicability are validated.
3.1. Screenion of the main controlling factors
It is believed that the rock composition,the rock microstructure,the fluid flow capacity,and the interactions between rock and fluid,are four main aspects for the reservoir characterization. Thus, in this paper,we screened 15 easily obtained factors to represent the reservoir quality from different aspects.
On this basis, as shown in Fig. 6, Grey correlation, Pearson correlation, Kendall correlation and Spearman correlation, are used and evaluated comprehensively to screen the representative parameters for the following reservoir classification. The correlation degree between different factors and TFZI is shown in Table 2.
The four factors are screened by correlation analysis from 15 factors which represent the four main aspects of the reservoir:The sorting coefficient represents the uniformity of rock composition,the main throat radius represents the rock microstructure, the movable fluid saturation represents the fluid flow capacity,and the displacement pressure represents the interaction between rock and fluid.
Morever, the relationship of logging permeability and TFZI is established to improve the practicability.As shown in Fig.7,it obeys the quadratic relationship. Also, the relationship of TFZI with the four main controlling factors are plotted in Fig.8.The fitting degreeis acceptable for field application. Thus, with the logging permeability, it can be easily applied to actual wells by the new classification method.
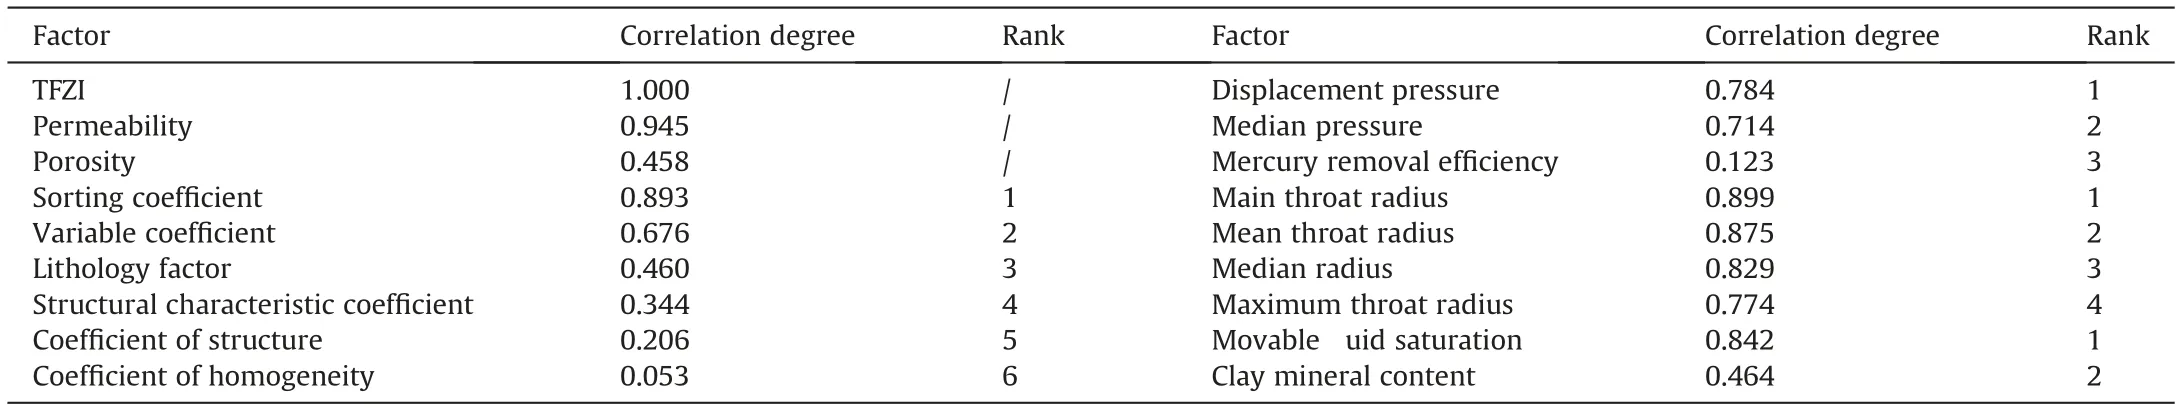
Table 2 Correlation degree between different factors and TFZI.
3.2. Comprehensive and quantitative evaluation
The weights of the main controlling factors are shown in Table 3 by the above formula.
As shown in Fig. 9, the main controlling factors have a good correlation with multivariate classification coefficient(M)and grey classification coefficient (G), which indicates that these two coefficients can comprehensively and quantitatively characterize the reservoir quality.
Correspondingly, as shown in Fig.10, the main controlling factors have a good correlation with Z, which indicates that Z can comprehensively and quantitatively characterize the reservoir quality.
3.3. Identification and comparison of classification boundaries
3.3.1. Identification of classification boundaries
Based on the core sample database,the cumulative distribution of Z is shown in Fig.11(a), which can reflect the distribution characteristics of Z in the low permeability-tight reservoirs.
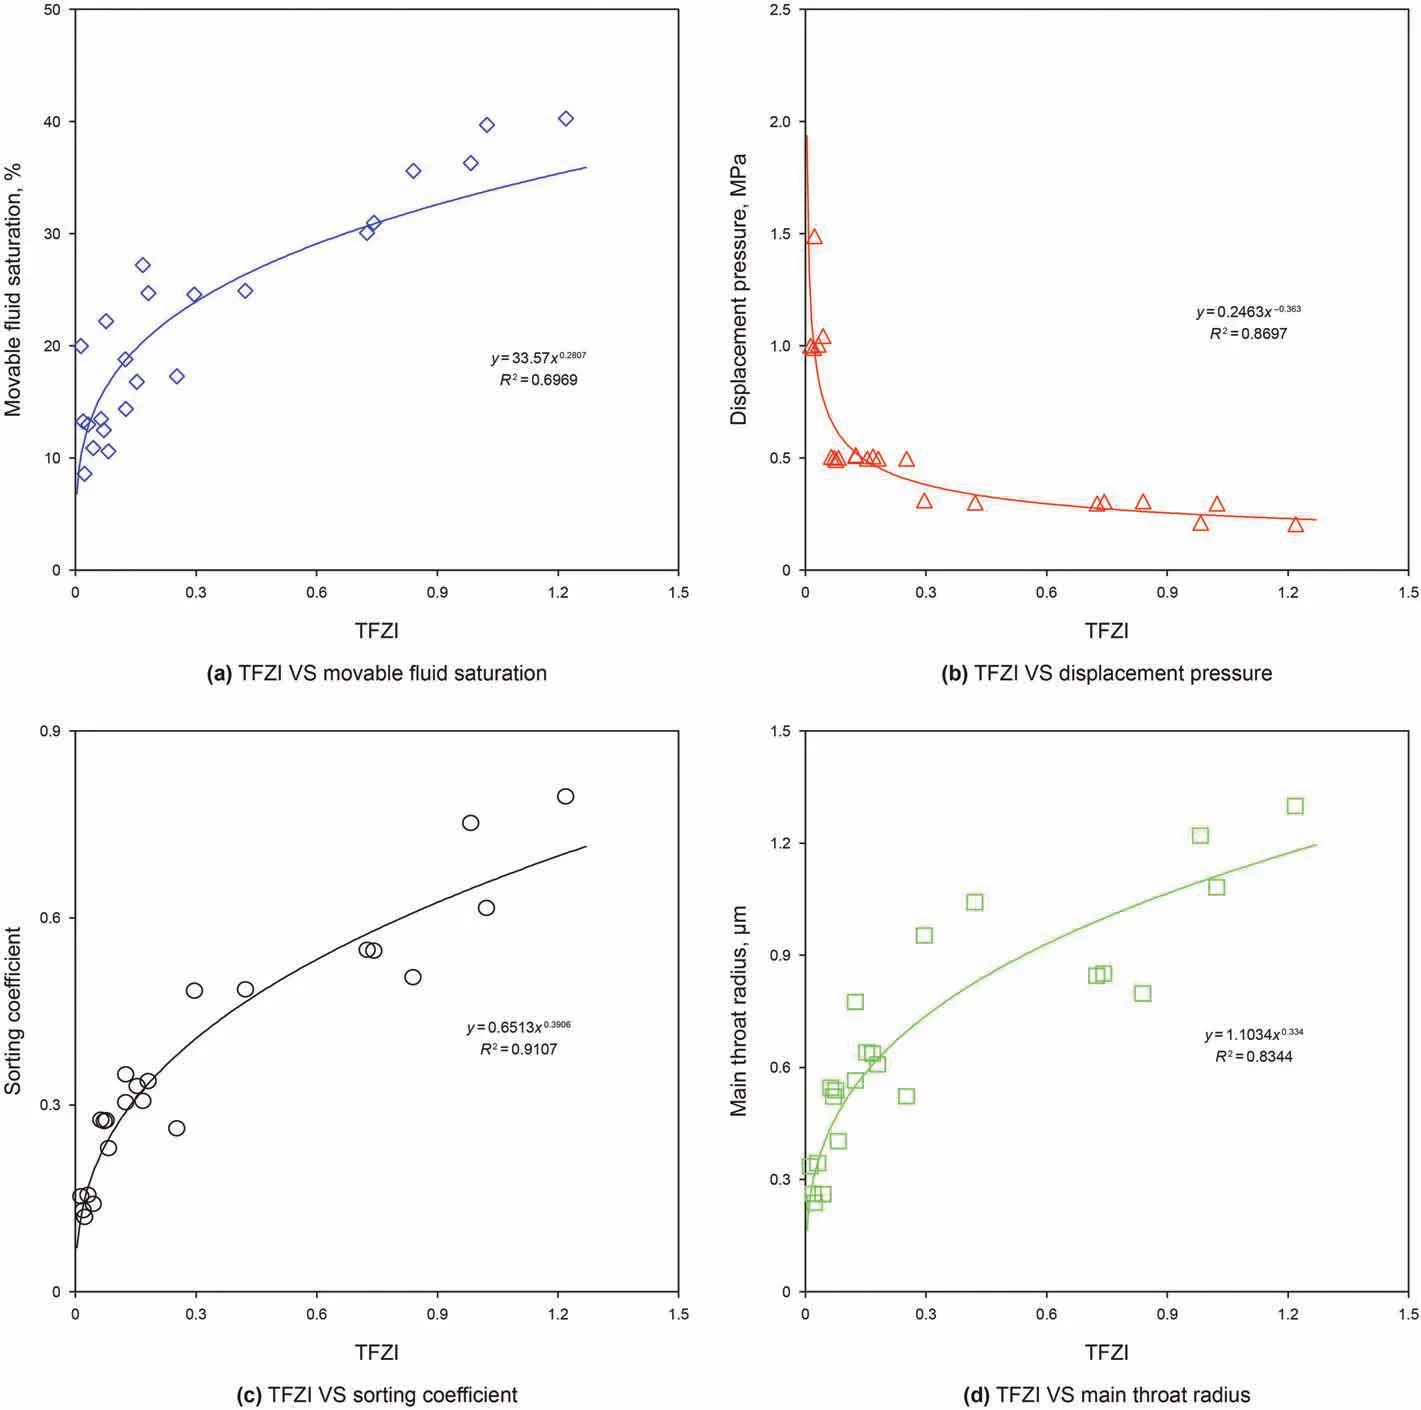
Fig. 8. Relationship of TFZI with main controlling factors.

Table 3 Weight of main controlling factors.
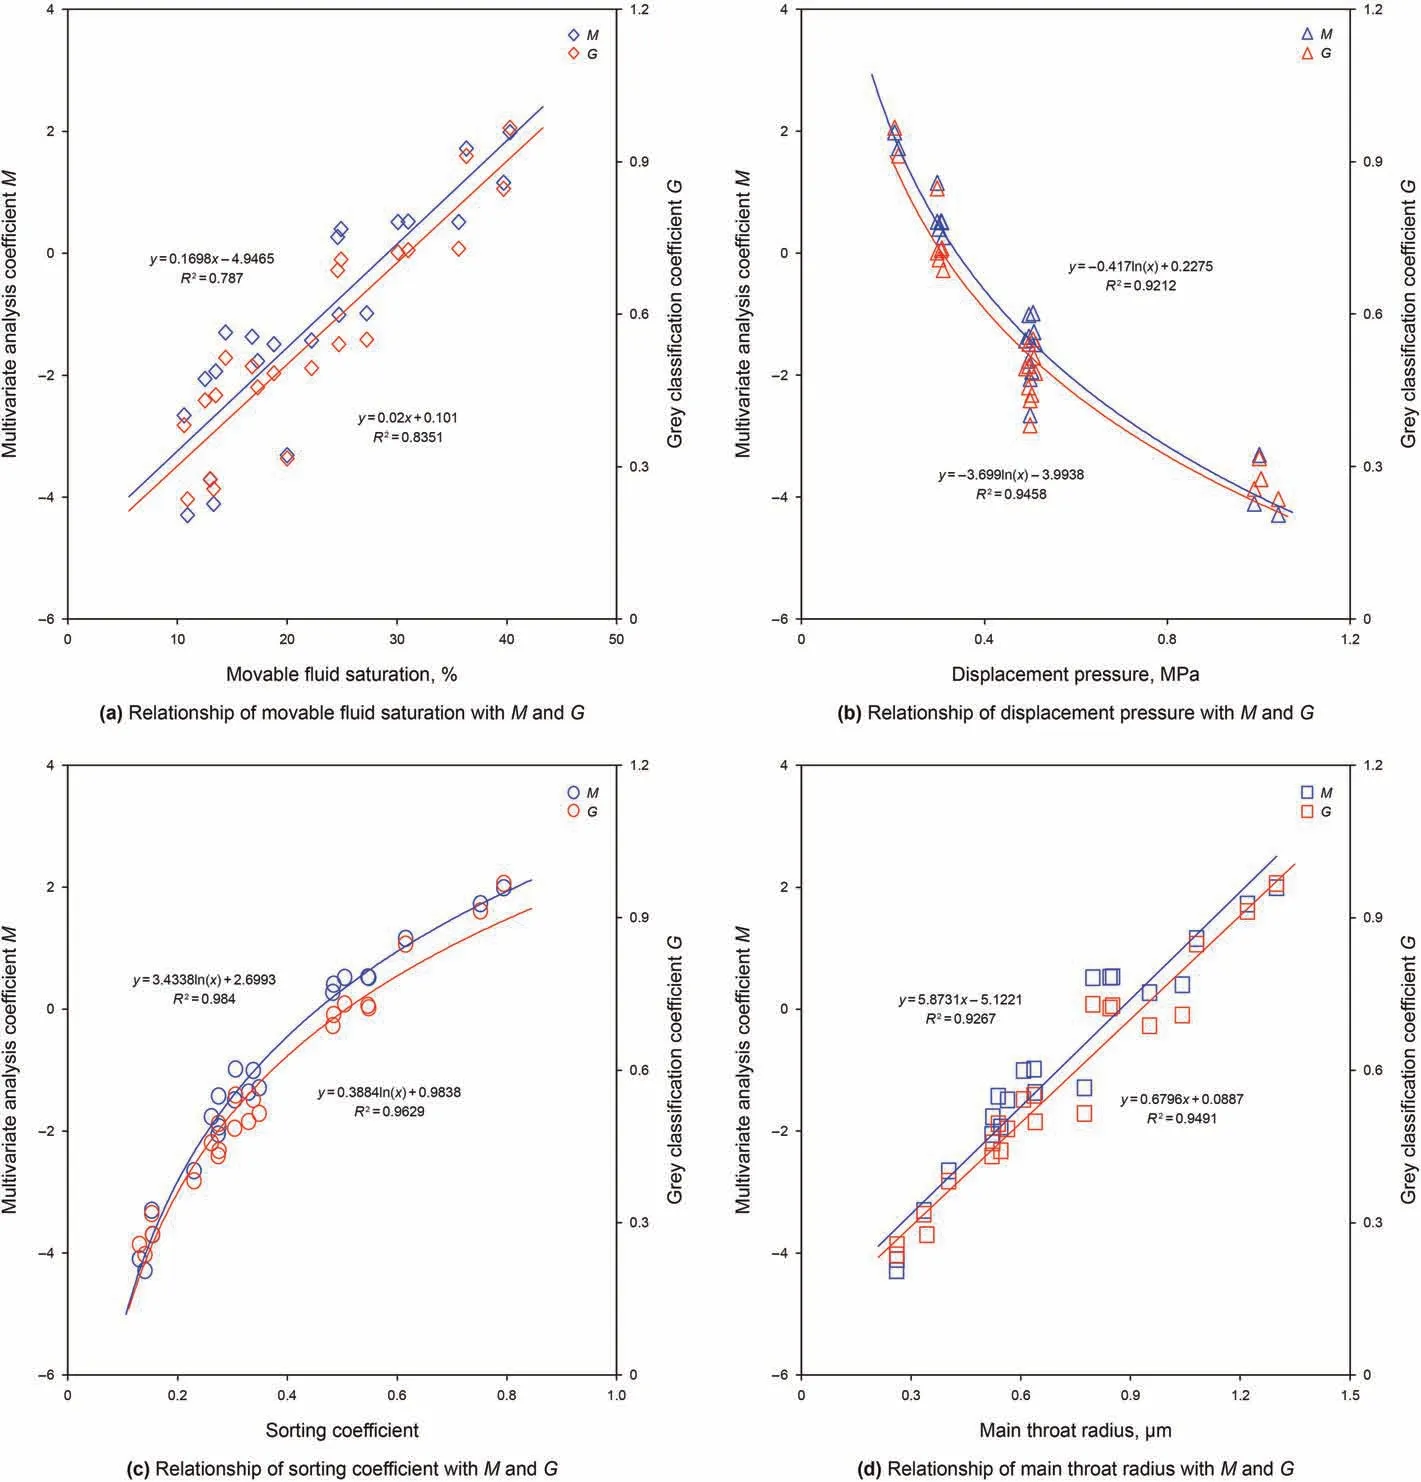
Fig. 9. Relationship of main controlling factors with multivariate classification coefficient (M) and grey classification coefficient (G).
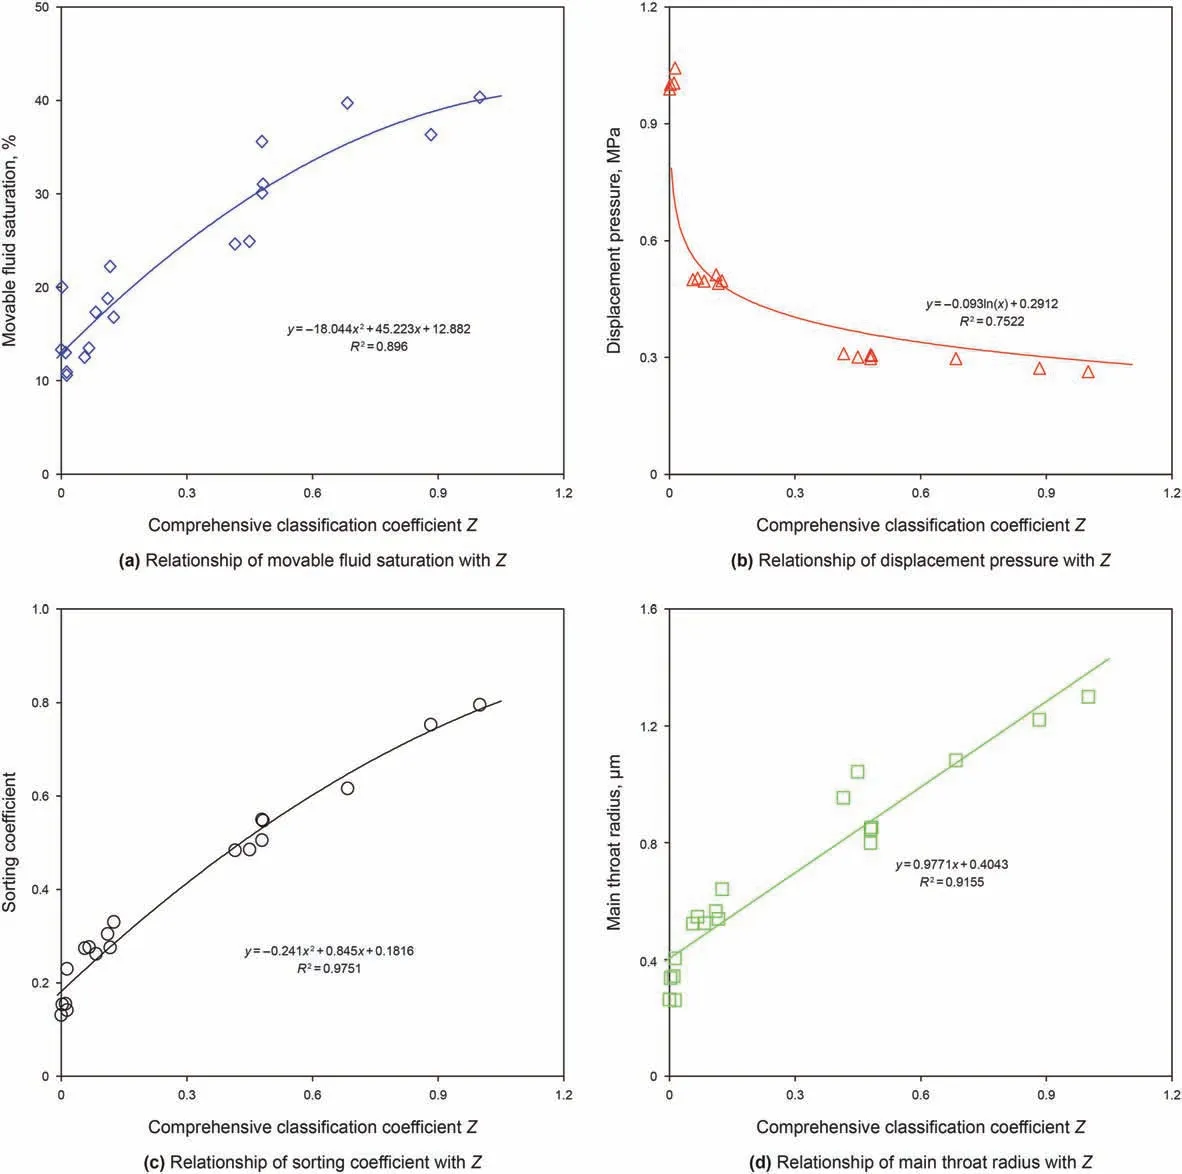
Fig.10. Relationship of main controlling factors with comprehensive classification coefficient Z.
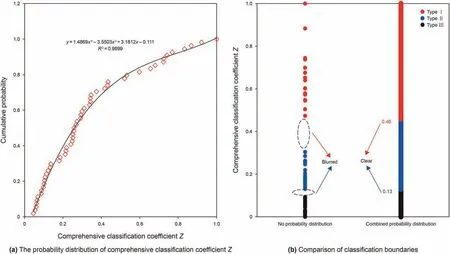
Fig.11. Determination of classification boundaries.
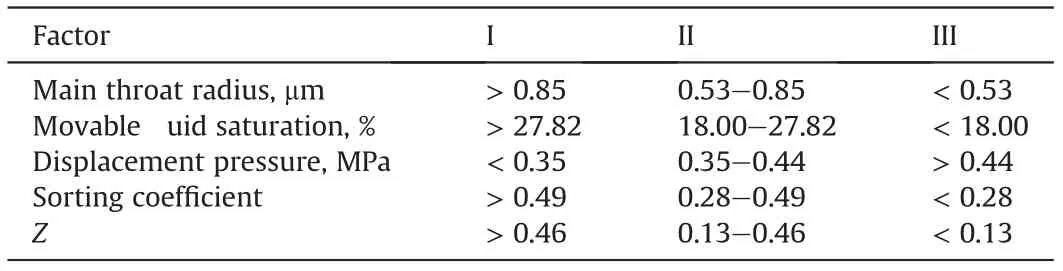
Table 4 Comprehensive classification system.
The K-means clustering algorithm was carried out for Z, by combining the assignment of probability distribution, the boundaries are well fitted. As can be seen from Fig. 11(b), the classification boundaries of this method are clearer than traditional K-means clustering algorithm.
Combining the relationship between main controlling factors and Z,a comprehensive classification system for low permeabilitytight reservoirs is established, as shown in Table 4, which divides low permeability-tight reservoirs into 3 categories.
3.3.2. Comparison of classification boundaries
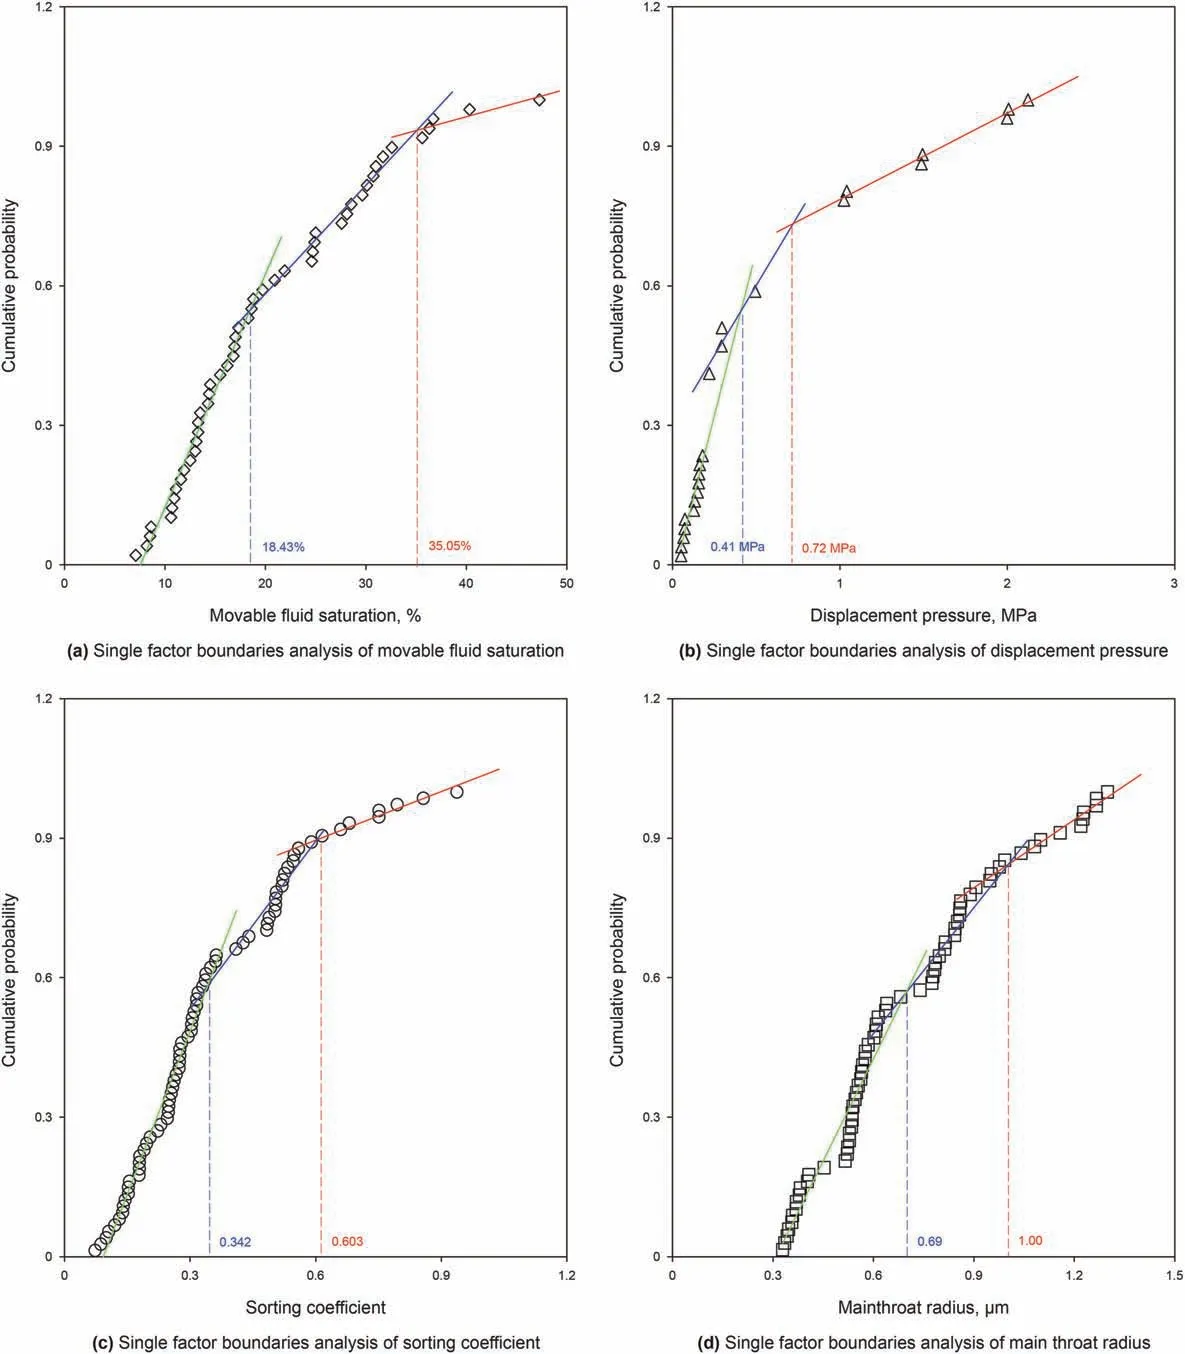
Fig.12. Single factor boundaries analysis of each main controlling factor.
The single factor classification uses an evaluation factor to classify reservoirs. If the correlation between the factors is poor, it will cause different factors of the same sample to be classified into different types, which makes the classification of different factors contradictory. The classification boundaries of the single factor cumulative probability curves are shown in Fig.12.
As shown in Tables 5 and 7 typical wells are classified according to the results of single factor analysis. Taking only one of the main controlling factors as the evaluation factor, only 4 wells with good physical properties has a unified classification result,and other wells with poor physical properties are divided into at least two categories.
On the contrary, as shown in Table 6, the results obtained by using the comprehensive classification coefficient Z are consistent and there is no contradiction. In order to establish an accurate reservoir classification standard,it is necessary to fully consider the influence of each main controlling factor for comprehensive analysis. This indicates that our method is very meaningful for the classification of low permeability-tight reservoirs with poor physical properties.
3.4. Analysis of classification accuracy
The above research is mathematical and static evaluation based on micro factors.Here we verify the rationality of this method from physical properties of macro sedimentary facies, oil levels and oil production intensity.
3.4.1. Physical properties of different sedimentary facies
The sedimentary facies types of low permeability-tight reservoirs in Jidong Oilfield include estuary dams (subdivided into the main body of the dam, the inner edge of the dam, and the outer edge of the dam) and riverway.
The characteristics of porosity and permeability distribution are shown in Fig.13(a).The physical properties of the dam body are the best, followed by the riverway, the inner edge of the dam and the outer edge of the dam.Among them,the main body of the dam and the riverway are the dominant oil-bearing facies,the inner edge of the dam which has good physical properties is oil-bearing,and the remaining sedimentary facies are dry layers.
The average permeability of the main body of the dam with best physical properties is 3.02 mD, that of riverway with middle physical properties is 0.93 mD, and that of the inner edge of the dam with worst physical properties is 0.87 mD. This is consistent with the classification result of permeability under the comprehensive classification coefficient Z in Fig.13(c). It can be seen that the classification boundaries are in good agreement with the performance of the actual sedimentary facies.
In fact,there are mainly three oil levels:oil immersion,oil spot and no oil.As shown in Fig.13(b),with the deterioration of physical properties, the proportion of oil immersion gradually decreases,and the proportion of no oil is opposite.
Further,we discuss the causes of this difference from the micro level. As shown in Fig.14, under the same capillary pressure, the mercury saturations of reservoir types I,II and III decrease in turn.For different reservoirs,the higher the sorting coefficient,the more homogeneous the rock,the larger the throat radius,the smaller the fluid flow resistance and the easier it is to flow.
In fact, the contribution of different throats to permeability is different. As shown in Fig.15, combined classification boundaries,for type I reservoir (Z > 0.46, K > 3.1 mD), 80% of permeability is contributed by throat radius above 0.85 μm, and that of type II reservoir (0.13 < Z < 0.46,1.1 mD < K <3.1 mD) is above 0.53 μm.Correspondingly, the permeability of type III reservoir (Z < 0.13,K<1.1 mD)is mainly provided by throat radius below 0.53 μm.In addition, the worse the physical properties of the reservoir, the smaller the radius of the main throat and the closer it is to the maximum throat radius. This change is nonlinear and conforms to the nonlinear seepage law of low permeability-tight reservoirs.
3.4.2. Oil production intensity of different types of reservoirs
Reservoir classification evaluation only uses static geological factors to classify reservoirs, and it needs to be combined with productivity to check whether the classification is correct. According to the results of reservoir classification, the oil production intensity of different types of wells during the stable production period is analyzed.As shown in Fig.16,the oil production intensityof wells type I is greater than 1.70 m3/(d∙m),that of wells type II is 0.99-1.70 m3/(d∙m),and that of wells type III is less than 0.99 m3/(d∙m).
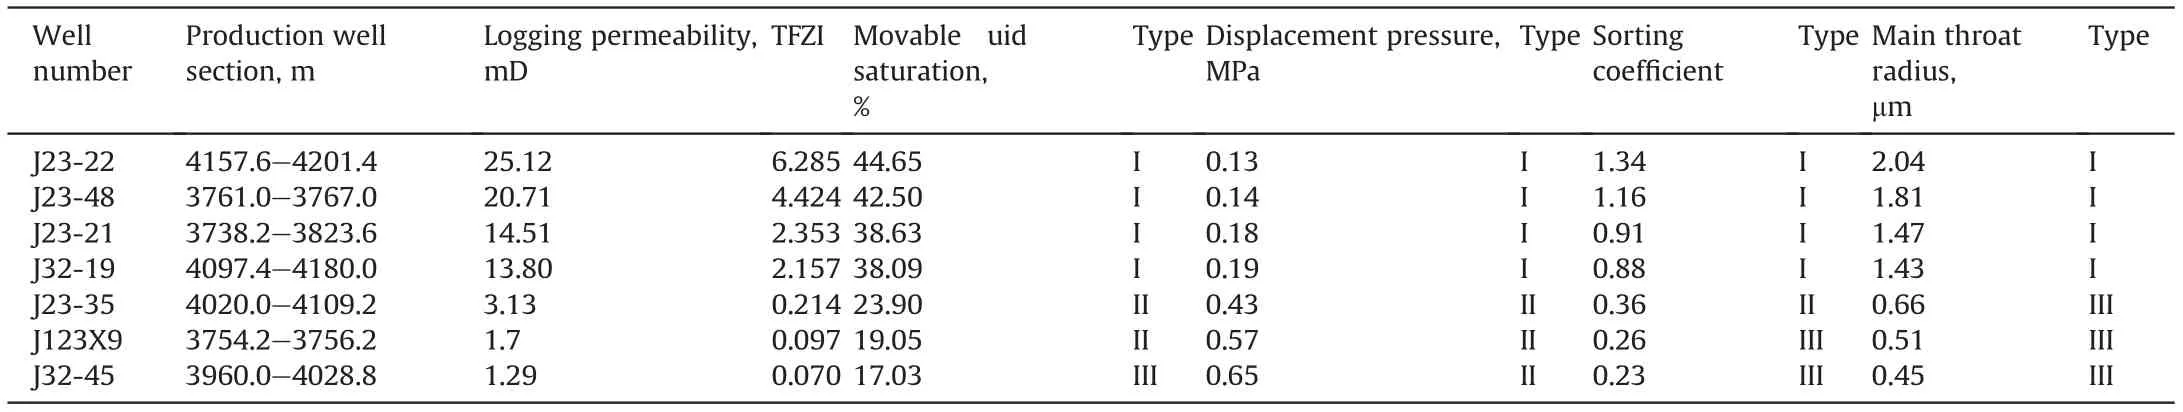
Table 5 Single factor classification of different wells.
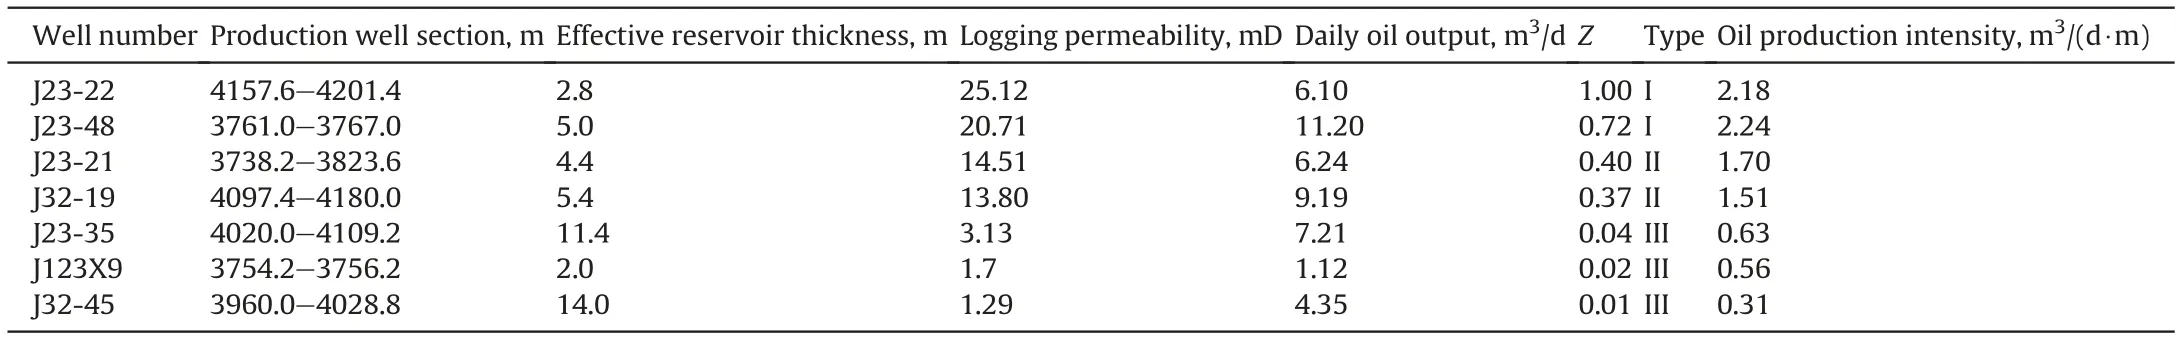
Table 6 Oil production intensity of different types of wells.
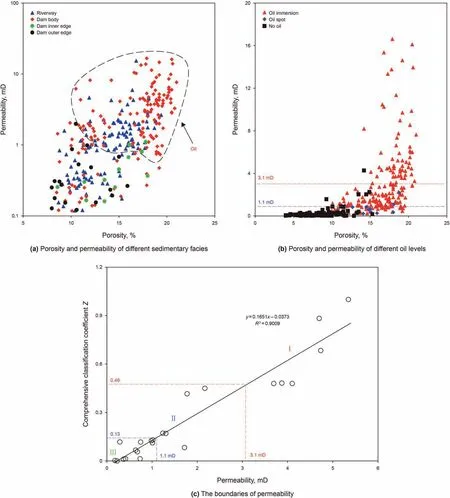
Fig.13. The physical properties of different sedimentary facies and oil levels.
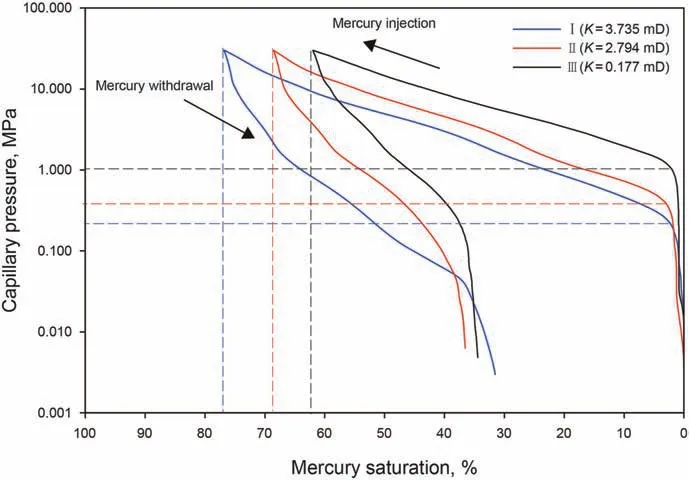
Fig.14. Capillary force curves of different types of reservoirs.
In addition,the well J32-45 is taken as an example.As shown in Table 7, the production section is 3960.0-4028.8 m, there are 7 effective oil producing sections,the effective thickness is 14 m and the average logging permeability is 1.29 mD. It can be concluded that the well J32-45 belongs to type III with the comprehensive classification coefficient Z of 0.01. The oil production intensity is 0.33 m3/(d∙m).As shown in Fig.17,the daily oil production data of well J32-45 with a stable production period of 60 days are screened,and the oil production intensity of the well is 0.31 m3/(d∙m),which is only 6.45% of the error compared with the calculation result of 0.33 m3/(d∙m).It verifies the reliability of the classification method.

Fig. 16. Relationship between oil production intensity and comprehensive classification coefficient Z.
4. Conclusion
(1) The indicator TFZI,considering the interaction between fluid and rock, can be introduced as the main sequence of correlation analysis to screen the main controlling factors. The sorting coefficient, main throat radius, movable fluid saturation and displacement pressure are concluded to play major roles in the four key aspects: rock composition,microstructure, flow capacity and the interaction between rock and fluid.
(2) The accuracy of classification boundaries is greatly affected by data integrity. Based on comprehensive quantitative evaluation, the optimal clustering algorithm is combined with probability distribution to enhance the accuracy and reduce the uncertainty classification.
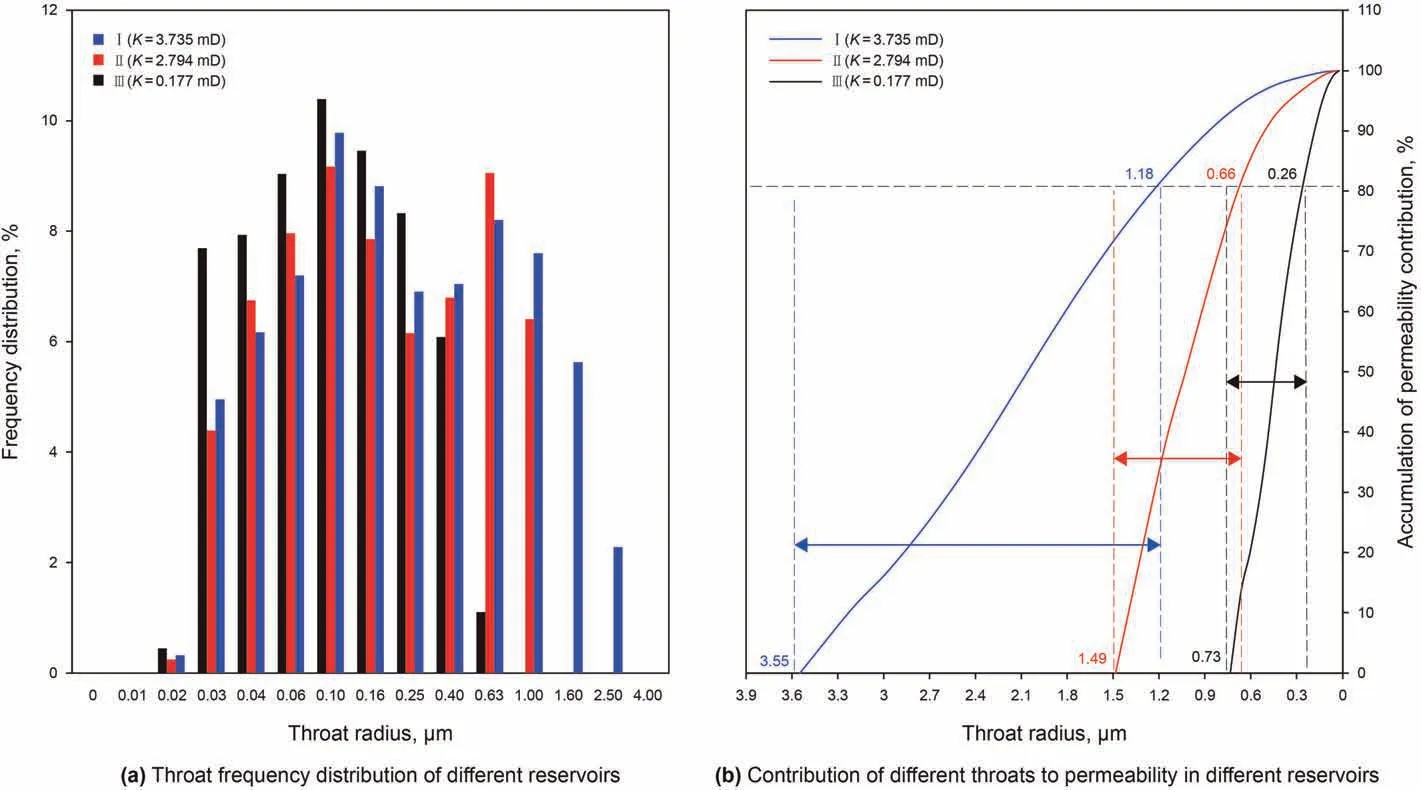
Fig.15. Relationship between throat distribution and permeability.
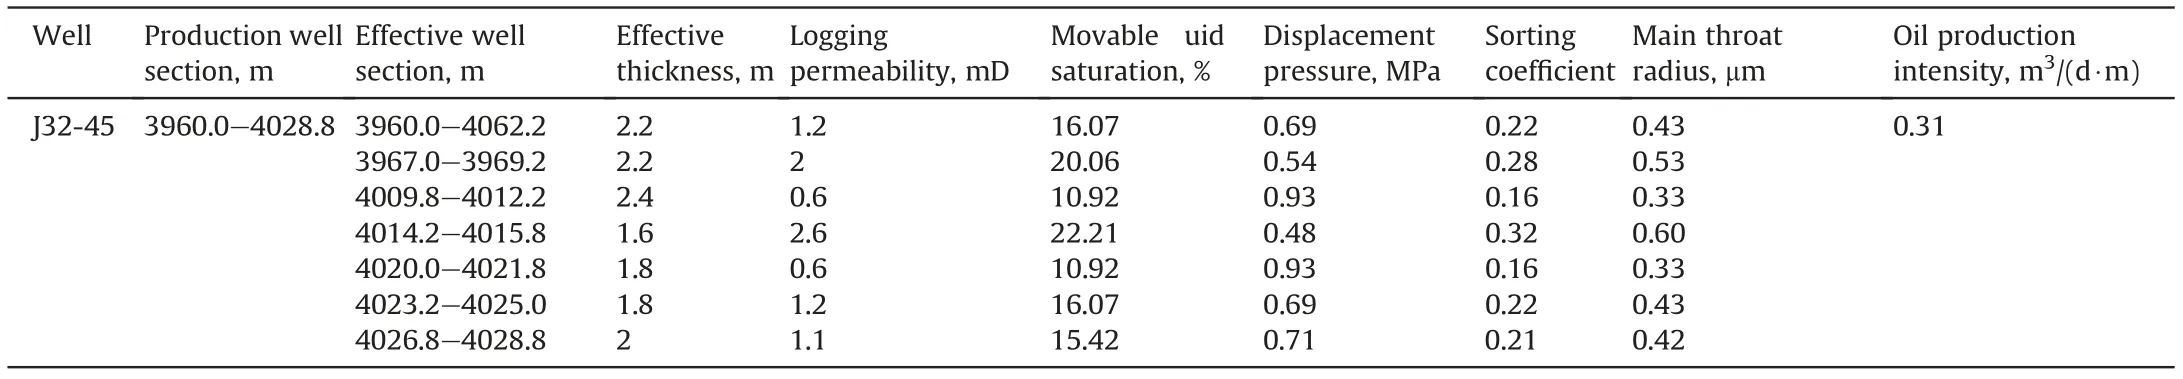
Table 7 Single well analysis.
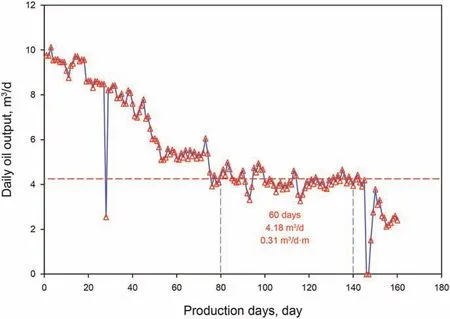
Fig.17. Production performance curve of well J32-45.
(3) A comprehensive classification system is proposed for the low permeability-tight oil reservoirs of Jidong Oilfield. The new method of reservoir classification can be applied to the other low permeability-tight reservoirs.
Acknowledgments
This study was supported by China Natural Science Foundation(Grant No.51704303), and Beijing Natural Science Foundation(Grant No.3173044).
杂志排行

Petroleum Science的其它文章
- Primary logistics planning of oil products under the imbalance of supply and demand
- Advances in enhanced oil recovery technologies for low permeability reservoirs
- Measurement of pore diffusion factor of porous solid materials
- Catalytic oxidation of pentanethiol on basic nitrogen doped carbon hollow spheres derived from waste tires
- Temperature effect on the dynamic adsorption of anionic surfactants and alkalis to silica surfaces
- Effects of modified graphene oxide (GO) nanofluid on wettability and IFT changes: Experimental study for EOR applications