Temperature effect on the dynamic adsorption of anionic surfactants and alkalis to silica surfaces
2022-09-23MrcoMsulliZiLongLiuFengZhiGuoXueLiErnstSudholterNveenKumr
Mrco Msulli , Zi-Long Liu ,*, Feng-Zhi Guo , Xue Li , Ernst J.R. Sudh¨olter ,Nveen Kumr
aBeijing Key Laboratory of Optical Detection Technology for Oil and Gas, China University of Petroleum-Beijing, Beijing,102249, PR China
b Organic Materials & Interfaces, Department of Chemical Engineering, Faculty of Applied Sciences, Delft University of Technology, Van der Maasweg 9,2629, Delft, HZ, the Netherlands
Keywords:Temperature Surfactant Alkali Adsorption Enhanced oil recovery
ABSTRACT Chemical loss such as surfactants and alkalis by adsorption to reservoir rock surface is an important issue in enhanced oil recovery (EOR). Here, we investigated the adsorption behaviors of anionic surfactants and alkalis on silica for the first time as a function of temperature using quartz crystal microbalance with dissipation (QCM-D). The results demonstrated that the temperature dependent critical micelle concentration of alcohol alkoxy sulfate (AAS) surfactant can be quantitatively described by the thermodynamics parameters of micellization, showing a mainly entropy-driven process. AAS adsorption was mediated under varying temperature conditions, by divalent cations for bridging effect, monovalent cations competitive for adsorption sites but not giving cation bridging, pH regulation of deprotonated sites of silica, presence of alkoxy groups in the surfactants, and synergistic effect of surfactant coinjection. The addition of organic alkalis can enhance the overall adsorption of the species with AAS,whereas inorganic alkali of Na2CO3 had capability of the sequestration of the divalent ions, whose addition would reduce AAS adsorption. The typical AAS adsorption indicated a non-rigid multilayer,estimated to have between 2 and 5 layers, with a likely compact bilayer followed by disorganized and unstable further layering. The new fundamental understanding about temperature effect on surfactants and alkalis adsorption contributes to optimizing the flooding conditions of chemicals and developing more efficient mitigation strategies.
1. Introduction
With increasing global oil demand, declining oil fields, and increasing difficulty in the recovery of hydrocarbons, it calls for effective techniques for more efficient extraction of remaining oil from existing reservoirs (Liu et al., 2021c; Sheng, 2010; Xu et al.,2020). Tertiary recovery, also known as enhanced oil recovery(EOR),offer prospects for generating more reservoirs’original oil in place.As one of the more promising EOR,chemical EOR(cEOR)has attracted much attention because of its higher efficiency,technical feasibility, economic viability, and reasonable capital expenditures(Mandal,2015;Pal et al.,2018).In cEOR,the injection of chemicals such as surfactants and alkalis in a reservoir is mainly to increase the amount of oil that can be mobilized. However, one of the key issues faced in chemical flooding is the loss of chemicals due to their adsorption on the surface of reservoir rocks(Liu et al.,2019a;Tackie-Otoo et al.,2020).As a result,the flooding process becomes more wasteful, less effective, and less economically attractive. To ensure effective propagation of chemicals in porous media, it is therefore important to investigate the adsorption behavior of surfactants and alkalis with the major variables in the process.
To the best of our knowledge, experimental evidence so far acquired on surfactant and alkali adsorption in the context of cEOR concern systems mainly at ambient temperature (Belhaj et al.,2019; Liu et al. 2020, 2021a; Saxena et al., 2019; ShamsiJazeyi et al., 2014). It is essential to expand this by assessing the effect of temperatures higher than ambient,more closely resembling real reservoir conditions, while also assessing the effects of flooding parameters such as chemical nature of the species, their concentration, monovalent ions concentrations, divalent ions concentration,and pH.Considering first the conditions in an oil reservoir,the main reservoir characteristics are rock composition and temperature. Based on the formation rocks, the principal oil reservoirs are typically classified into sandstones and carbonates,with more than 60% of the world oil reserves found in sandstone reservoirs(Bjørlykke and Jahren, 2010). Most of the sandstones are composed of quartz, SiO2and/or feldspar, aluminum silicates minerals, the two most abundant minerals on Earth's crust (Dimri et al., 2012). Thus, a silica sensor is used in the study as a model rock.Temperature in oil reservoirs can vary greatly,also within the same reservoir due to geothermal gradients;a typical value of this gradient has been found to be 1°F every 60 inches (1.8°C every 1.5 m). Reservoir temperatures, therefore, have been recorded to vary from ambient temperature at the surface up to ~ 80°C at 1.8 km of depth (Millikan,1941). Oil can also be found at temperatures ranging from ambient to 150°C(ShamsiJazeyi et al.,2014),or at temperatures of 60-150°C at depths ranging from 1 to 6 km(Inkpen and Moffett, 2011). For this reason, it is of great interest to investigate the effects of increased temperature on adsorption.
In order to understand adsorption results as a function of temperature, it is important to highlight the main effects that this variable has on the different components of the system under examination. Considering first silica surfaces, an increase in temperature causes both an increase in the number of silanol (-OH)functionalities that the surface exposes to the solution and an increase in the degree of deprotonation of these groups, resulting overall in a net increase in the absolute value of the surface charge density (Ramachandran and Somasundaran, 1986; Rodríguez and Araujo, 2006). Considering surfactants solutions, the effect of an increase in temperature has more than one consequence on the mechanism of self-assembly,and therefore the overall influence of temperature comes from a balance of its different implications.Two opposing forces playing a role in micellization are the hydrophobic interaction between tails and the electrostatic repulsion between heads, but the temperature dependence of these forces is not unambiguous,and multiple interpretations are found in the literature(Ahmadi et al., 2014; Mahmoudi et al., 2019; Miller et al., 1990;Tennouga et al., 2015; Varade et al., 2005). For ionic surfactants, it shows a clear and common trend of a first decreasing and then increasing value of the critical micelle concentration (CMC) with temperature, with a minimum located around room temperature(Kang et al.,2001;Tennouga et al.,2015).This aspect is considered to be particularly significant for the understanding of the surfactant adsorption since free (non-aggregated) surfactants in solution contribute to adsorption, and thus a change in the CMC with temperature causes a change in the concentration of the adsorbing species.
Another important aspect to highlight is the ionic composition of injected solutions.Divalent cation,such as Ca2+,is capable to act as ionic bridges between anionic surfactants and negatively charged surfaces, and therefore favoring anionic surfactant adsorption(Kumar et al.,2013;Lashkarbolooki et al.,2017;Liu et al.2018,2021b).Liu et al.described quantitatively a bilayer surfactant adsorption through Ca2+bridging effect(Liu et al., 2021b). Kumar et al. found that a stable monolayer of the surfactant adsorbed on silica through cation bridging with Ca2+was destabilized upon exposure to a solution containing Na+(Kumar et al., 2013). This suggests that sodium cations are exchanged from the solution to the surface displacing calcium ions, and therefore can even promote the desorption of the surfactant from the surface. It is also usually observed that cationic surfactant prefers to adsorb on negatively charged surface,whereas anionic surfactant is attracted to positively charged surface(Liu et al.,2020;Wesson and Harwell,2000). Adjustments of the solution pH can influence the surface charge, and thereby affect the amount of adsorbed surfactants(Ahmadi and Shadizadeh, 2015; Tagavifar et al., 2018). However,there is no systematic and quantitative understanding of how and to what extent cations and solution pH affect the adsorption processes of surfactants and alkalis under varying temperature conditions.
2. Experimental methods
2.1. Chemicals and QCM-D sensors
Water for all dilutions and dissolutions is de-ionized water(resistivity of>18.2 MΩ cm,and 5.3 ppb TOC)from Milli-Q IQ 7000.Salt solutions were prepared by dissolution of dehydrated CaCl2(147.01 g/mol, ≥97%) from Fluka and NaCl (58.44 g/mol, ≥99.5%)from Sigma-Aldrich.Surfactant solutions were provided by Shell as follows:alcohol alkoxy sulfate,AAS(ENORDETTM J771)29.13 wt%,and internal olefin sulphonate,IOS(ENORDETTM O332)/AAS blend 18.8 wt%(Liu et al.,2019a;Negin et al.,2017).Such a AAS surfactant typically contains mainly C12 and C13 alkyl-tails connected via seven propoxy units to a head group of ether-sulfate.A blend of IOS and AAS surfactants contains a range of different molecules that have different alkyl-chain length and functional groups along the alkyl-chain, which all play different roles in the phase and adsorption behaviour of the alkali/surfactant/polymer flooding cocktail. Surfactants are reported in Fig.1 along with their structures, temperature stability and divalent ion tolerance. Alkali solutions were purchased from Sigma-Aldrich: ethanolamine (also monoethanolamine,MEA)>99.0%,triethanolamine(TEA)>99.0%,and Na2CO3> 99.0% with pKa values of 9.50, 7.74, and 10.33,respectively. The chemical structures of MEA and TEA were also shown in Fig. 1. pH adjustments to the desired value were conducted with HCl from VWR Chemicals, and NH4OH from NH328.0-30.0%aqueous solution from Sigma-Aldrich.Ethanol(≥96%),isopropanol(≥98%),and centrifugal tubes(50 mL)were purchased from VWR International. All compounds were used as received without further purification. The used silica (QSX 303, Q-sense)covered QCM-D sensors (diameter = 14 mm, thickness = 0.3 mm)were purchased from Q-Sense Biolin Scientific.
2.2. CMC measurements
Conductivity measurements were conducted with SevenCompact Conductivity by Mettler Toledo, utilizing a InLabR 731 ISM electrode, which were performed to measure the CMC of AAS in Milli-Q water at pH 9.5 and temperatures ranging from approximately 10 to 60°C, with 10°C intervals. Concentrations chosen for testing were 0.0001, 0.001, 0.01, 0.02, 0.03, 0.04, and 0.05 wt%. Conductivity of the solutions was measured by placing the electrode in the test-tubes containing the solutions 5 min after the heating bath had reached the set temperature,reached through slow heating (approximately 15-20 min for an increase of 10°C).The value of the CMC is read at the intercept of the two straight line best interpolating the experimental points of conductivity vs concentration.
2.3. QCM-D principles
Adsorption measurements were conducted with Q-Sense QCMD by Biolin Scientific, controlled by the software QSoft401 v. 2.7,utilizing the high temperature chamber QHTC101-005. Based on the principle of the converse piezoelectric effect(Ward and Buttry,1990), adsorption of species on a sensor's surface is monitored through changes in the resonance frequency of the sensor, as well as through the dissipation of energy during the crystal oscillations.Presence of dissipation in the energy of oscillations and spreading of the response to different probing frequencies (frequency overtones) are indication of an adsorbed layer which is not elastic (or rigid),but viscoelastic.For these adsorbed materials,linearly elastic equations cannot accurately describe their properties (Sauerbrey,1959), and more complex viscoelastic modelling is required(Tarnapolsky and Freger, 2018; Yang et al., 2018). In order to perform this modelling, several parameters are unknown and require fitting to data,such as the layer's thickness,viscosity,shear modulus,and the frequency dependence of the last two properties on the frequency of oscillation.To do so,at least the same number of related physical quantities as the number of unknowns has to be measured, which can be done through the analysis of multiple overtones and dissipation curves(Liu et al., 2019a).
The sensor generates mechanical shear deformation waves,whose propagation through the different layers is calculated. The solutions of the equations describing these behaviors can be found in the Voigt model(Liu et al.,2019a;Voinova et al.,1999),which is implemented in the Dfind software provided by QSense.The Voigt model considers a completely elastic sensor coated with viscoelastic layers immersed in a viscous medium. The main assumptions of this model are: (1) Each adsorbed layer covers the entire QCM-D sensor's active area; (2) Each adsorbed layer is homogeneous with a uniform thickness;(3)The bulk medium in which the sensor and layers are immersed is a Newtonian fluid;(4)The layers'viscoelastic properties are described by a Voigt element, where a spring (purely elastic response, characterized by the layers' elastic moduli) is connected in parallel with a dashpot (purely viscous response, characterized by the layers' viscosities). As described above, the frequency and dissipation shifts (Δf, ΔD) depend on several parameters, such as thicknesses, densities, elastic moduli,and viscosities of the adsorbed layers, the density and viscosity of the liquid,and frequency of the mechanical waves.The Dfind allows to consider the frequency dependency of the elastic modulus and of the viscosity through an exponential power law fitting with two additional parameters.
2.4. QCM-D experimental procedures
The sensor crystals were plasma cleaned using Plasma cleaner PDC-002-CE by Harrick Plasma,which were carried out for 10 min at pressures between 1000 and 1200 mTorr (1.3 and 1.6 mbar)before being immediately installed in the QCM-D module.All salts and salts + species of interest (surfactant, alkali, or surfactant + alkali) solutions were prepared to the desired composition by dissolution of the salts and dilution of the species of interest in Milli-Q water.The pH of all solutions was adjusted to the desired pH,with a tolerance of±0.03 from the desired value,under continuous stirring (800-1200 rpm). QCM-D measurements were conducted at temperatures ranging from 20 to 60°C with 10°C intervals for surfactant solutions,and 20°C intervals for alkali and surfactant + alkali solutions. The flow of solutions through the chamber was set at 0.20 mL/min, which was controlled with a peristaltic pump by ISMATEC, ISM935C. The testing sequence was maintained the same for all experiments,injecting in order:Milli-Q water,salts solution,salts+species of interest(surfactant,alkali,or surfactant + alkali) solution, salts solution, Milli-Q water, as represented in Fig. 2. Before each experiment, the frequency of the sensor in flowing Milli-Q water was set to the zero frequency as the reference line. At each injection the solution was flushed through the chamber until the system achieved equilibrium and the stable frequency change was practically chosen to be equivalent to a variation in frequency of less than 1 Hz over a 10-min time interval.In presence of slow desorption of surfactant, injection of the following solution was carried out after 25 min from the injection of the surfactant solution not reaching desorption equilibrium.The averaged values for the QCM-D data were taken and presented for the calculations in the present study.
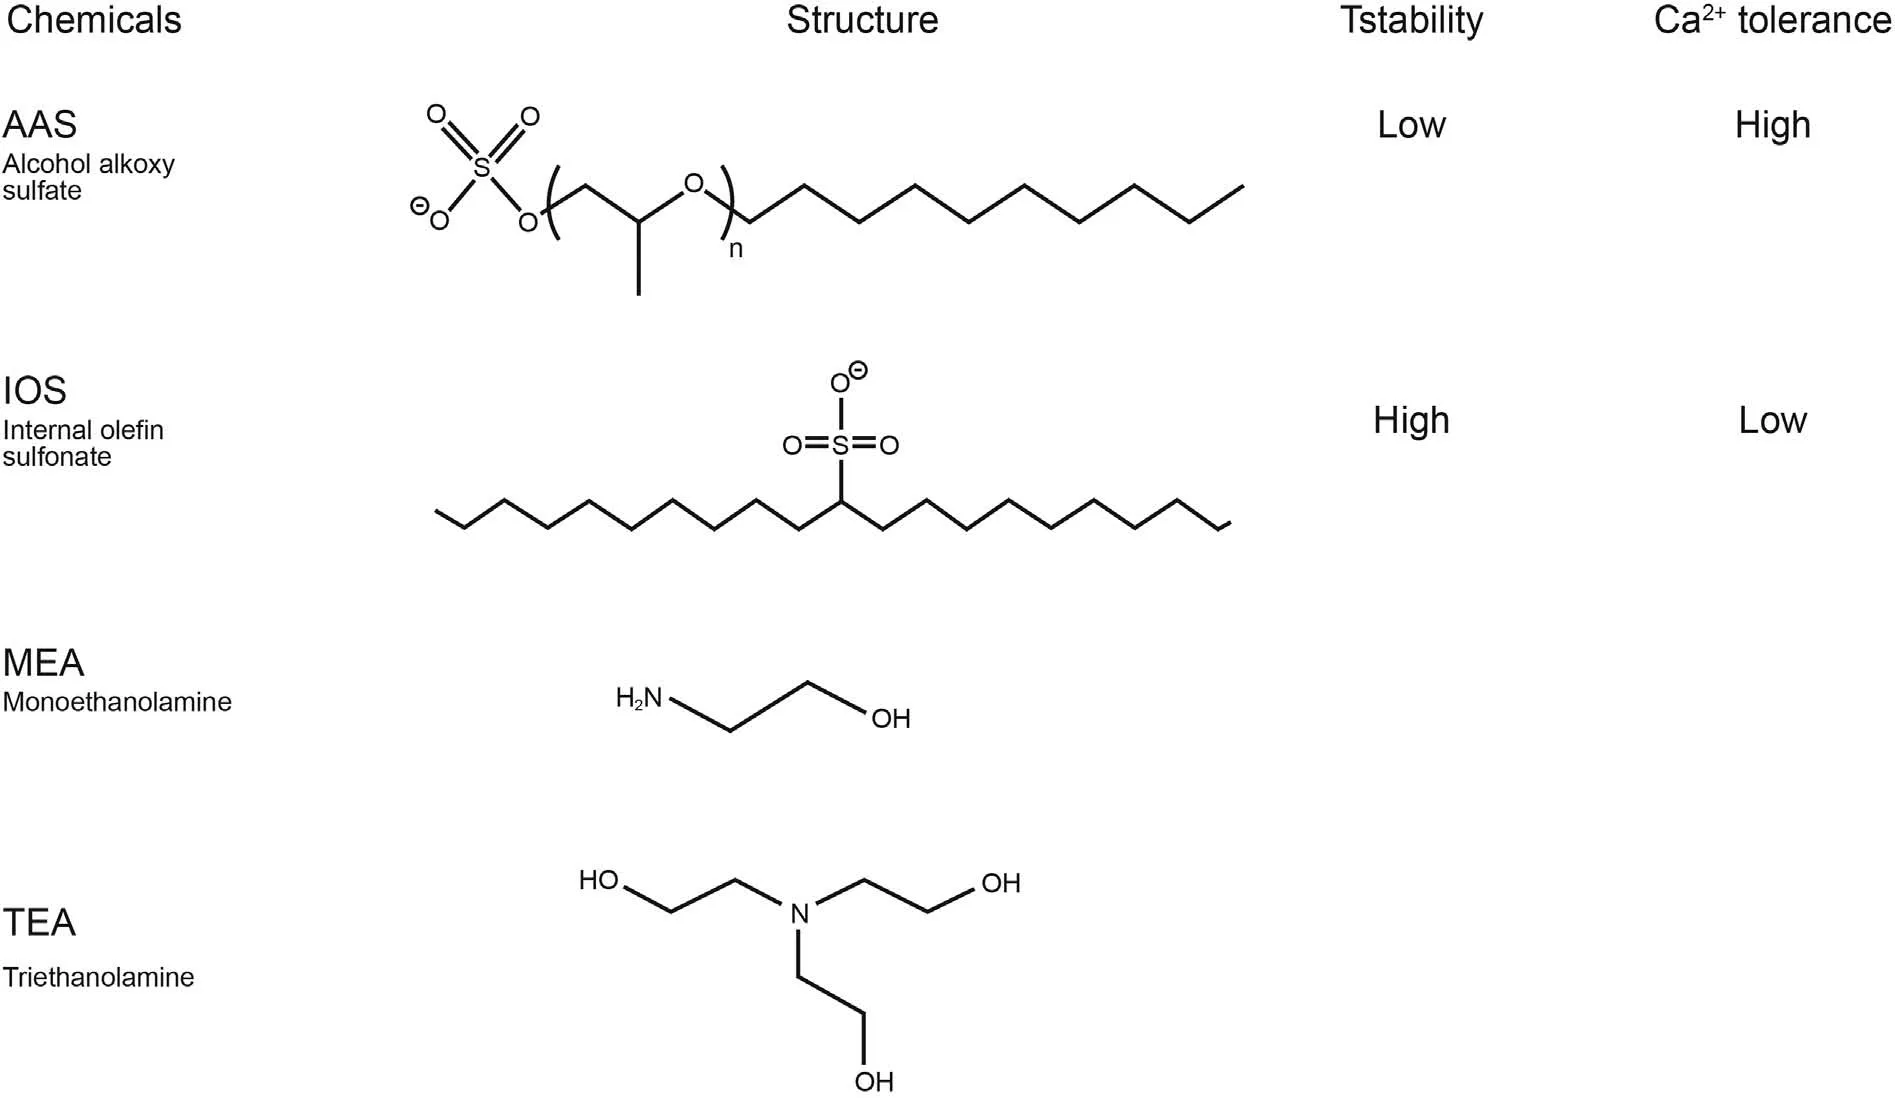
Fig.1. The structure of alkalis and surfactants with its temperature and Ca2+ stability.
3. Results and discussions
3.1. Temperature effect on the CMC of AAS surfactant
Fig.3a presents the result for the CMC of AAS in Milli-Q water as a function of temperature in the range of 13-60°C.It can be found that the CMC of AAS overall increases with increasing temperature,first increases slowly, and then more sharply. However, the values of CMC appear the same at 13 and 20°C,suggesting the possibility of the presence of a minimum between these temperatures.Finding a fitting equation for experimental data not only allows to extrapolate CMC values at different temperatures,but also allows to derive the thermodynamics parameters of micellization: free energy(ΔG0m),enthalpy(ΔH0m),and entropy(ΔS0m).This can be done making use of the following known relations(Tennouga et al.,2015):
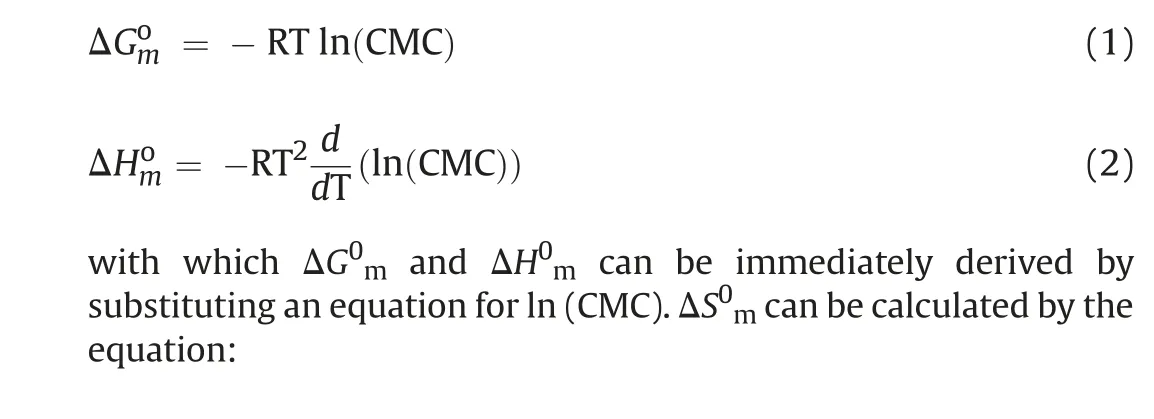

Fig. 2. The schematic representation of QCM-D adsorption testing sequence shows that all experiments start with a set zero frequency and the frequency shift Δf indicates the adsorption of chemicals to the surface.

The obtained results for these quantities are plotted against temperature in Fig. 3b. The range of obtained values (order of few tens of kJ/mol above and below zero)are in line with the previous literature(Tennouga et al., 2015). Results of the derivation show that ΔG0mis negative and effectively constant in the investigated temperature range, suggesting that micellization is a spontaneous process driven by approximately the same variation of Gibbs free energy. Although the values of ΔG0mare almost constant, large changes can be seen occurring in the ΔS0mand ΔH0m. Considering first entropic variations(plotted as-TΔS0m,so with inverted sign),the micellization process appears to have ΔS0m» 0 at low temperatures, but decreasing with temperature even reaching values of ΔS0m<0, suggesting that micellization is a more ordering process at higher temperature. Considering enthalpic variations, values of ΔH0mare positive at low temperatures and negative at higher temperatures, which signifies that micellization goes from being endothermic to exothermic, as found in many surfactant systems(Opatowski et al., 2002).
It was a cool, gray day outside, and a light rain was falling. I grew wearier as I scurried2 around, trying to care for each child: thermometers, juice, diapers. And I was fast running out of liquids for the children. But when I checked my purse, all I found was about $2.50 -- and this was supposed to last me until the end of the month. That’s when I heard the phone ring.
Considering that the spontaneity of a process is given by ΔG0m< 0, it can be assessed that the process is driven by the contribution of the more negative term between ΔH0mand -TΔS0m. Analyzing in these light the obtained results, it appears that the micellization process is entropy controlled(driven by entropy gains, i.e. disordering of the system) at low temperatures,while is also enthalpy controlled (driven by enthalpy gains, i.e.formation more favorable interactions in the system).From the plot of these thermodynamic quantities, it can be noticed that the contributions of ΔH0mand -TΔS0mequate each other at approximately 63°C, which is therefore believed to be where the two contribution overlap and switch dominance in the micellization process.
A proposed interpretation in light of the physics of the micellization process follows: at low temperatures, the dominating disordering of the system upon micelle formation could be seen as arising from a high order of the system without the formation of micelles, possibly given by the ordering of the water molecules around the free surfactants. With increasing temperature, this order becomes more disrupted and therefore the entropic gain in micelle formation decreases, up to the point where the surfactant in the micelle constitutes a more ordered system than the free surfactant surrounded by water. The enthalpic gain balancing the entropic loss at high temperatures is also probably to be attributed to a contribution of the hydrophobic tails: the ionic heads, in fact,see an increasing electrostatic repulsion due to higher counterion dissociation, and their interaction appears therefore to be less favorable.Given this reasoning,the enthalpic favorability is likely to arise from a less favorable water-tail interaction and a more favorable tail-tail interaction at high temperature.Ultimately,given that the change in the dominant contribution to the process favourably appear to occur above 60°C,the highest temperature of interest in the present study, the micellization process will be considered to be mainly entropy-driven in the tested temperature range.
3.2. Temperature effect on the AAS and AAS/IOS adsorption
We have investigated the adsorption of AAS at a concentration of 0.15 wt% (far above its CMC) in 50 mM Ca2+, and in 50 mM Ca2++100 mM Na+solutions, both at pH 7 and 9.5. The temperature ranged from 20 to 60°C, with 10°C intervals. As shown in Fig. 4a, it can be seen that all AAS solutions show little or no adsorption at low temperatures, followed by a sharp increase,occurring in the following order:

Fig.3. (a)Variation of the CMC of AAS as a function of temperature.(b)Thermodynamic quantities ΔG0m,ΔH0m,and-TΔS0m as a function of temperature derived from the fitting of the CMC vs temperature data for AAS surfactant.
- At high pH of 9.5, in the absence of monovalent cations (pink curve);
- At high pH of 9.5, in the presence of monovalent cations (red curve);
- At low pH of 7,both in the absence and presence of monovalent cations (light blue and blue curves).
In other words, at a given temperature (below 50°C), the amount adsorbed on the surface is decreasing in the same order as the items just presented.
The occurrence of adsorption in these systems can be explained through the cation bridging mechanism, which consists in the ability of a divalent cation of binding both to a negative SiO-surface site,effectively reversing its charge,and to the negative head group of the surfactant, while monovalent cations can only bind to the surface, but cannot give bridging to allow surfactant adsorption,therefore competing with the calcium ion and surfactant adsorption.At high pH and in the presence of only Ca2+,the silica surface has a high number of ionized sites exposed to the solution,to which the calcium ions can bind to give bridging to AAS, which are consistent with previous observations(Liu et al. 2018, 2019b,2021b). In the presence of monovalent cations, part of the sites available for adsorption get occupied by Na+, which competes for adsorption with Ca2+but cannot give cation bridging. This is attributed to the fact that the relative binding energy in the presence of Ca2+was much larger than in the presence of Na+(Liu et al.,2021a). At lower pH, the number of deprotonated sites is lower,giving the least favorable conditions for adsorption.
It can additionally be noticed that solutions with the least favorable conditions for adsorption, the sharp increase occurs at 50°C, at which these solutions become cloudy due to the dehydration of alkoxy groups in the surfactant, similarly to the typical clouding behavior of non-ionic surfactants. A possible explanation of the two temperature coinciding is that the dehydration of alkoxy groups causing the formation of a second phase giving clouding could be the cause, at the same time, of an increased enthalpic favorability for the surfactant to go out of solution and adsorb on the surface.In regard to the magnitude of the frequency shift given by adsorption from clouded solution,it can be noticed that this shift is effectively the same as that given by the adsorption of nonclouded solutions, for instance the high pH solutions at 40°C.Given this, the possibility of a similarity between clouding and precipitation is to be excluded, as the latter gives a signal of Δf > 1000 Hz. Another strong point in support of this argument comes from the later testing of the IOS/AAS blend (Fig. 5), the adsorption of which has been investigated for both a non-clouded and clouded solution at the same free surfactant concentration,giving the same adsorption signal.
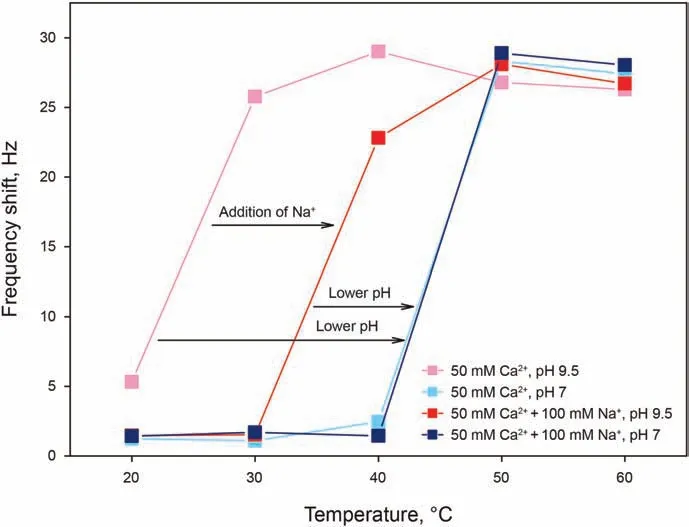
Fig. 4. Frequency shifts as a function of temperature for AAS adsorption at a concentration of 0.15 wt%in 50 mM Ca2+,and in 50 mM Ca2+and 100 mM Na +solutions,both at pH 7 and 9.5.
IOS/AAS solutions have been investigated at a concentration of 0.05 wt%in 50 mM and 20 mM Ca2+solutions,both at pH 7 and 9.5.Analyzing the results presented in Fig. 5, it can be noticed that for this surfactant blend with a lower amount of Ca2+and at a lower pH of 7 (blue curve) showed negligible adsorption, whereas all other conditions show high and approximately constant adsorption throughout the entire temperature range. The absence of adsorption at 20°C is again identified in the least favorable conditions for adsorption,namely a low number of deprotonated sites due to the low pH and a low cation bridging possibility due to a low concentration of calcium ions. However, it is relevant to point out that neither of two factors, low Ca2+concentration and low pH, is by itself sufficient to prevent adsorption from occurring. This can appear as counter-intuitive,as only one of the two factors could be expected to be sufficient to limit adsorption: with a limiting low concentration of Ca2+, an increase in pH and number of ionized sites would be expected to not be relevant, as the cation bridging mechanism is limited by the concentration on the calcium ions;with a limiting low number of ionized sites on silica, an excess of calcium should not make a difference once all silica sites are bonded to the calcium ions. A possible explanation for this phenomenon could be that although more calcium ions are available in solution these are not bonded to the surface due to a low charge of the silica surface, making the calcium less attracted to the surface and the formation of calcium-surfactant complexes in solution more favorable, therefore also limiting the amount of surfactant available for adsorption. Finally, comparing the IOS/AAS results to the ones from AAS,a tendency of the former towards the adsorbed state could be explained by the absence of alkoxy groups in IOS,making the surfactant less favorable in the dissolved state.
In light of all results for the adsorption of AAS and AAS/IOS, an explanation for the observed temperature effect is proposed.When surfactants are above the CMC, an increase in temperature gives rise to an increase of monomer concentration in solution,implying a shift of the adsorption equilibrium towards the adsorbed state,therefore countering the effect of temperature itself of shifting the equilibrium towards the desorbed state. The increase of temperature (entropic effect) and the increase of monomer concentration on adsorption represent,therefore,two opposing driving forces.For species above the CMC and showing adsorption which is high at ambient temperature, adsorption slightly decreases or is approximately constant with increasing temperature. The presence of adsorption at ambient temperature is justified by the favorability of adsorption in case of absence of monovalent cations (no competitive adsorption preventing cation bridging),higher divalent cations concentration (higher cation bridging), higher pH (higher number of adsorption sites),or lower concentration of alkoxy groups in the surfactant (lower stabilization in solution). The increase in CMC with temperature can be though to counter or suppress the adsorption decrease with temperature observed for species tested below CMC or with no CMC.
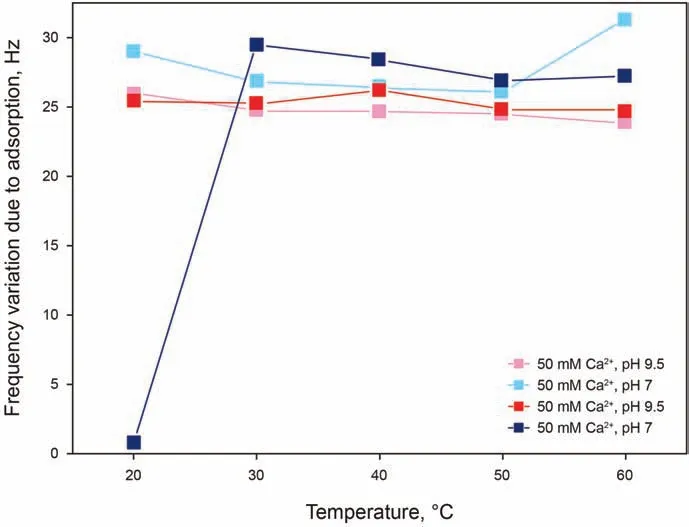
Fig. 5. Frequency shifts as a function of temperature for 0.05 wt% IOS/AAS adsorption in 50 mM and 20 mM Ca2+ solutions, both at pH 7 and 9.5.
For species tested above the CMC and showing little or no adsorption at ambient temperature followed by a large increase in adsorption, interpretation of results become more complex. The negligible adsorption at ambient temperature is an indication that adsorption is not favored at the given conditions of low temperature. The conditions follow again an expected trend, with adsorption being less favorable in case of presence of monovalent cations(competitive adsorption,not giving cation bridging),lower divalent cations concentration (lower cation bridging), lower pH (lower number of adsorption sites), or higher concentration of alkoxy groups in the surfactant(higher stabilization in solution).The same order of favorability of adsorption given by these parameters is respected with the increase of temperature in the range of increased adsorption with temperature, and follows therefore the same reasoning.However,the reason for the increase itself is more dubious;this could be explained by the predominance,in the lower temperature ranges,of the effects of the increase of the CMC with temperature, possibly also along the increase of the number of adsorption sites, shifting the equilibrium towards the adsorbed state more than the increase of temperature itself would shift the equilibrium towards the desorbed state.
All these explanations presented so far concern only thermodynamic considerations on the system. Considering the overall shape of the adsorption isobars (adsorption vs temperature),adsorption processes are subject to kinetic control at low temperatures.It would signify that at low temperature,when adsorption is absent,an energy barrier for adsorption is present,and the thermal energy of the system is not sufficient to overcome it until the temperature is raised sufficiently. This interpretation is very attractive as it allows as simple explanation of results well in line with that proposed for species not showing the increase. In fact,once the kinetic barrier is overcome, the thermodynamic control would be the same as explained for all other species, explaining a slight decrease of adsorption due to the effect of temperature on an exothermic process and mitigated by the increase in CMC and concentration in solution.However,this kinetic interpretation faces two major shortcomings. The first lies in the fact that the energy barrier, which in these systems would have no reason to be considerably different for the solutions which vary only for their pH or salt concentrations, is passed at considerably different temperatures (for instance, for AAS in 50 mM Ca2+, 30°C for pH 9.5 and 50°C for pH 7). The second is given by the contrast of the interpretation with the kinetic information accessible from QCM results.In fact, if kinetics were limiting, a curve characteristic of slow adsorption could be expected at the first temperature at which adsorption starts to show.However,this has not been observed for the tested solutions. For these reasons, although the kinetic explanation is possible,the thermodynamic one is considered more likely, even though less simple.
3.3. Temperature effect on the alkalis and AAS/alkalis adsorption
Organic alkalis of MEA and TEA have been investigated in presence of 50 mM Ca2+, while precipitation occurring with the addition of inorganic alkali of Na2CO3in presence of Ca2+does not allow insightful QCM-D testing,and is therefore measured without Ca2+. The pH of all solution has been adjusted to 9.5 for comparability of the fundamental adsorption behavior under the same surface conditions. Here, 29 mM is the concentration of TEA required to bring a 50 mM Ca2+solution to pH 9.5.A concentration of 1 mM has been noticed to be too low for all selected alkali to give an adsorption signal, which becomes more marked the higher the concentration. Fig. 6 shows that MEA is characterized by a lower adsorption than other alkali,since its adsorption at 29 mM is absent at all temperatures, and gives a significantly lower frequency shift at 160 mM.When assessing the tendency of the molecule to adsorb,it has also to be kept in mind that TEA has a molecular weight approximately 2.44 times larger that of MEA, and therefore the frequency shift has to be corrected by this factor to relate the shift to the number of adsorbed molecules.Even after this correction,for instance at 20°C,frequency shifts of 7.1-17.3 Hz for TEA compared to 0-4.5 Hz for MEA,a larger number of TEA molecules adsorb on the surface, hinting indeed at a lower tendency of MEA to adsorb.Overall,looking at the effect of temperature on all adsorbing alkali,adsorption appears to be sharply and monotonically decreasing with temperature.
Nest, we examined the effect of alkalis addition on the adsorption of 0.15 wt% AAS. Adsorption results of all these solutions are presented in Fig.7,also showing the sum of the separated shifts of the surfactant and alkali solutions, in order to compare with the shifts from the solutions containing both the surfactant and an alkali. Although results for solution containing both AAS and an alkali (red curve) do not show a common trend, their results become insightful when compared to the adsorption behaviours observed for AAS and alkali separately. Considering first solutions containing MEA,the alkali only solution does not give a frequency shift (blue curve), and for this reason, the curve representing the adsorption of the solution containing only AAS overlaps with that representing the sum of the two separate adsorptions (purple dotted curve with squares).Comparing this last curve with the one representing the adsorption of the AAS and MEA solution (red curve with squares),important conclusions can be drawn.At 20 and 60°C,the AAS and MEA solution is visibly more adsorbing than the sum of the AAS solution and MEA solution contribution, which suggests a synergistic interaction between the molecules further favouring their adsorption. At 40°C, this difference is not visible and adsorption is effectively the same as the sum of the contributions; this could be explained by noticing that AAS adsorption is already at its maximum at this temperature,and no higher value of adsorption is detected, possibly suggesting the saturation of the surface and the instability of a thicker adsorbed (multi)layer.
Similar conclusions to those described for AAS and MEA can be drawn also for AAS and TEA, with the main difference being that TEA alone shows an adsorption shift greater than zero.Comparing the sum of the separated AAS and TEA adsorption shifts (purple dotted curve with circles) with the adsorption of the AAS and TEA solution(red curve with circles),a strong difference can be noticed at 20°C,hinting again at an enhancement of adsorption,while at 40 and 60°C the signal is approximately the same, or even slightly lower for the mixed solution.The only difference with MEA can be noticed if the adsorption at 40 and 60°C was competitive between AAS and TEA,which could find its explanation in a possible strong hydrogen bonding network of TEA excluding some AAS adsorption.
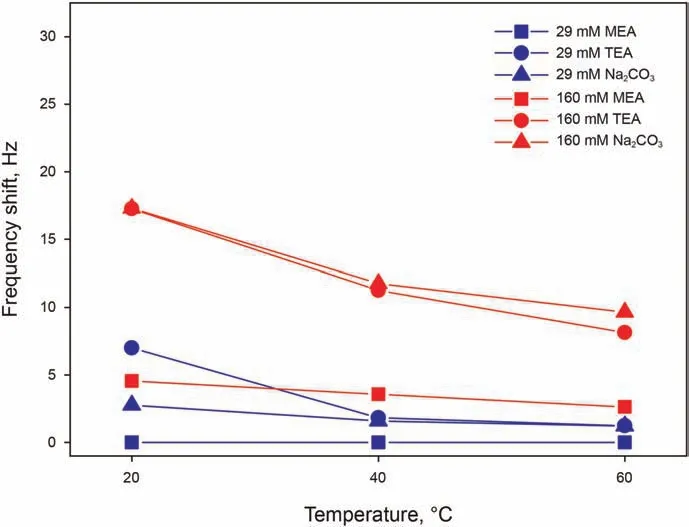
Fig. 6. Frequency shifts as a function of temperature for alkali solutions with 29 and 160 mM of MEA in 50 mM Ca2+,of TEA in 50 mM Ca2+,and of Na2CO3 in Milli-Q water,all at pH 9.5.
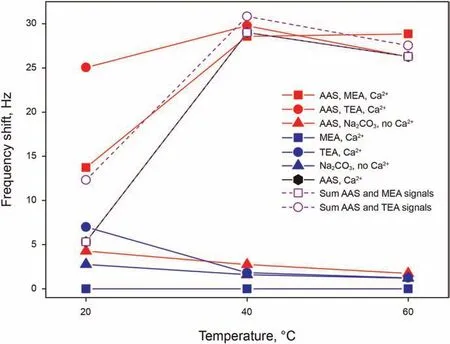
Fig. 7. Comparison of frequency shifts as a function of temperature for solutions of 0.15 wt% AAS in presence of 29 mM MEA in 50 mM Ca2+, of 29 mM of TEA in 50 mM Ca2+, and of 29 mM Na2CO3 in Milli-Q water, the same solutions without AAS, and in 50 mM Ca2+, all at pH 9.5.
The case of AAS and Na2CO3differs from the two previous given the different nature of Na2CO3and the absence of Ca2+.In this case,the curve representing the adsorption of the AAS and Na2CO3solution (red curve with triangles), has the same trend and very similar values of frequency shift as the curve representing Na2CO3alone.This suggests that,given the absence of divalent cations,the only contribution to adsorption is given by Na2CO3even in the solution containing also AAS, resulting as an additional proof that monovalent cations are not able to give cation bridging. The small difference that can be noticed between the curves,if not negligible,could be arising from a small increase in viscosity and/or density of the solution containing the surfactant with respect to the alkali only solution, which would then also account for the reason why this difference becomes even smaller at higher temperatures. The AAS + Na2CO3adsorption results obtained in absence of Ca2+are important also for considerations on the adsorption of solutions containing Ca2+, which cannot be measured directly because of precipitation. The precipitation occurring with the addition of Na2CO3in presence of Ca2+signifies,in fact,a sequestration of Ca2+from the solution, while Na+stay dissolved, therefore creating a solution of low Ca2+concentration and high Na+concentration,which should allow little to no AAS adsorption, similarly to the presented results.In this case,therefore,the alkali could be used to decrease surfactant adsorption.
3.4. Adsorption calculations and modeling
This section is dedicated to the modelling of the properties of the surfactant adsorbed on the silica surface,in terms of the mass,thickness, and number of adsorbed layers. The typical AAS adsorption in the presence of 50 mM Ca2+, pH 9.5, at 30°C, as it gave particularly stable signals for all overtones and dissipation curves,and therefore allows to obtain more accurate results for the modelling.In Fig.8,a significant spreading of frequency overtones and dissipation curves can be noticed,immediately suggesting that the adsorbed layer is not rigid, but viscoelastic (section 2.3). For different overtones,the observed frequency shifts were similar and increased with increasing overtones.As for the Voigt model,all the overtones (1-13th) were applied to derive the adsorbed mass and layer thickness. Modelling of the layer has been performed at varying values of different assumed parameters, finally chosen as the ones giving the best fit of data. First, the initial state of the sensor before adsorption,to be used as a reference free oscillation,is chosen as the salt-only solution. Second, the bulk liquid has a reference density of 1000 g/L. Additionally, multiple densities assumed for the adsorbed layer gave the same(low)error in fitting data, and are therefore all considered plausible. Following these assumptions, adsorbed surfactant layer has been modelled with very low error of χ2= 0.01, indicating a good fit with the Voigt model. Thus, the surfactant adsorption layer is considered to be a soft layer, with adsorbed mass per unit area madsorbedof 1310 ng/cm2, density ρlayerranging from 1200 to 1000 g/L, and thickness hlayerranging from 11.0 to 13.0 nm.
Based on the obtained results, it is possible to estimate the number of layers in which the surfactant is arranged on the surface.One possible way of estimating the number of adsorbed layer is to compare the number of molecules occupying an ideal monolayer per unit area, nmonolayer, starting from the surfactant head group area,a,with the number of molecules occupying the sensor per unit area, nadsorbed. The sulfate head group area of AAS is taken here to be 0.42 nm2/molecule,from data the sulfate head group area of SDS in a monolayer in presence of 100 mM monovalent counterion(Nakahara et al.,2011).The adsorbed mass amounts to 1310 ng/cm2and AAS has a molecular weight of 700 g/mol. From these values,it can be calculated that nmonolayer=2.38×10¹⁴molecules/cm2, nadsorbed= 1.13 × 10¹⁵molecules/cm2, and therefore the number of adsorbed layers is approximately 5. It is to be noted,however,that this method is very much subject to variation owing to the estimation of the value of the head group area of the surfactant. The number of layers is believed to be overestimated,because a higher salt concentration is present in the used solution due to pH adjustments and because this approach does not take into consideration that if a higher density of favorable adsorption sites is present,molecules could adsorb closer than the head group area they show in a monolayer at the air-water interface,since this value is higher than the physical size of the head group. Additionally, smaller values of the head group area are often reported,which would signify a higher number of molecules per monolayer,and therefore a lower number of layers. Another source of overestimation lies in neglecting the contribution of the calcium ions mass in the adsorbed layers, which is present to allow cation bridging between two layers attaching from the head groups.
A second way to estimate the number of adsorbed layer is to compare the number of silanol site density on the silica surface,nOH-, under the assumption that this is the same as the number of adsorbed molecule in a monolayer, nmonolayer, with the number of molecules occupying the sensor per unit area, nadsorbed, as presented in the previous method. The two starting values for this approach are, therefore, an approximate number of 5 sites/nm2(Ashtekar et al., 2000; Dias Filho and Do Carmo, 2006; Zhuravlev and Potapov, 2006), and the calculated 1.34 × 10¹⁵molecules/cm2,from which the number of adsorbed layers is approximately 2.This method is believed to be very sensitive to the chose input of sites density due to the relatively large range of values that can be found in the literature.If a more accurate value was to be found for the specific silica sensor used in the specific solution,this could be an accurate estimation method.However,an implicit assumption in this method is that all adsorption sites are occupied, with a 1:1 surfactant to site ratio,which could not be realistic due to crowding of the surface,and which could therefore lead to overestimation of the number of molecule per monolayer and underestimation of the number of layers. It could be attributed to that the number of adsorption sites method leads to the lowest estimated number of layers. Additionally, like in the previous method, a small source of overestimation can arise from neglecting the calcium ions adsorbed mass in multiple layers.
A third method to estimate the number of adsorbed layers is to compare the thickness of one monolayer, approximated by the length of the tail of the surfactant, ltail, with the thickness of the modelled adsorbed layer, hlayer. The former is estimated to be approximately 2.84 nm,while the latter is considered to be 12 nm,from the average of the obtained range of 11-13 nm. From these values the number of adsorbed layer is approximately 4.Unlike the other two methods,this method uses more certain values as inputs,although it still relies on relevant assumptions.The obtained result is believed more likely to be an overestimation,and much less likely an underestimation, because it considers the surfactant tail to not be folded on itself,neglects possible tilting of the tails,and neglects the height occupied by the surfactant head groups and by the calcium ions.
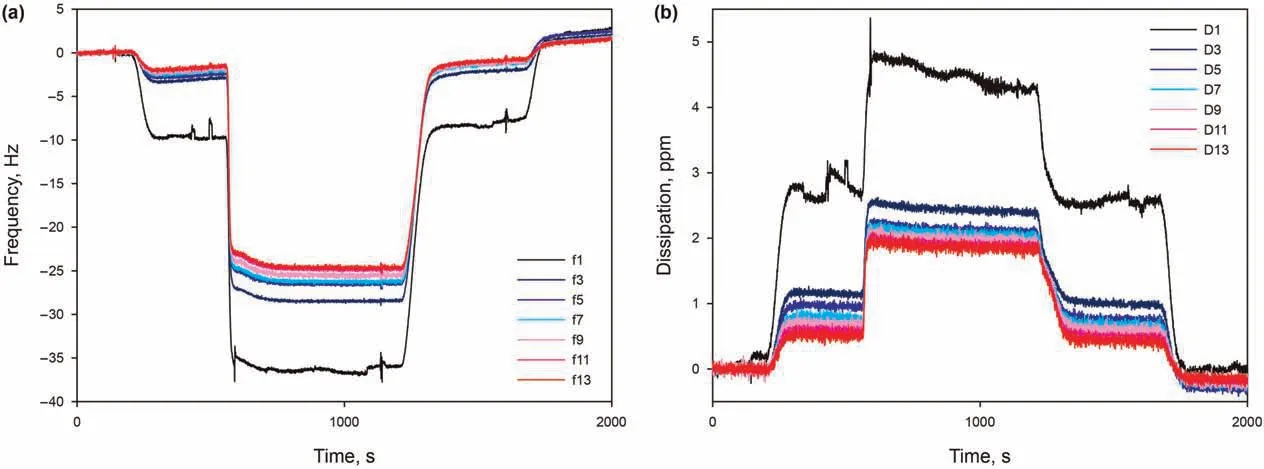
Fig. 8. (a) Frequency overtones and (b) the corresponding dissipation curves as function of time, from 0.15 wt% AAS in 50 mM Ca2+ solution at pH 9.5 and 30 °C.
Averaging the obtained results, and taking into account their likelyhood of under- or overestimation, the average number of adsorbed layer in the analyzed case is believed to be either 3 or 4.The most likely morphology of an anionic surfactant multilayer on silica is schematically represented in Fig.9.The layers lose order as they grow further from the surface, meaning that the first one or two layer can be ordered while a third and especially a forth would be more loose and disorganized, also with the possibility of the layering not being evenly spread throughout the surface but present in patches. Additionally, it is can be though to be thermodynamically more favorable for the adsorbed layers to expose the surfactants’ hydrophilic heads to the solution, instead of the hydrophobic tails, indicating that an even number of multilayers could be more likely. Finally, the discussed instability of the last layer(s)could also be an explanation for the reason why frequency shifts higher than approximately 28 or 30 Hz are never recorded(for surfactants with similar molecular weights and solutions with similar viscosity), since this shift value and this number of layers possibly represent the saturation of the surface and the instability of further layering.
4. Conclusions
Motivated by the issue posed by the loss of chemicals in EOR,we aim to provide better understanding of the involved phenomena when assessing flooding parameters and mitigation strategies.Thus,the effect of temperature on surfactant and alkali adsorption on silica surfaces was determined using QCM-D, through explaining different phenomena induced by the change in temperature,while also assessing the effects of the concentration of the mentioned species, monovalent ions concentrations, divalent ions concentration, and pH. The CMC of AAS was temperature dependent and can be quantitatively described by the thermodynamics parameters of micellization, showing a mainly entropy-driven process. Adsorption is more likely to occur for surfactant solutions in absence of monovalent cations(no competitive adsorption without cation bridging), higher divalent cations concentration(higher cation bridging), higher pH (higher number of adsorption sites), or lower concentration of alkoxy groups in the surfactant(lower stabilization in solution).Adsorption results of AAS and IOS/AAS demonstrate that the kinetic effect can be countered or suppressed by an increase of the CMC with temperature causing an increase in the amount of the species in solution, shifting the equilibrium back to the adsorbed state.
Adsorption results of alkalis suggest that,despite an increase in the number of adsorption sites, adsorption decreases with increasing temperature as it is an exothermic process.The presence of organic alkalis in a surfactant solution can enhance the overall adsorption of the species. On the other hand, the precipitation of CaCO3occurring with the addition of inorganic Na2CO3in presence of Ca2+suggests the sequestration of the divalent ions and the dissolution of monovalent ions, implying a possible decrease in surfactant adsorption.Modelling the typical AAS adsorption allows us to do the comparisons in terms of mass, thickness and viscoelastic properties of the adsorbed surfactants. The adsorbed AAS surfactant is a multilayer,with a number of layer ranging between 2 and 5,with the most likely case to be a compact bilayer followed by more disorganized and unstable further layering. Following this research and the realization that surfactant and alkali adsorption behaviors are strongly temperature dependant,temperature effects can be explored for different species and flooding variables,as well as remedial techniques. Additionally, given the wide screening already performed in this study, the large-scale testing of the examined solution in real systems could be conducted, also in relation to their ability to mobilize and recover oil.

Fig. 9. Schematic diagram of an adsorbed multilayer, exemplified by the case of three layers through cation bridging and tail-tail (hydrophobic) interactions.
Acknowledgments
The authors thank Dr. Mark Brewer, Dr. John van Wunnik, and Dr. Dirk Groenendijk (Shell Global Solutions) for their active discussions and careful corrections. Technical assistance from Mr.Duco Bosma of TU Delft is highly appreciated. This work was supported by the Shanxi Provincial Key Research and Development Project(No.20201102002),Science Foundation of China University of Petroleum, Beijing (No. 2462020BJRC007, 2462020YXZZ003),and State Key Laboratory of Petroleum Resources and Prospecting,China University of Petroleum(No.PRP/DX-2216),and Shell Global Solutions.
杂志排行
Petroleum Science的其它文章
- Primary logistics planning of oil products under the imbalance of supply and demand
- Advances in enhanced oil recovery technologies for low permeability reservoirs
- A novel method of quantitative evaluation and comprehensive classification of low permeability-tight oil reservoirs: A case study of Jidong Oilfield, China
- Measurement of pore diffusion factor of porous solid materials
- Catalytic oxidation of pentanethiol on basic nitrogen doped carbon hollow spheres derived from waste tires
- Effects of modified graphene oxide (GO) nanofluid on wettability and IFT changes: Experimental study for EOR applications