Measurement of pore diffusion factor of porous solid materials
2022-09-23JinToGuoQinWeiShengLiChenWeiSunTingTingFnMingRiXuChngChengZhng
Jin-To Guo , Y-Qin Wei , Sheng-Li Chen , Wei Sun , Ting-Ting Fn ,Ming-Ri Xu , Chng-Cheng Zhng
a State Key Laboratory of Heavy Oil Processing, and Department of Chemical Engineering, China University of Petroleum-Beijing, Beijing,102249, China
b Petrochemical Research Institute of PetroChina Company Limited, Daqing,163000, Heilongjiang, China
Keywords:Porous materials Well-defined and uniform pore structure materials Internal diffusion Diffusion factor Tortuosity
ABSTRACT Internal diffusion of molecules in porous materials plays an important role in many chemical processes.However, the pore diffusion capacity of porous materials cannot be measured by conventional catalyst characterization methods. In the present paper, a pore diffusion factor, the ratio of the diffusionconstriction factor to the pore tortuosity of the porous materials, was proposed to measure the diffusion ability of pores inside solid materials,and a method was proposed for measuring the diffusion factor using a well-defined and uniform pore size material as a reference. The diffusion factor was calculated based on the effective diffusion coefficients and the diffusion-constriction factor and pore tortuosity of the reference porous materials. The pore diffusion factor measurement can be performed at room temperature and atmospheric pressure. The pore diffusion factor of conventional porous materials was found to be much smaller than 1,indicating that there is a lot of room for improving the diffusion ability of the conventional catalysts and adsorbents, and could be significantly increased through adding small number of fibers into the conventional porous materials as template.
1. Introduction
Internal diffusion of molecules in porous materials plays an important role in many chemical processes, such as adsorption processes (Neves et al., 2021; Rao et al., 2021), solid catalytic reaction processes(Peng et al.,2020;Chen et al.,2007).In the case of adsorption processes, the adsorption rate is usually controlled by the internal diffusion rate of molecules in porous materials. For solid catalytic reaction process,when the diffusion rate of reaction molecules in catalyst pores is smaller than the reaction rate, the overall reaction rate is controlled by internal diffusion and can be improved by increasing the diffusion rate of reaction molecules.Actually, many catalytic processes are controlled by catalyst internal diffusion. For example, the hydrogenation of heavy oil is a typical reaction process controlled by diffusion within the catalyst(Absi-Halabi et al.,1995; Li et al.,1995). As a consequence, it is of wide and great significance to study the pore diffusion factor of porous materials.
Effective diffusion coefficient(De)is usually used to measure the diffusion ability of molecules inside porous materials. The Deof a molecule in porous materials can be expressed as(Fogler,2006)Eq.(1)

It seems that Decan be easy calculated using Eq.(1).Actually,it's not the case,because both f and τ are very difficult to be accurately measured. It is generally accepted that f is related to the ratio of diffusion molecule's size to the diameter of pores (Renkin, 1954;Wang et al., 2014; Beck and Schults, 1970). Because the conventional catalyst is not uniform in pores, containing a variety of different sizes and shapes of pores,and what is more,the pore size has significant effect on the effective diffusion coefficient (Chen et al.,1994; Chang et al.,1998; Kobayashi et al.,1987), hence the f of conventional catalysts is actually almost immeasurable and unknowable. So is the tortuosity τ.
There are mainly three methods for measuring the tortuosity τ,namely the steady state method (Gao et al., 1997a), the dynamic diffusion method, also known as SPSRM chromatography (Gao et al., 1997b), and the pressure gradient method (Wyllie and Gregory,1955). However, one cannot obtain the accurate value of τ by these methods.
In the steady-state method,the diffusion in porous materials is carried out in a diffusion pool(Gao et al.,1997a).The diffusion pool is divided into an upper(or left)diffusion chamber and a lower(or right) diffusion chamber, separated by the porous materials to be tested. The upper diffusion chamber and the lower diffusion chamber are purged with two different gases in a certain flow rate,and the gas components are diffused through the catalyst pellet from one diffusion chamber to another.The Deand τ of the catalyst can be obtained by analyzing the composition of the gas flowing out of the two chambers. In this method it is assumed that the porous materials have a uniform pore size,and that the all pores are cylindrical and connected to the surface of the porous materials.In fact,the pore size of the porous materials is not uniform(there are large pores and small pores),and the pores of the porous materials have random shape,not cylindrical,and some of the catalyst pores are not connected to the surface of the catalyst. Therefore, the tortuosity τ cannot be accurately measured by the steady-state method.
For the dynamic diffusion method(Gao et al.,1997b),in order to measure the pore tortuosity,the porous materials are loaded into a column in a string, and tracers are injected into the column at different carrier gas flows. Adsorption and desorption occur when the tracer flows through the column with carrier gas.The effective diffusion coefficient is calculated according to the broadening of the tracer chromatographic peak, and then the pore tortuosity is calculated. This method also assumes that the pore size of the porous materials is uniform, and that the pore of the catalyst is cylindrical. However, the pore size of the actual catalyst is neither uniform nor cylindrical, so the measured pore tortuosity is also unreliable.
In the pressure gradient method (Wyllie and Gregory, 1955;Comiti and Renaud, 1989), the pressure drop generated by the liquid flowing through the porous materials to be tested is measured to determine the pore tortuosity. The larger the pore tortuosity, the greater the pressure gradient. This method is only valid for measuring the pore tortuosity of through-pores and largepore materials; hence it cannot be used for measuring the pore tortuosity of conventional porous materials,which has a variety of different sizes and shapes of pores.
As a conclusion, because the pores of conventional porous materials are not fully connected, nor uniform in diameter, and the pore structure is different from one site to the other in the porous materials,both the constriction factor and the tortuosity of porous materials are immeasurable.
Here in this paper,the constriction factor and the tortuosity are lumped into one factor,called the pore diffusion factor(β),and it is set to equal to f/τ. We measured the β of several conventional porous γ-Al2O3by determining the effective diffusion coefficient of porous γ-Al2O3and comparing it with that of a reference porous material which has well-defined and uniform pore size. The pore diffusion factor of conventional porous γ-Al2O3was found to be much smaller than 1, indicating that there is a lot of room for improving the diffusion ability of the conventional porous materials, and could be significantly increased through adding small number of fibers into the conventional porous materials as template.
2. The theory of measurement of the pore diffusion factor
For the reference porous material, Eq. (1) becomes,

Where, De0, ε0, f0and τ0are the effective diffusion coefficient, the porosity, the diffusion-constriction factor and the tortuosity of the reference porous material, respectively.
The reference porous material was fabricated through ordered packing of monodisperse silica spheres (Face-centric cubic (FCC)structure).Because the monodisperse silica spheres is uniform,the pore structure of the reference porous material is uniform and well defined.By using large silica spheres,we can increase the pore size of the reference porous material.When the pores are large enough,the diffusion of molecules in pores reaches free diffusion or bulk diffusion,so that the diffusion-constriction factor f0would be equal to 1. Because the pore's structure of the model catalyst is well defined,the pore tortuosity can be calculated geometrically,and it was found to be π/2 for the opal materials (Sun et al., 2019). The pore's tortuosity of porous materials formed through packing of spherical particle was also obtained by pressure drop measurements (Comiti and Renaud,1989), and it was found as follows,
As long as a well-defined and uniform pore size material is used as a reference material,we can obtain the pore diffusion factor of a porous materials by measuring their effective diffusion coefficients.It's important to point out that the calculation of β is independent of DB.The Deand De0may vary with temperature,while their ratio(De/De0) is independent of temperature. That is, the effective diffusion coefficient measurement does not need to be carried out under the actual operation(reaction or adsorption)conditions,but can be carried out at room temperature, making the β measurement much more convenient.
Dynamic adsorption-diffusion method was used to determine the effective diffusion coefficient of molecules in porous materials.Fig. 1 is a schematic diagram of solute A diffusion in a spherical porous pellet.
Assuming the adsorption between A molecules in pore fluid and the molecules adsorbed on the pore surface of catalyst reaches its adsorption equilibrium,and the adsorption amount is proportional to concentration CAin pore fluid, we have

Where qAis the amount of A adsorbed on the surface of pores,mol/cm2; k is the coefficient of isotherm Eq. (5).
A diffusion model of molecule A in the spherical porous pellet is established based on the material balance (Sun et al., 2019).
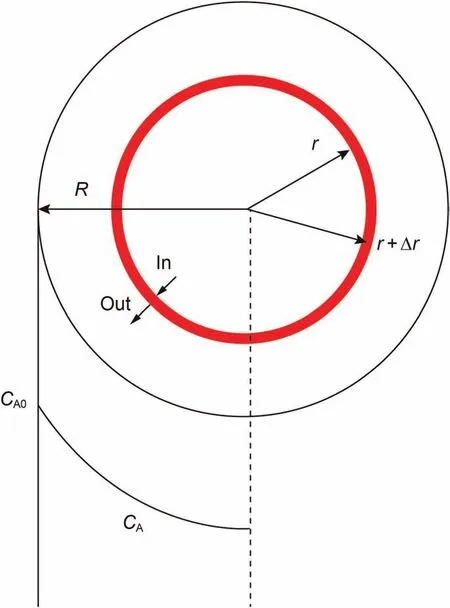
Fig.1. Schematic diagram of solute A diffusion in a spherical porous pellet.
The initial and boundary conditions for Eq. (8) are rewritten as Eq. (9):
The partial differential Eq. (8) with boundary conditions of Eq.(9) can be solved by numerical method. The effective diffusion coefficient Decan be obtained through optimizing the parameter Dein Eq. (8) by using MATLAB software.
3. Experimental
3.1. Materials
Dibenzothiophene (DBT), n-octane, 1,3,5-tritoluene, ethylorthosilicate (TEOS), aqueous ammonia and methanol used in this work were all pure reagents.Soft wood fibers,the average diameter and length of which were~24 μm and ~1.8 mm respectively, were obtained from a paper factory.
3.2. Conventional porous solid materials
Alumina (γ-Al2O3) is one of the most widely used catalyst supports and adsorbents,therefore it was used as the conventional porous solid materials here in this paper. Four kinds of γ-Al2O3pellets were used as porous materials, which were prepared by adding the soft wood fibers into a same γ-Al2O3powder during catalyst forming.The fibers were removed from the γ-Al2O3pellets through calcination of the samples at 550°C for 3 hrs.The γ-Al2O3pellets prepared using 1.0 wt%, 2.0 wt%, and 3.0 wt% fiber as template were designated as Al2O3-1%F, Al2O3-2%F and Al2O3-3%F respectively.The controller sample without any fiber template was designated as Al2O3-0%F.
3.3. Preparation of the reference porous material
Firstly, the 300 nm monodisperse silica spheres were synthesized through hydrolysis and condensation of TEOS using the silica sol(Ludox,AS-40)as seeds via seeded growth method(Chen et al.,1996; Chen, 1998). Then silica opal materials were fabricated through ordered packing of the monodisperse silica spheres in a beaker under the gravity force. After that, the silica opal materials were calcined at 700°C for 2 h to solidify the silica opal materials.Finally,solidified silica opal materials were hydrothermally treated at 180°C for 5 h to hydroxylate the silica surface.In order to convert the SiO2surface into Al2O3surface, the silica opal materials were put into 25% Al(NO3)3aqueous solution at 80°C for 12 h, rinsed with DI H2O, and calcined 500°C for 5 h. The Al2O3modification process was performed twice to completely convert the silica surface of silica opal materials into Al2O3surface. Because only 1-2 atomic layers of Al2O3were lain on the surface of the silica opal materials, the Al2O3-modified silica opal, i.e. the reference porous material, kept the silica opal's defined and uniform pore structure of its mother silica opal materials(Zhou et al.,2013).The reference porous material as prepared was designated as Al2O3/SiO2Opal.
3.4. Characterization of the porous materials
The BET specific surface area and pore size distribution of the porous materials were determined by low temperature N2adsorption-desorption method using ASAP-2420 physical adsorption apparatus at the temperature of 77 K. The pore volume of porous material was measured by water absorption method. The morphology of the catalyst was observed by using scanning electron microscope (SEM) of FEI Quanta200 F, with the operation acceleration voltage being 20 kV.
3.5. Measurement of effective diffusion coefficient
The adsorption solution, containing octane (50 wt%), 1,3,5-trimethylbenzene (50 wt%) and 2,6-dimethyl pyridine(1000 ppm)as the solvent,and DBT as the solute,was used for the diffusion experiments.The diffusion experiments were carried out at room temperature(25°C).
Above of all, the adsorption equilibrium equation (Eq. (5)) was obtained. A fixed amount of porous pellets was put into a beaker which containing enough adsorption solution so that the concentration kept unchanged after the adsorption, and then the beaker was vibrated on a shaker at 120 rpm.After the adsorption reached its equilibrium, the porous pellets were taken out of the beaker,washed with the solvent (50 wt% 1,3,5-trimethylbenzene, 50 wt%octane,1000 ppm 2,6-dimethyl pyridine)for several times,until all the DBT adsorbed was washed out of the catalyst pellets. The washing solvent was collected and the DBT concentration of it was determined by the UV-Vis spectrophotometry method using UV-1800s UV-vis spectrophotometer at wavelength 327 nm. The total amount of DBT washed out of the catalyst pellets minus the amount of DBT in the solution in the catalyst pores is the amount of DBT adsorbed on the surface of the catalyst pores. Five solutions with the DBT concentration being 1000 ppm, 3000 ppm, 5000 ppm,7000 ppm and 9000 ppm were used to obtain the adsorption equilibrium equation.

Fig. 2. The SEM image of the prepared porous γ-Al2O3
The diffusion solution containing 5000 ppm DBT was used for the measurement of effective diffusion coefficient.The procedures for determination of DBT adsorption take-up are similar to that of experiment described above for the determination of the adsorption equilibrium equation. A fixed amount of porous pellets was first saturated with the solvent, and then added into a beaker containing the diffusion solution. The beaker was vibrated on the shaker at 120 rpm,which is fast enough to eliminate catalyst pellet external diffusion resistance.A part of the porous pellets was taken out of the beaker at a desired time and washed with the solvent.The amount of DBT in the washing solvent was also measured by UV-Vis spectrophotometry method with the UV-1800s UV-vis spectrophotometer.
4. Results and discussions
Fig. 2 is the SEM image of the outside surface of the prepared porous γ-Al2O3pellets. It is clear that in comparison with the γ-Al2O3pellets formed without any template, the γ-Al2O3pellets prepared with 3.0 wt% fibers have large pores created by burning the fibers in theγ-Al2O3pellets. The pore structure characteristics,measured by the classic low temperature N2adsorption-desorption method at the temperature of 77 K, of all the prepared porous γ-Al2O3pellets are shown in Table 1,and the pore size distribution are shown in Fig. 3. It can be seen that although different amounts of fibers are used as template during the porous γ-Al2O3pellets forming, the characteristics of the obtained γ-Al2O3, including the pore porosity, pore volume, specific surface area and the pore size distribution,are almost identical to each other.Although the fibers used as template was less than 3.0 wt%, because the fibers having the length of about 1.6 mm can connect Al2O3pellets pores, the Al2O3pellets pores should be more communicated than that of the controller sample. Table 1 and Fig. 3 show that the classic low temperature N2adsorption-desorption method, almost the only method for people to characterize solid materials pore structure reported in literature, is not able to tell the difference in pore structure for the internal diffusion.
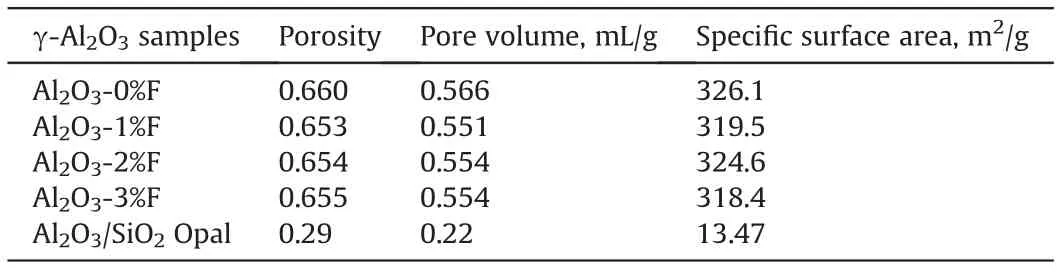
Table 1 The pore structure characteristics of the prepared the porous γ-Al2O3.

Fig. 3. Pore size distribution of the prepared porous γ-Al2O3 pellets.

Fig. 4. SEM image of the reference solid porous materials (Al2O3/SiO2 Opal).
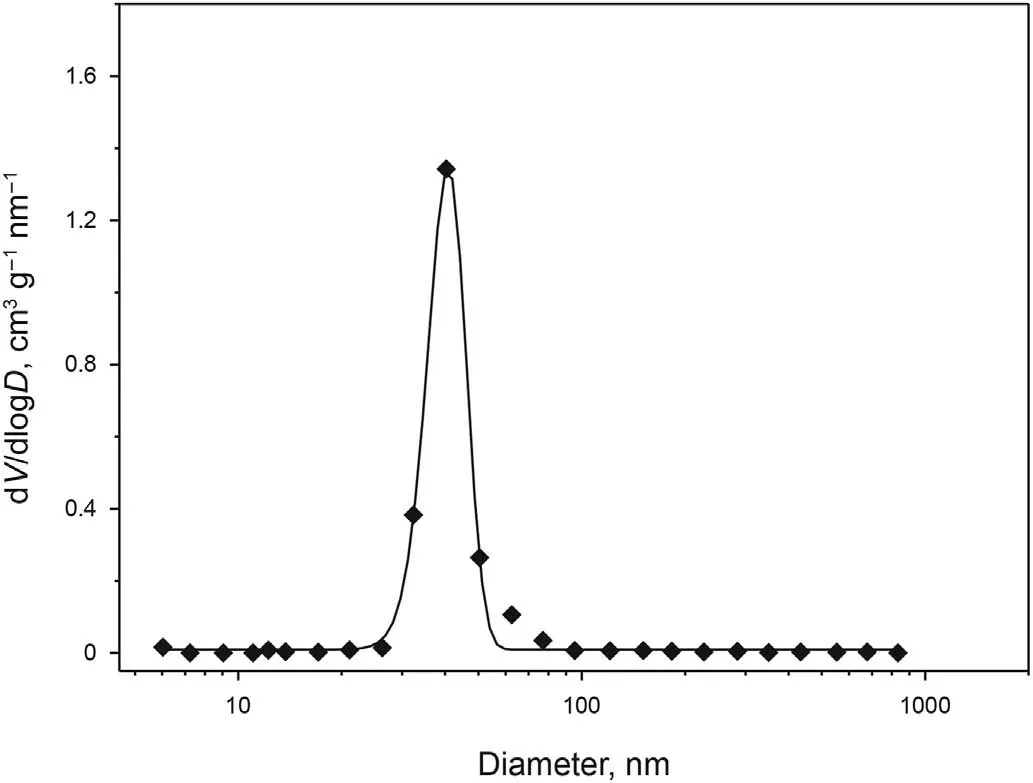
Fig.5. Pore size distribution of the reference solid porous materials(Al2O3/SiO2 Opal).
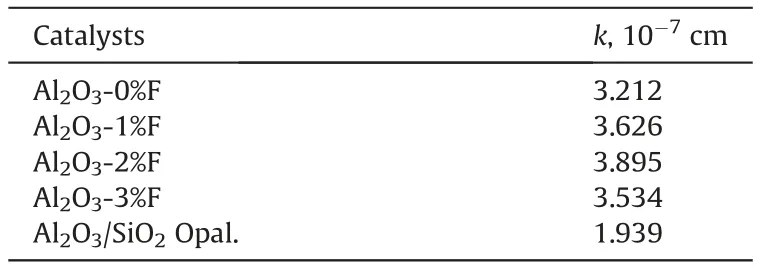
Table 2 The surface adsorption equilibrium constant (k) of Al2O3 pellets and the reference porous solid.
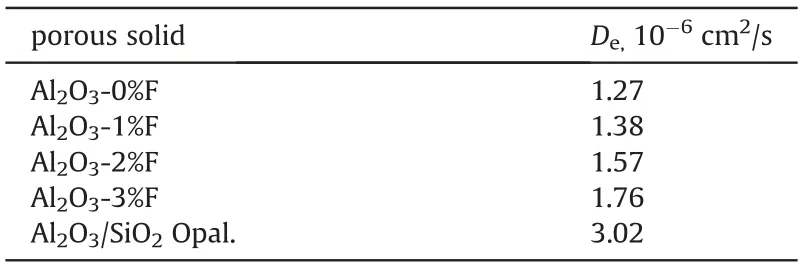
Table 3 The effective diffusion coefficient of porous solid pellets.
Fig. 4 is the SEM of the surface morphology of the Al2O3/SiO2Opal used as the reference solid porous materials. As shown in Fig. 4, the Al2O3/SiO2Opal pellets were composed of very uniform microspheres, and the pore structure of which should be welldefined and uniform. The pore size distribution obtained by low temperature N2adsorption-desorption, as shown in Fig. 5, shows that the Al2O3/SiO2Opal pellets was uniform in pore size. Because the pores inside the Al2O3/SiO2Opal pellets are the caves between the monodisperse microspheres ordered packed, these pores are fully communicated with each other and to the outside surface. In the contrary, many pores inside the conventional γ-Al2O3pellets cannot communicate to the outside surface, as was mentioned in the introduction.
Five solutions, with the DBT concentrations of 1000 ppm,3000 ppm,5000 ppm,7000 ppm and 9000 ppm,were used in this work to determine the surface adsorption equilibrium constant k in Eq.(5).The equilibrium adsorption amount of DBT on the surface of the porous γ-Al2O3was calculated by subtracting the amount of DBT in the solution in the pores from the total amount of DBT washed out of the porous γ-Al2O3pellets.The relationship between DBT amount adsorbed on the surface of porous Al2O3pores(q)and the solute (DBT) concentration (C) of equilibrium-adsorption solution in γ-Al2O3pores are shown by Fig. S1~~Figure S5 in Supporting Information.The surface equilibrium adsorption amount of DBT is linearly proportional to its concentration in adsorption solution, being consistent with the assumption made in the model derivation section 2.The surface adsorption equilibrium constant k is the slope of the line and summarized in Table 2 for different porous γ-Al2O3pellets.
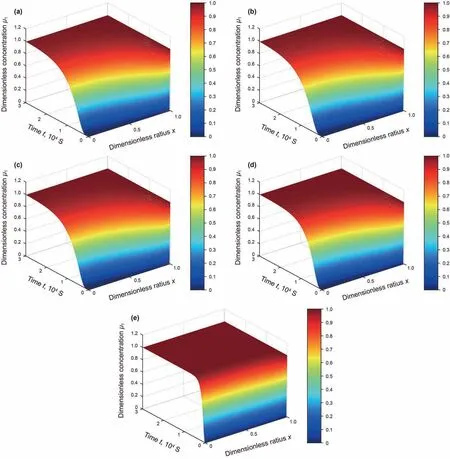
Fig. 6. The solute concentration distributions of the solution in porous solid pellets at different times((a)– Al2O3-0%F; (b)– Al2O3-1%F; (c)– Al2O3-2%F; (d)– Al2O3-3%F; (e)– Al2O3/SiO2 Opal).
Table 2 shows that Al2O3/SiO2Opal had different surface adsorption equilibrium constant k from the Al2O3pellets,indicating that notwithstanding the Al2O3-modified SiO2had similar surface acid properties to Al2O3(Zhou et al., 2013), they got different surface adsorption properties. Table 2 also shows that the Al2O3catalysts prepared using different amounts of fibers as template had similar k values.
The measurements of effective diffusion coefficient were performed using the diffusion solution with 5000 ppm DBT. The experimental adsorption uptake rate ((Mt/M∞)exp) was obtained through first measuring the uptake (Mt) at different times and the equilibrium uptake (M∞), and then calculating the Mt/M∞. The theoretical adsorption uptake ((Mt/M∞)calc) is calculated with Eq.(12)based on the numerical solution of partial differential equation of Eq. (8). The effective diffusion coefficient Dewas obtained through the parameter Deoptimization to minimize the sum of the squared difference between(Mt/M∞)expand(Mt/M∞)calc.That is,the Dewas obtained through solving following optimization problem.
The good agreement between (Mt/M∞)expand (Mt/M∞)calc(see Figure S.6~Figure S.10 in the Supporting Information)indicates the obtained Devalues are reliable. The Devalues of different porous solid pellets are listed in Table 3 and the solute dimensionless concentration distributions of the diffusion solution in porous solid pellets are shown in Fig. 6.
As shown in Table 3, the effective diffusion coefficient of the reference porous solid is much greater than that of conventional Al2O3, owing to its larger, less tortuous and more communicated pores than Al2O3.Although the pore structure parameters of Al2O3pellets obtained by N2-adsorption desorption method are very similar to each other (Table 1), their effective diffusion coefficient increased with the amount fibers used(Table 3),for the fibers made the Al2O3pellet's pores being more communicated as shown in Fig. 7.

Table 4The pore diffusion factors of different porous solid pellets.
The tortuosity of the model catalyst was calculated with Eq.(3)and was found to be 1.51,closing to the theoretical value of π/2(Sun et al.,2019).Based on the experimental data in Tables 1 and 3,the pore diffusion factor β values were calculated using Eq.(4)and are listed in Table 4.
The largest value of the pore diffusion factor β is 1, when the pore size is large enough(f = 1, for free diffusion) and the pore is straight(τ=1).Although the pores of the reference porous solid is large enough, owing to their bending, the model catalyst's β is smaller than 1. As shown in Table 4, the β of the conventional porous Al2O3is much smaller than 1 and smaller than that of the reference porous solid, indicating that there is lot of room for improving the diffusion ability of the conventional porous Al2O3.When small amount of fibers was used as template during porous Al2O3forming, although the low temperature N2adsorptiondesorption method cannot tell the pore structure difference, the pore diffusion factor β was increased significantly.
Our previous research works showed that when 3 wt%of fibers was used as the template during the forming of Al2O3catalyst support,the hydrodesulfurization(HDS)activity of MoNi/Al2O3was increased significantly(Chen et al.,2013;Fan,2019).Small amount fibers made the pores of HDS catalysts communicated and increased the internal diffusion ability of the catalysts,resulting in the high HDS activity of the catalyst.Those HDS experiment results can be well explained by the β values of the hydrodesulfurization catalysts. The β is a very useful parameter for the evaluation of porous solid materials internal diffusion ability.
5. Conclusions
Although there are many methods to characterize the pore structure of solid materials,no method can characterize or measure the internal pore diffusion ability of solid materials due to their ununiform pore size and the hardly measurable pore's tortuosity.A pore diffusion factor (β) was proposed to evaluate the diffusion ability of porous solid materials, and a method was proposed to measure the β using a well-defined and uniform pore size materials as a reference. The β measurement can be performed at room temperature and atmospheric pressure. The β can very well characterize the pore diffusion ability of porous materials.In addition,it was shown the β value of the porous materials was much smaller than 1, indicating that there is lot of room for improving the diffusion ability of conventional catalysts and adsorbents. Small number of fibers used as template in the porous material's forming could increase the pore diffusion factor significantly.
Acknowledgement
This research work was supported by the National Nature Science Foundation of China (Grant No: 91534120).
Appendix A. Supplementary data
Supplementary data to this article can be found online at https://doi.org/10.1016/j.petsci.2022.04.008.
杂志排行
Petroleum Science的其它文章
- Primary logistics planning of oil products under the imbalance of supply and demand
- Advances in enhanced oil recovery technologies for low permeability reservoirs
- A novel method of quantitative evaluation and comprehensive classification of low permeability-tight oil reservoirs: A case study of Jidong Oilfield, China
- Catalytic oxidation of pentanethiol on basic nitrogen doped carbon hollow spheres derived from waste tires
- Temperature effect on the dynamic adsorption of anionic surfactants and alkalis to silica surfaces
- Effects of modified graphene oxide (GO) nanofluid on wettability and IFT changes: Experimental study for EOR applications