Torque control strategy with V2X information for HEVs to minimize fuel consumption
2022-07-06YasutakaOkadaShunkiNishiiAkihiroTakeshitaKazukiHaradaYudaiYamasaki
Yasutaka Okada·Shunki Nishii·Akihiro Takeshita·Kazuki Harada·Yudai Yamasaki
Abstract Today, much information from traffic infrastructures and sensors of ego vehicle is available. Using such information has a potential for internal combustion engine vehicle to reduce fuel consumption in real world.In this paper,a powertrain controller for a hybrid electric vehicle aiming to reduce fuel consumption is introduced, which uses information from traffic signals,the global positioning system and sensors, and the preceding vehicle. This study was carried out as a benchmark problem of engine and powertrain control simulation and modeling 2021(E-COSM 2021).The developed controller firstly decides reference acceleration of the ego vehicle using the traffic signal and the position information and the preceding vehicle speed.The acceleration and deceleration leading to increase in unnecessary fuel consumption is avoided.Next,the reference engine,generator,and motor torques are decided to achieve the reference acceleration and minimize fuel consumption.In addition,the reference engine, generator and motor torques were decided by the given fuel consumption map for the engine, and by the virtual fuel consumption maps for the generator and the motor. The virtual fuel consumption is derived from the efficiency maps of the generator and the motor using a given equivalent factor,which converts electricity consumption to fuel for the generator and the motor.In this study,a controller was designed through the benchmark problem of E-COSM 2021 for minimizing total fuel consumption of the engine,the generator,and the motor.The developed controller was evaluated in driving simulations.The result shows that operating the powertrain in efficient area is a key factor in reducing total fuel consumption.
Keywords Powertrain optimization·Fuel consumption minimization·Hybrid electric vehicle·Speed following system
1 Introduction
There have been efforts to reduce carbon dioxide emissions all over the world to stop global warming caused by green-Shunki Nishii,Akihiro Takeshita,Kazuki Harada and Yudai Yamasaki have contributed equally to this work.house gases[1].In particular,in response to the large number of vehicles and their large overall carbon emissions,various technologies have been developed to reduce carbon dioxide emissions by reducing fuel consumption.Hybrid electric vehicles (HEVs) in particular are expected to make a contribution to reducing carbon dioxide emissions. HEVs are different from conventional internal combustion engine vehicles (ICEVs) in that they have a motor and a generator in addition to the engine as their power source. In addition,regenerative braking can reduce fuel consumption by recovering kinetic energy that ICEVs waste as frictional energy.Engines and motors have different efficient operating points,and fuel consumption can be reduced by using a more efficient power source depending on the situation[2,3].
However, HEVs consume fuel in the engine, as well as electricity in the motor and generate electricity in the generator.Since they use energy in different ways,it is not possible to directly compare their energy consumption. Therefore,using an equivalent factor to convert the electricity consumption of the motor to fuel consumption,it is possible to predict how to use the engine,the generator,and the motor to reduce fuel consumption to output the required torque by comparing the fuel consumption.
In addition, in recent years, connected and automated vehicle (CAVs) are developed that are connected to intelligent transport systems(ITS)and drive while recognizing the surrounding traffic conditions[4].CAVs obtain information on their surroundings through vehicle to vehicle communication(V2V),such as the inter-vehicular distance and speed from surrounding vehicles, and vehicle-to-infrastructure communication(V2I),such as the status and the remain time oftrafficsignals.Thesedays,variousvehiclecontrolmethods using V2V and V2I information are proposed[5-9].Among these control methods,the method of following the preceding vehicle while predicting its speed has been found to reduce fuel consumption.These research uses MPC,rule-based control,and optimal control[10-13].
There have been many studies on the causes of increasing fuel consumption of HEVs for example air drag,operating a powertrain in low efficient area[14-22].Among the studies,the method that compares the mechanical work of an engine and a motor to judge which is more efficient is proposed,and the method is clarified to be effective for minimizing fuel consumption[23].Therefore,the objective of this study is to clarify the effect of a fuel consumption minimization method using the equivalent factor on the fuel consumption of CAVs.
Anewcontrollerthatminimizespowertrainfuelconsumption using the equivalent factor was developed.The key factor of reduction in fuel consumption is operating powertrain in efficient area.The controller compares the fuel consumption of engine and converted fuel consumption of the motor.The car following strategy is used in this controller.The control method is simple and not novel,but the method of comparing the fuel consumption is novel.The effects of the controller on fuel consumption minimization were evaluated and analyzed through the benchmark challenge of engine and powertrain control simulation and modeling 2021(E-COSM 2021).The variables and the subscriptions used in this paper are indicated in Tables1 and 2.
2 Overview of the benchmark problem
The overview of the benchmark problem of E-COSM 2021 is described in this section. The benchmark problem is to develop a powertrain controller of an HEV which minimizes the total fuel consumption.The total fuel consumption is calculated by converting the electricity consumption to the fuel consumption through a given equivalent factor. The structure of the simulator provided for this benchmark problem is shown in Fig.1.The developed controller determines the reference torques of the engine,the generator,the motor,andthe mechanical braking force using traffic information while satisfying some constraints.
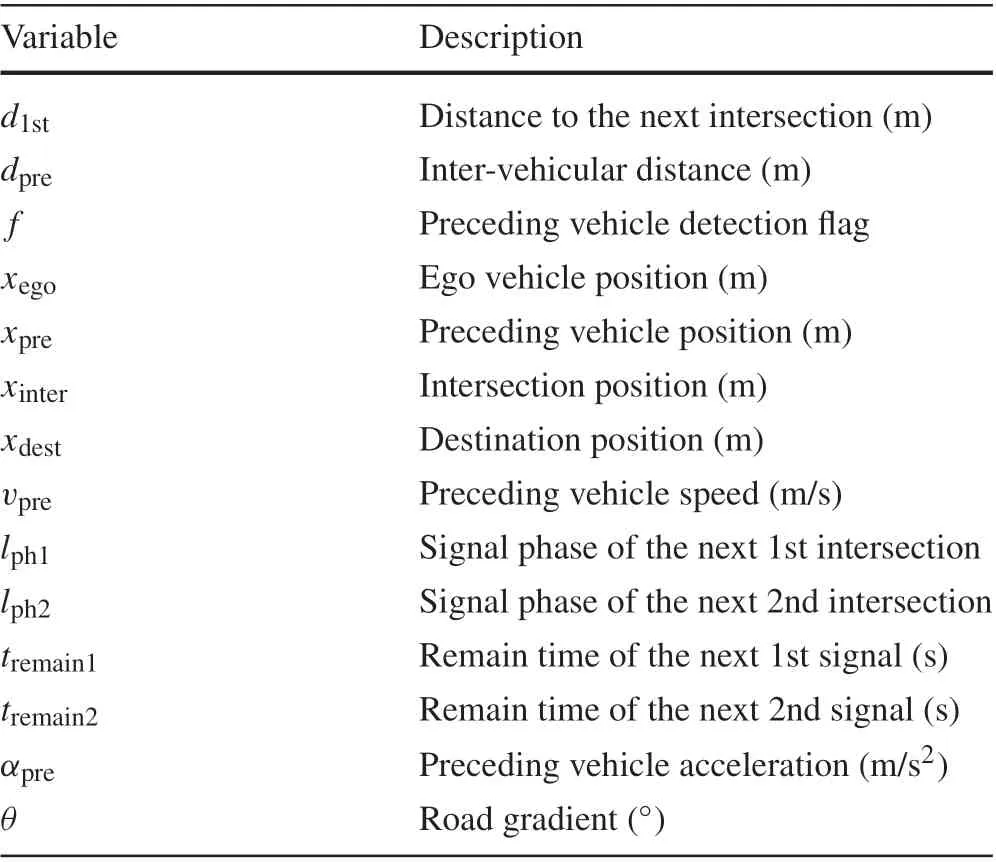
Table 3 Information available in this controller
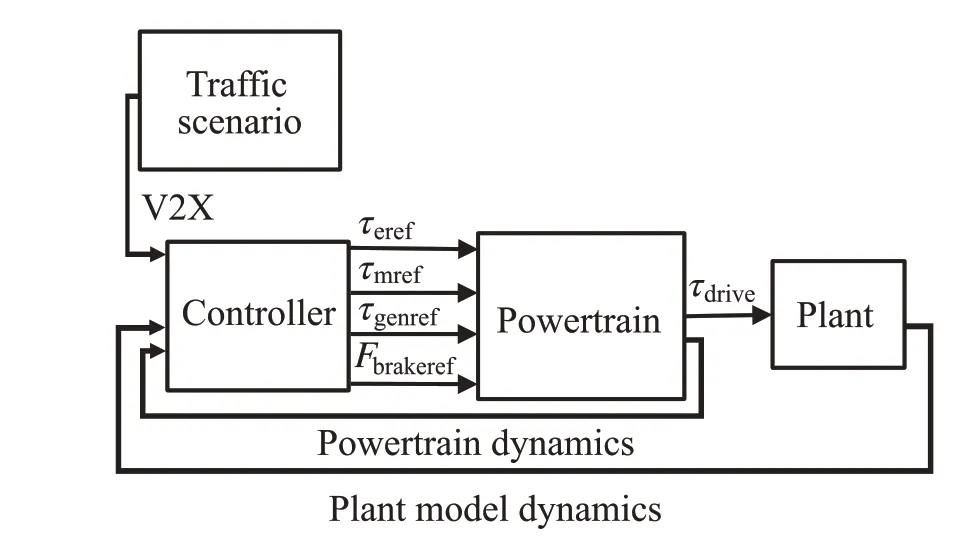
Fig.1 Structure of the provided simulator
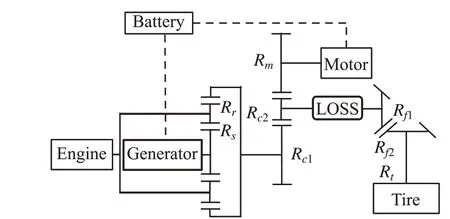
Fig.2 Powertrain of the ego vehicle
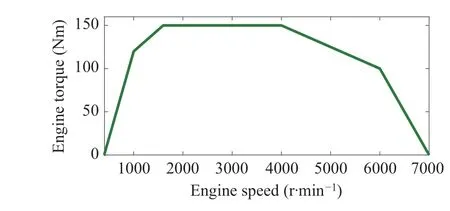
Fig.3 Engine torque constraint
As shown in Fig.2,the powertrain consists of an engine,a generator,and a motor,and they are connected by a planetary gear mechanism.The parameters,such as inertia of each powertrain and radius of each gear,are given.
The road on which vehicles travel in this benchmark problem is 16,002m with 26 signals,and the only other vehicle is the preceding one.There are ten traffic scenarios and the signal timing and behavior of the preceding vehicle varies scenario to scenario. The traffic information which can be used in the controller is described in Table3.
Five regulations in this benchmark problem are the following:
1. The speed of the ego vehicle must not exceed 60km/h.
2. The inter-vehicular distance of the ego vehicle to the preceding vehicle must not exceed the given minimum inter-vehicular distance for more than 20s. Minimum inter-vehicular distancedminis calculated by Eq.(1)his the driver reaction time(0.5s),anddsis the minimum inter-vehicular distance when the ego vehicle stops(3m).
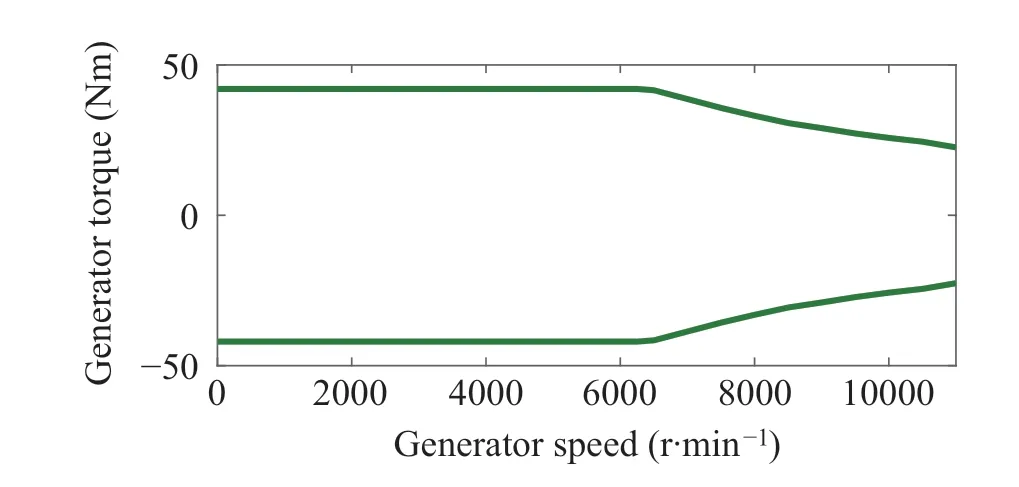
Fig.4 Generator torque constraint
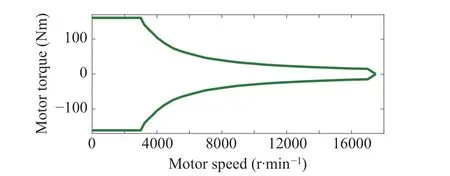
Fig.5 Motor torque constraint

3. The ego vehicle must not have a traffic collision.
4. The ego vehicle must not ignore the traffic signals.
5. The ego vehicle must arrive at the destination within 120s after the preceding vehicle arrives at the 26th intersection.
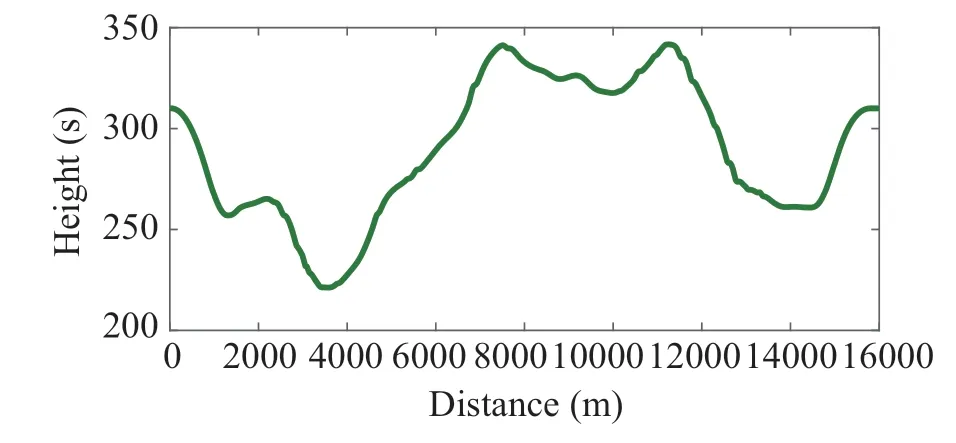
Fig.6 Road slope
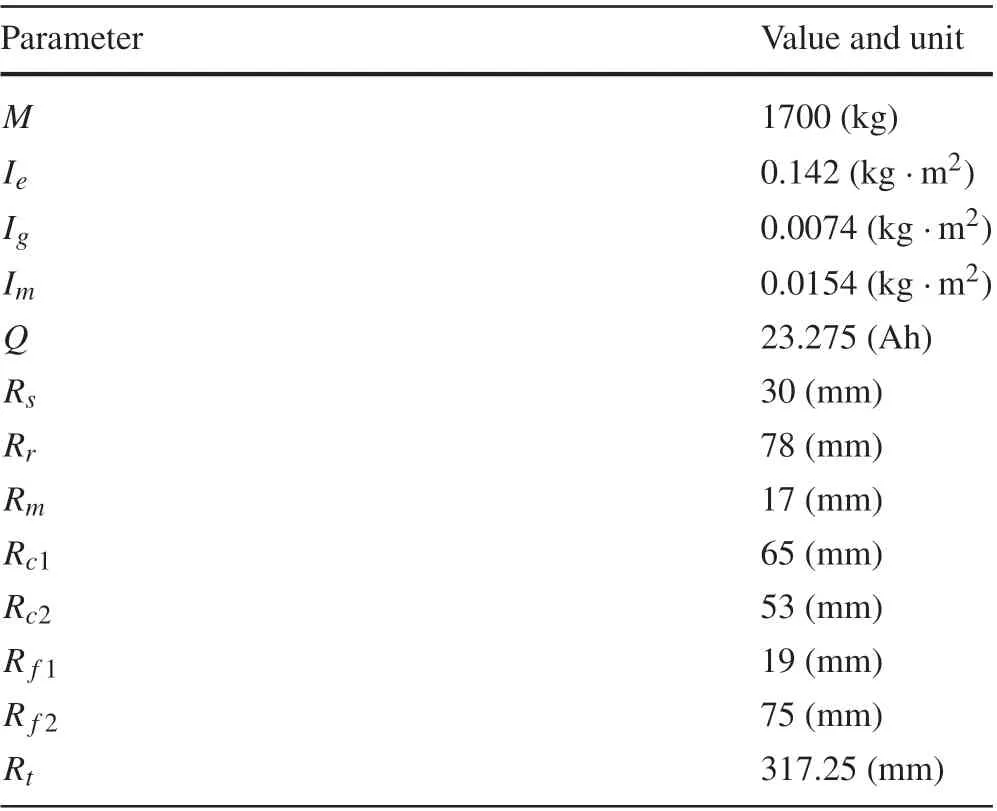
Table 4 Vehicle parameters
The constraints the ego vehicle has to follow are the physical limitations of the powertrain and evaluation regulations.The speed and torque constraints of the engine, generator,and motor are shown in Figs.3,4,and 5.
Other traffic is only the preceding car. The road is 16,002m. The road used in the simulation has no curves,but has 26 signals and 26 intersections,and has road gradient shown in Fig.6.
This simulation was done on Matlab/Simulink 2018a,Windows 10 64bit with Intel Core i7 processor. The simulation takes about 1 min.The vehicle parameters are shown in Table4.
Detailed information about vehicle and traffic is written in[24].
3 Development of the controller
This section describes the controller designed in this study.The overview of the controller is shown in Fig.7.The controller is composed of an acceleration decision part that determines the reference acceleration using V2X information, and a powertrain optimization part that outputs the reference torque of the engine,motor,and generator to realize the reference acceleration.
3.1 Acceleration decision part
This section describes the acceleration decision part.In the case of the two-vehicle scenario that is the subject of this study,following the speed of the preceding vehicle is clarified effective in reducing fuel consumption by the previous studies.The reference acceleration is determined,so that,in principle,the ego vehicle speed is the same as that of the preceding vehicle. However, there are some constraints in the given scenario,such as speed limit and traffic signals.If the ego vehicle speed is close to the speed limit or the distance to the next traffic signal is close, the reference acceleration is determined by a different formula to avoid breaking those constraints.A flowchart of the algorithm for determining the reference acceleration is shown in Fig.8.
3.1.1 When constraints need not be considered
When constraints such as speed limit and distance to the preceding vehicle or traffic signals do not need to be taken into account,the reference acceleration is determined based on PID to make the ego vehicle speed follow that of the preceding vehicle.The reference acceleration in this case isshown in Eq.(2). The PID gains are shown in Table5. The values of the gains were decided by trial and error
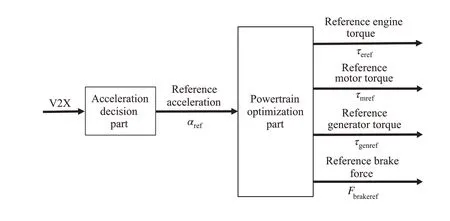
Fig.7 Overview of the controller
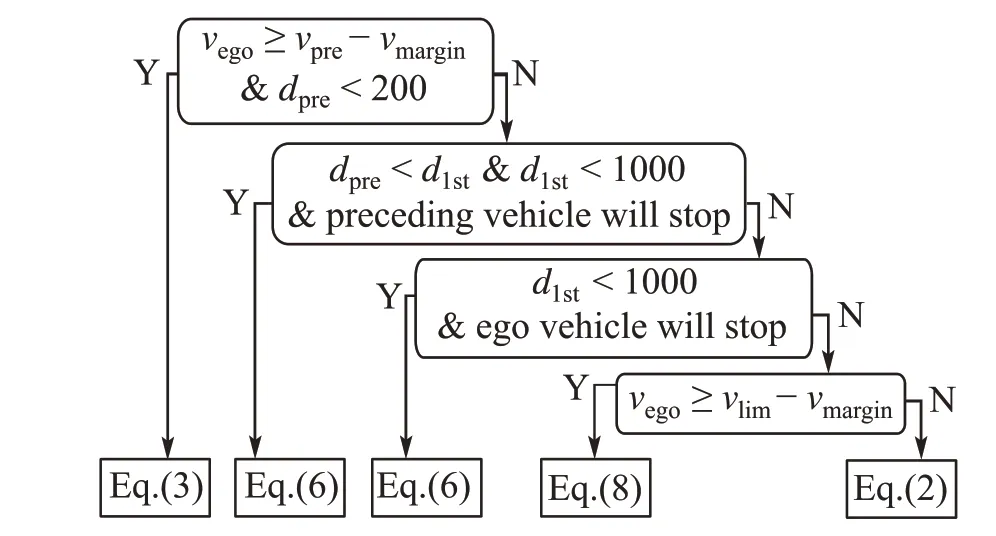
Fig.8 The reference acceleration decision algorithm

Table 5 List of PID gain

3.1.2 When the inter-vehicular distance is short
This section describes the case where the inter-vehicular distance is short. To avoid collision or breaking into the minimum distance,the ego vehicle should decelerate when the inter-vehicular distance becomes shorter than a threshold value and when the preceding vehicle becomes slower than ego vehicle.Equation(3)shows the reference acceleration.This means that the ego vehicle will decelerate to the preceding vehicle speed by the time it reaches the current position of the preceding vehicle.The threshold value of the inter-vehicular distance is set to 200m
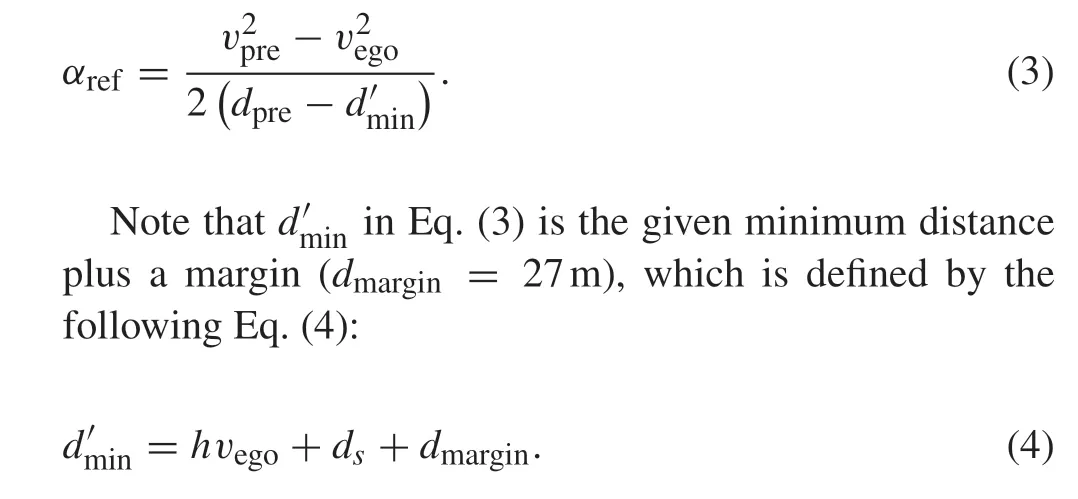
3.1.3 When considering the next traffic signal
This section describes the case where the preceding vehicle slows down or stops at a red signal,or where ego vehicle needs to slow down or stop to avoid passing through an intersection at the red signal.Whether the next traffic signal is red or green can be predicted and the need to decelerate can be detected long before reaching the next traffic signal,sudden braking, and extra acceleration can be avoided. Therefore,the controller was designed to predict whether the next traffic signal is red or green when reaching the intersection and to start deceleration early when deceleration is judged to be necessary.
First, the method of predicting whether the next traffic signal is red or green at the next intersection is explained.Using the information of the current speed of the ego vehicle,the next traffic signal,and the time until the next traffic signal changes,the traffic signal at the arrival of the ego vehicle is predicted. The time necessary for ego vehicle to reach the next traffic signal is predicted by the following Eq.(5):

The next traffic signal at the arrival of the ego vehicle is predicted by comparing the predicted arrival time with the time until the next traffic signal changes.When the ego vehicle is slow, the accuracy of the prediction time to the next intersection is low.In the case that the speed of the ego vehicle is near 0km/h,the speed of the ego vehicle is assumed as 36km/h in Eq.(5),and predict the next traffic signal if the ego vehicle accelerates.The value 36km/h is decided by trial and error.
Next,the reference acceleration is described for the case where the prediction of the next traffic signal leads to the deceleration of the preceding vehicle or ego vehicle. If the next traffic signal is predicted to be red when either the preceding vehicle or ego vehicle arrives,the ego vehicle should stop before the next intersection.Equation(6)shows the reference acceleration for this case

If the traffic signal is predicted to be green when both preceding vehicle and ego vehicle arrive at intersection,the reference acceleration is determined according to the principle in Eq.(2).Note that the prediction of the next traffic signal is made from 1000m before the intersection. This value of distance was decided by trial and error.
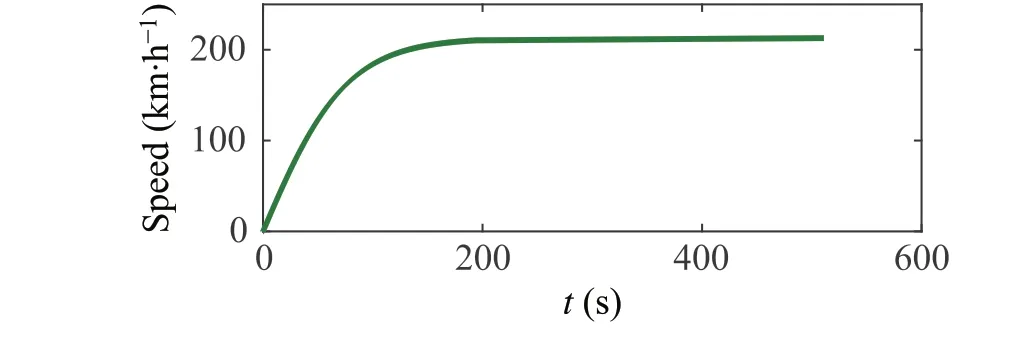
Fig.9 The result of the simulation
3.1.4 When the speed of ego vehicle is close to limit
This section describes the case where the speed of ego vehicle is close to the speed limit.In the PID-based method,there is an overshoot.Therefore,if the vehicle tries to drive just at the speed limit,the speed will exceed the speed limit.To avoid this,aspeedlimitthatisslightlyslower(vmargin=0.36km/h)than the given speed limit is set in Eq.(7).When the speed exceeds this modified speed limit,the ego vehicle will decelerate so as not to break the given speed limit. Equation (8)shows the reference acceleration in this case

3.2 Powertrain optimization part
This section describes the powertrain optimization part.The powertrain optimization part determines the reference values of the engine, generator, and motor torques and brake forces necessary to achieveαrefdetermined in the acceleration decision part. The driving forceFdrivefor acceleration is calculated using the reference accelerationαref, the road gradient,and air resistance as Eq.(9)

The air resistance coefficientkis not given, wherefore simulation was done to calculatek. In this simulation, the ego vehicle accelerates by constant force (1500N) and the road has no gradient.The result of this simulation is shown in Fig.9.
The ego vehicle accelerates until the air resistance equals to 1500N. Then,kwas obtained using ego vehicle speed(213.1km/h). The calculated value ofkis 0.428(Nm)2/s2.WhenFdrive>0, the torque reference valuesτeref,τgenref,τmreffor the engine,generator,and motor are determined by the following procedure to minimize the fuel consumption.The reference value of the brake force is set toFbrakeref=0.The procedure is indicated as follows:
I. The optimal split ratioσoptis determined by setting the split ratioσ,which will be defined later,from 0.00 to 1.00 in 0.01 increments. The consumption FUELtotalis calculated in each ratio by the following procedure.
(i) Calculate the current generator and motor angular speed from the engine angular speed and the ego vehicle speed.
(ii) Calculateτeref,τgenrefandτmreffrom the reference accelerationαrefand the split ratioσ.
(iii) Calculate the fuel consumption rate FUELtotalusing brake specific fuel consumption (BSFC) of the engine,and virtual fuel consumption rate of the generator and the motor which converted from efficiency of motor and generator.
II.If the optimal split ratioσoptdetermined in I is positive and the engine speed is less than 600r/min,generator starts the engine. Otherwise, determine the reference torquesτeref,τgenrefandτmreffor the engine,generator,and motor based on the reference accelerationαrefand the optimal split ratioσopt.
WhenFdrive≤0, energy is recovered by regenerative braking. The shortage of braking force is compensated by mechanical brakes. From Sects.3.2.1 to 3.2.4, the detailed procedure for theFdrive>0 is explained, and the detailed procedure for the caseFdrive≤0 is explained in Sect.3.2.5.
3.2.1 Calculating the generator and motor angular speed(I.(i))
The generator angular speedωgenand motor angular speedωmcan be calculated using the ego vehicle speedvegoand engine angular speedωe. Since the motor and tire are connected by gears,the motor angular speedωmcan be calculated in Eq.(10)using the final reduction ratio of the motorr fexpressed in Eq.(11)
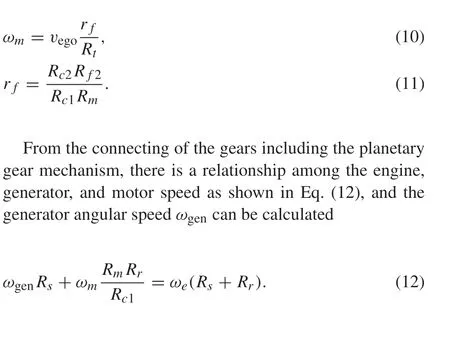
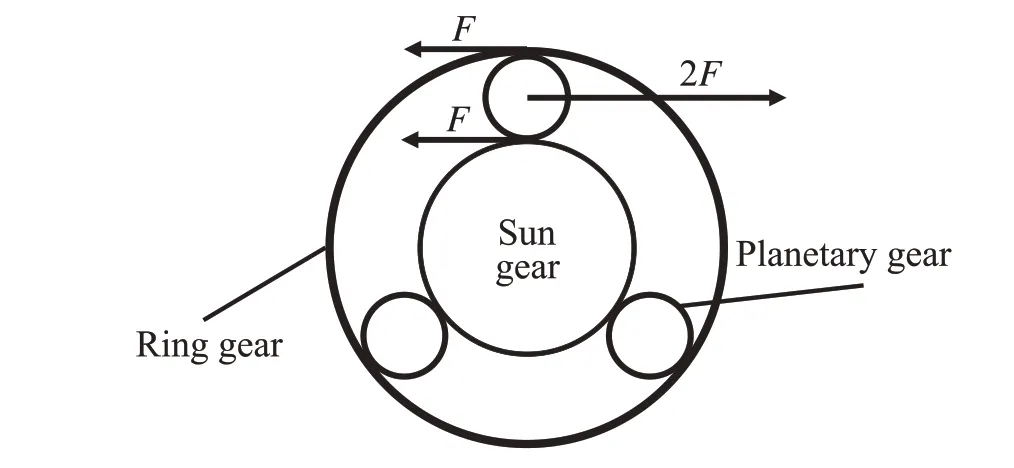
Fig.10 A schematic diagram of the planetary gear
3.2.2 Derivation of reference torques for engine,generator,and motor from reference acceleration and split ratio(I.(ii))
To obtain the relationship between the engine and generator and motor torque (τe,τgen,τm) and the vehicle reference acceleration(αref),the powertrain is modeled.Planetary gear mechanisms have been the subject of many researchs,and the modeling methods have been clarified[25-27].A schematic diagram of the planetary gear is shown in Fig.10.
As shown in Fig.10,the planetary gears are subjected to internal forcesF. The relationship between the reference accelerationαrefand the motor angular acceleration ˙ωmis shown in Eq.(13)
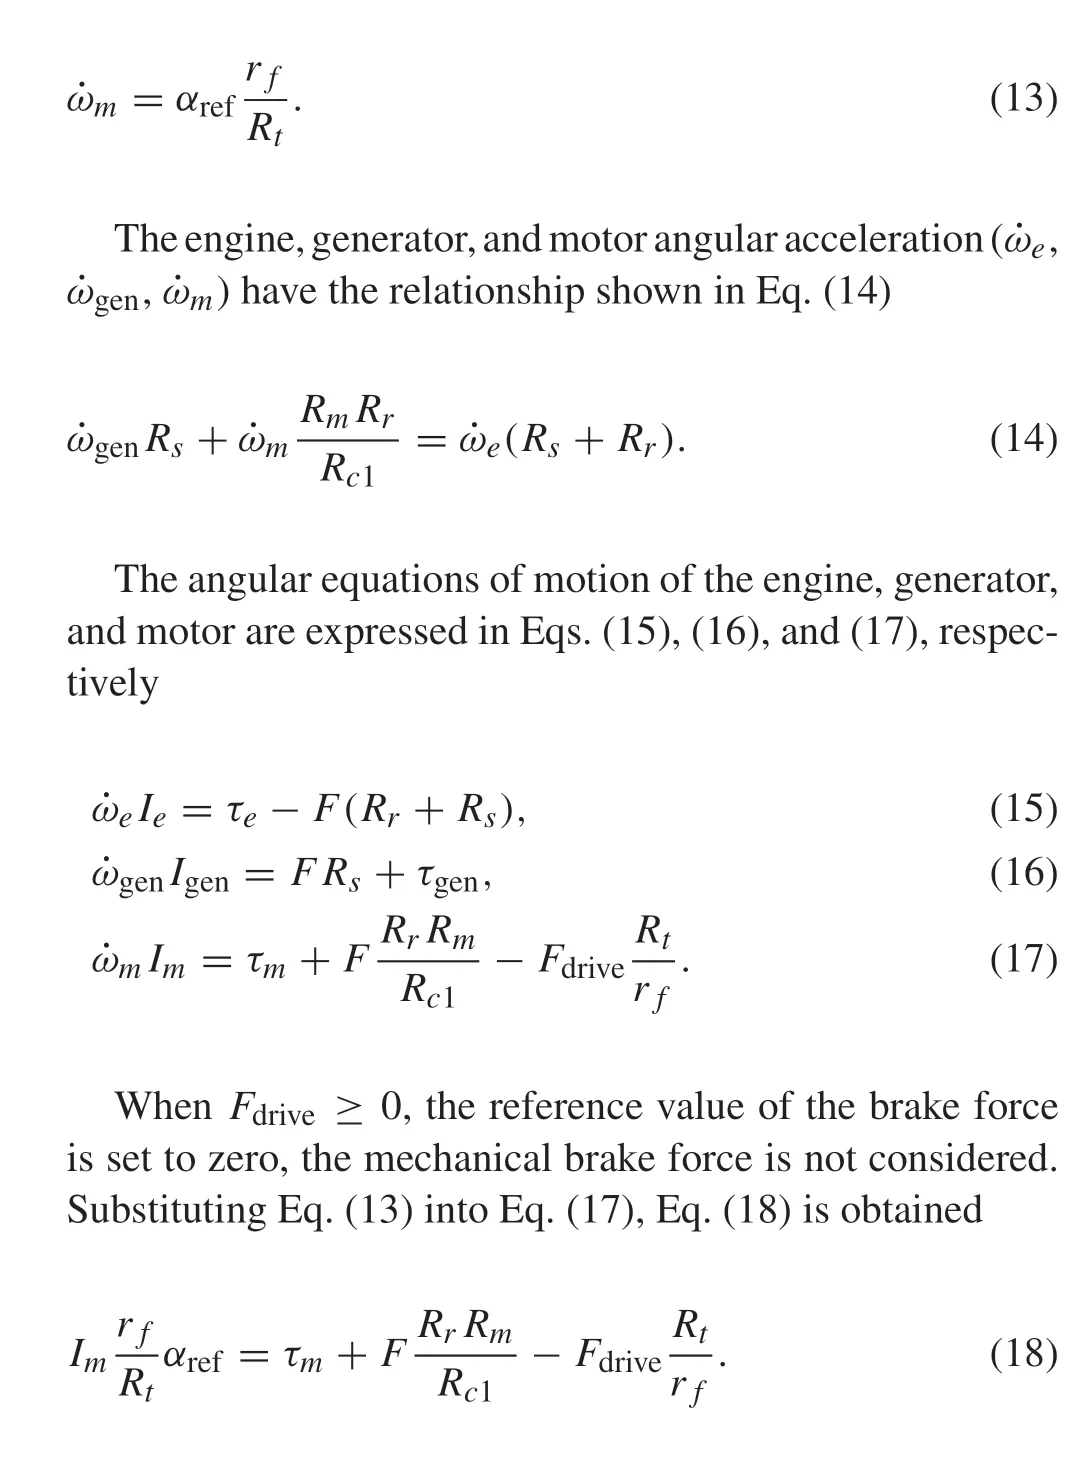
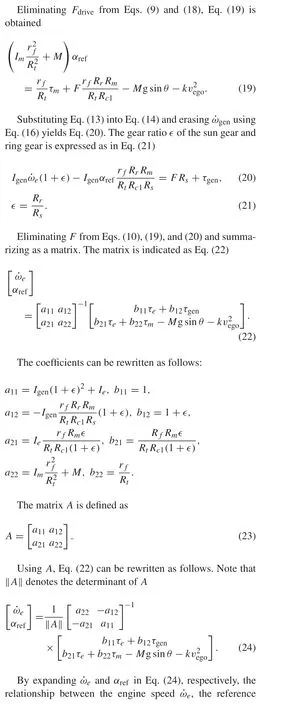
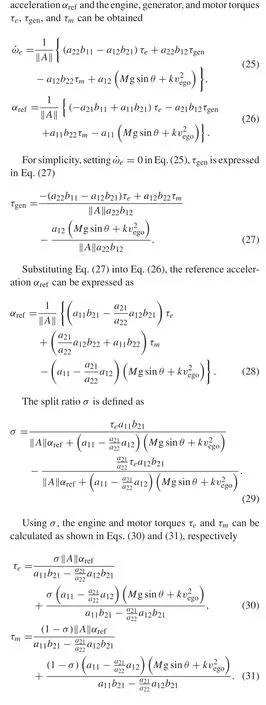
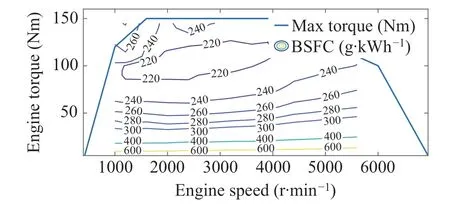
Fig.11 BSFC map of the engine
Substituting these into Eq.(27),τgencan be obtained.
3.2.3 Calculating the fuel consumption rate(I.(iii))
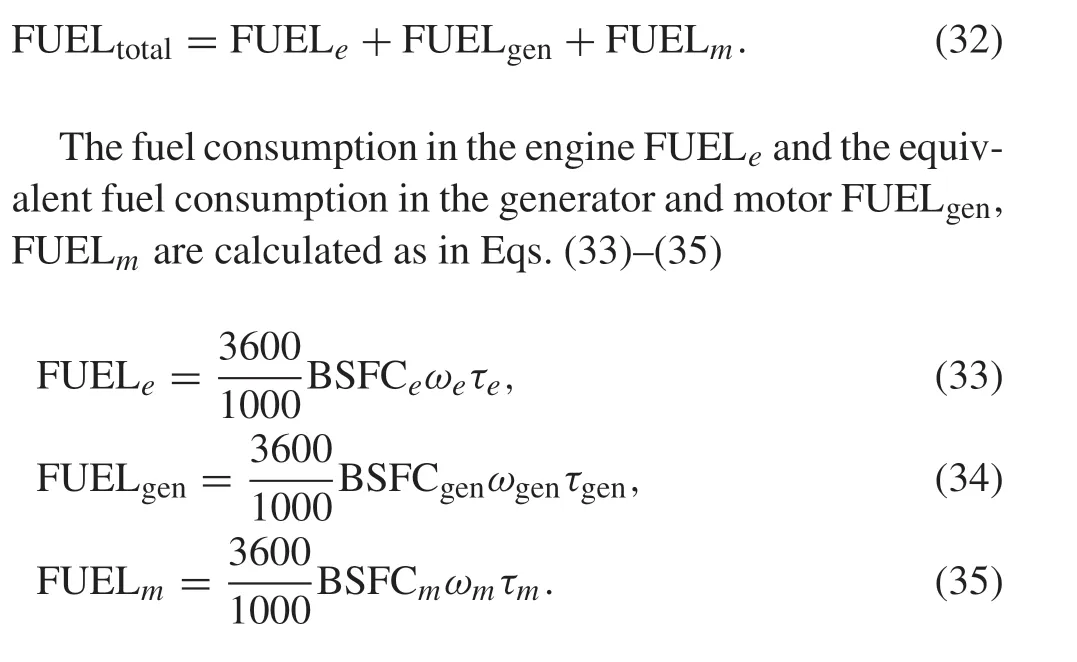
In this benchmark problem, the fuel consumption from the start to end is evaluated, assuming that 1% of battery SOC(state of charge) is equivalent to 25g of gasoline. Here, the equivalent factorδ=25g/%SOC is used to convert the electricity consumption to equivalent fuel consumption.The total fuel consumption FUELtotalis expressed by Eq.(32)
The engine BSFC is given as a function of engine speed and engine torque,as indicated in Fig.11.When calculating FUELe,the engine speed is assumed to be 2000r/min,which is the region of high thermal efficiency of the engine. This is because when referring to BSFCeat current engine speed.If the engine speed is low, the thermal efficiency will be extremely low,the split ratio of 0 will be judged optimal,and the decision to run the engine will not be made.
BSFCgenand BSFCmare the values obtained by converting the increase or decrease of SOC into fuel consumption by the equivalent factorδwhen 1 kWh of mechanical work is extracted from the generator and motor.These are obtained by the following procedure.Note that BSFCgenand BSFCmare negative values when the generator and motor are generating electricity with positive mechanical work.
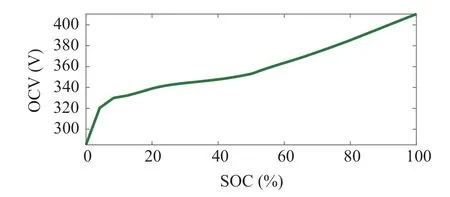
Fig.12 SOC-OCV curve
To obtain BSFCgenand BSFCm,the amount of electricity at 1%SOC is first estimated.The battery capacityQis given(Q= 23.5Ah). Figure12 shows the relationship between SOC and open circuit voltage (OCV) when the battery is charged with a constant current from 0% SOC. The OCV of a battery depends on the SOC.The OCV is derived from Fig.12.The amount of electricityPextracted from 1%SOC can be calculated in Eq.(36)using OCV andQ
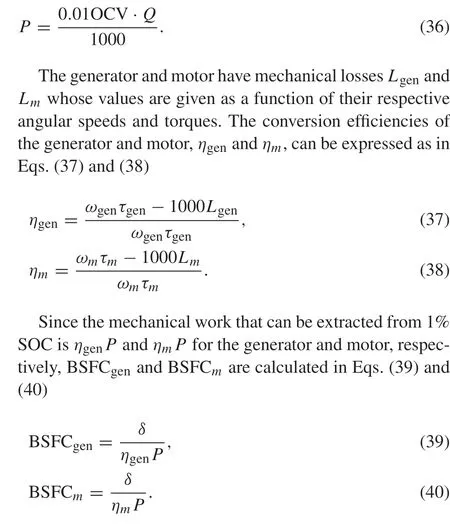
The BSFC of the generator and motor are expressed as a function of their respective torques and rotational speeds. FUELtotalis calculated when the split ratio isσ=0.00,0.01,...,1.00. and the split ratio with the smallest FUELtotalamong them is chosen as the optimal split ratioσopt.
3.2.4 Determination of reference values for engine,generator,and motor torque and brake force when Fdrive >0(II)
When the optimal split ratioσoptis positive and the engine speed is below 600r/min,the engine will be started.Engine starting is done by the generator. The mechanical brake is not used at this time. The reference torque for the engine and generator were determined by trial and error asτeref=-36Nm,τgenref=10Nm andτmrefis derived from Eq.(27).
When the optimal split ratioσoptis positive and the engine speed is 600r/min or higher, the reference torque of the engine,generator,and motor(τeref,τgenref,τmref)are determined from the reference accelerationαrefand the optimal split ratioσopt. To keep the engine speed at 2000r/min, a correction term is added to the generator torque,as shown in Eq.(41).K p= 0.025 andKd= 0.0015 are used andωerefis the reference engine angular speed
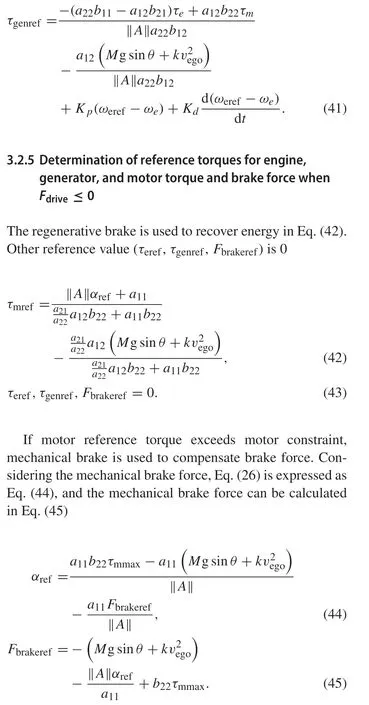
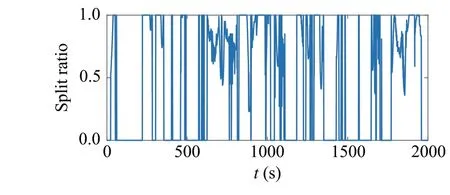
Fig.13 Optimal split ratio history
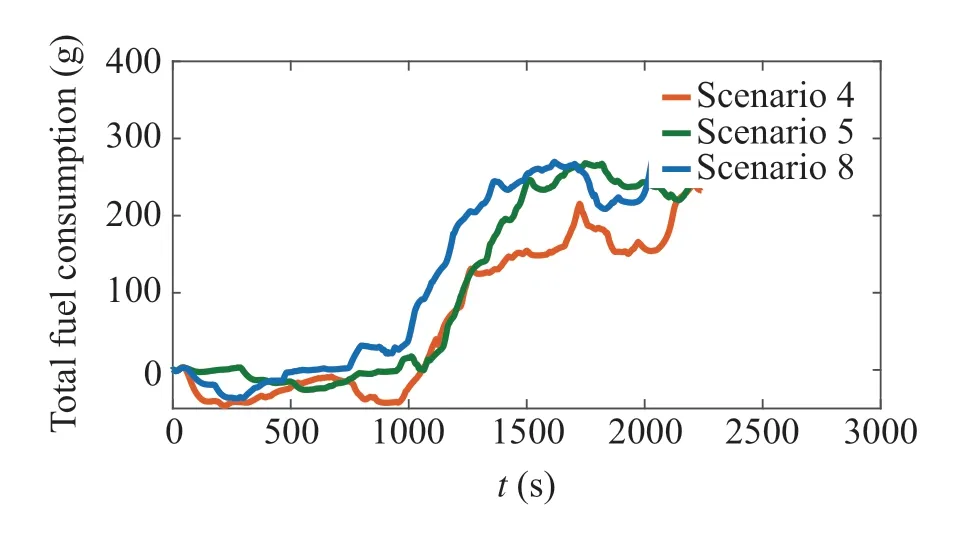
Fig.14 Acceleration validation
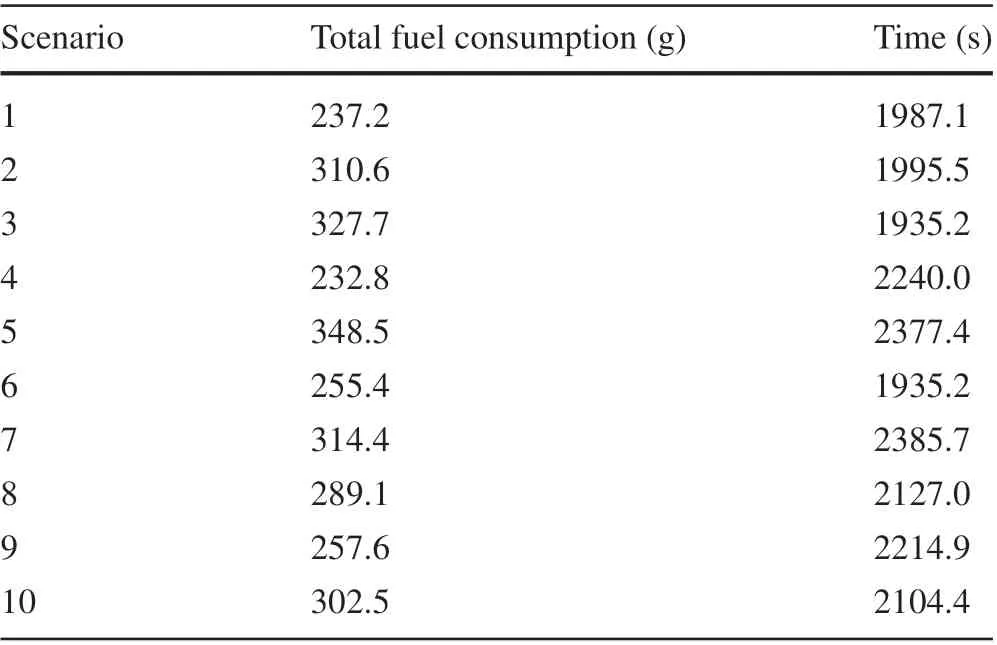
Table 6 Energy consumption in each scenario
4 Results and discussion
In this section,the results of the simulation are explained.The simulation sampling time and plot sampling time are 0.01s.First, the split ratio optimization is validated and the result is shown in Fig.13.According to the figure,there is a point where the engine and motor are both operated to minimize the fuel consumption,instead of only the engine(σ=1)or only the motor(σ=0).
Therefore, it is considered that optimization by the controller is performed. Next, the total fuel consumption and the goal time in each traffic scenarios are shown in Table6.In each scenario,the behavior of the preceding vehicle and the timing of the traffic signals varies,because each scenarios have different scenario data given in E-COSM 2021.The total fuel consumption is the total of the fuel consumption and the converted fuel consumption from electricity.
To analyze the difference of the total fuel consumption among the scenario, the best (scenario4), average (scenario8),and worst(scenario5)of these results are compared.First,the history of total fuel consumption for each scenario is shown in Fig.14. The regenerative brake generates electricity and the electricity is also converted to fuel, so the total fuel consumption decreases. The history of the total fuel consumption varies scenario to scenario.The difference is caused by the difference of the traffic signal timing and the preceding vehicle behavior.Looking at 0-1000s,the history of the total fuel consumption differs from scenario to scenario.Therefore,how to use regenerative braking is considered to have a significant impact on fuel consumption.The history of the motor operating points for each scenario between 0 and 1000s is shown in Fig.15.The plot sampling time is 2s.
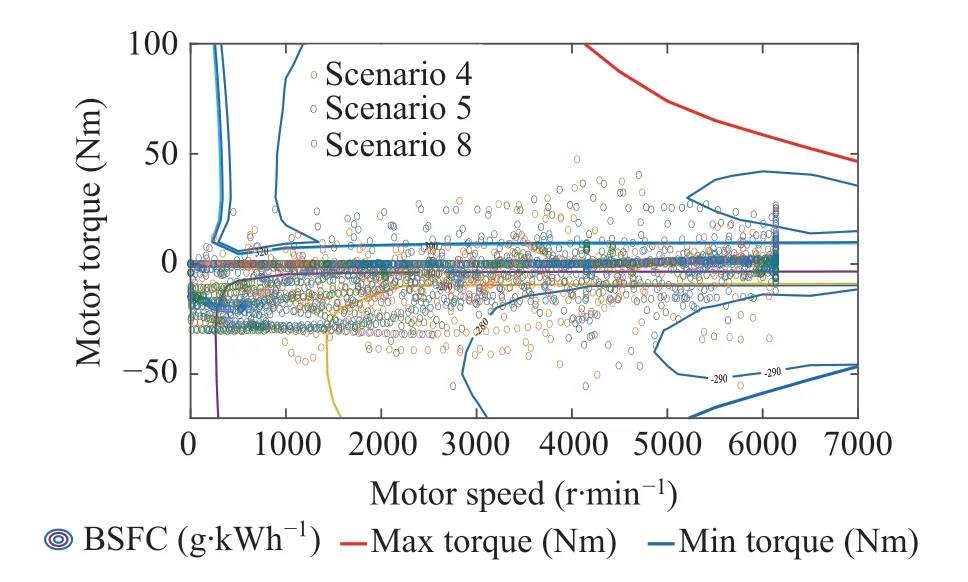
Fig.15 Motor operating points

Table 7 Total fuel consumption of each controller
In the best scenario(scenario4),the operating points of the regenerative brakes are concentrated at the points where the motor speed is high(4000-6000r/min). On the other hand,the worst scenario(scenario5)uses a lot of regenerative braking at a low motor speed(0-2000r/min).Since the efficiency of the regenerative brake is better when the speed of the vehicle is higher,the use of the regenerative brake at low speed leads to lower fuel efficiency. To clarify the effects of the acceleration decision part and the powertrain optimization part,a controller was created for comparison.The controller has constant split ratioσopt= 0.5 in the powertrain optimization part. The fuel consumption for each controller is summarized in Table7.
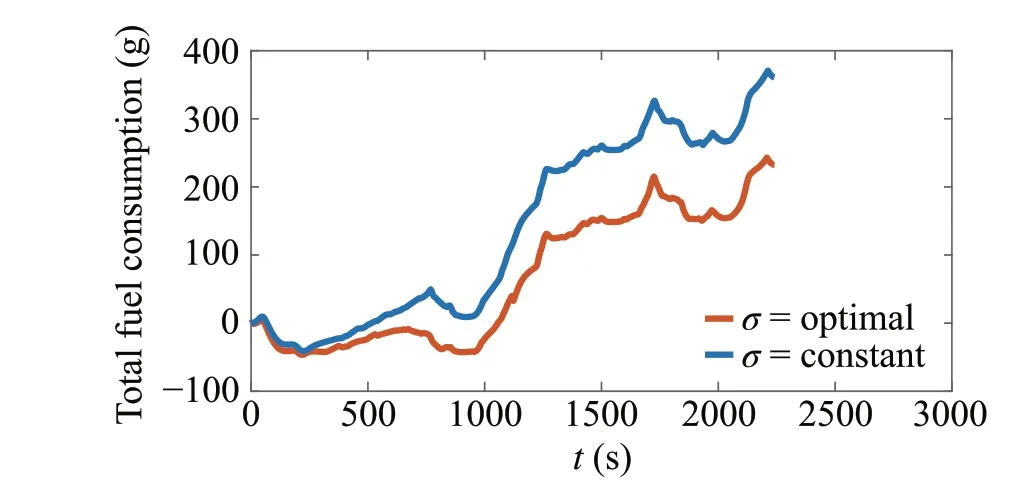
Fig.16 Effect of the difference of σopt
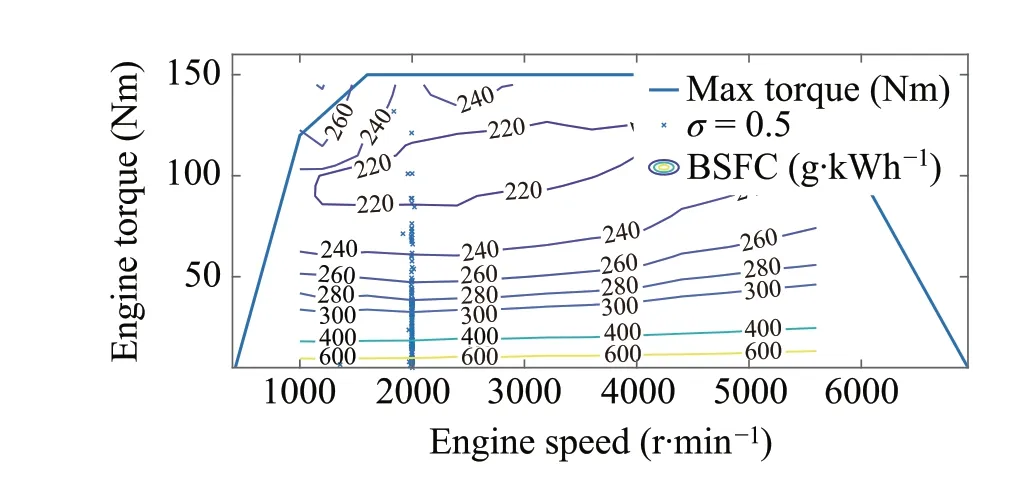
Fig.17 Engine operation points(σopt =0.5)
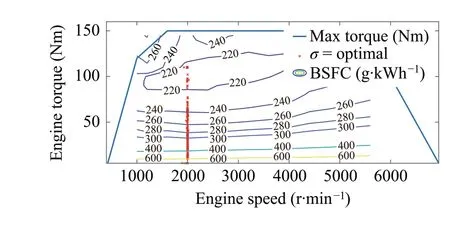
Fig.18 Engine operation points(σopt =optimal)
The developed controller and the controller with constant optimal split ratio are compared.The comparison of the total fuel consumption is shown in Fig.16.
According to the figure, there is a significant difference between 0-1000s.This is because the powertrain operates in high efficiency area in the developed controller.The powertrain operating points of each controller between 0 and 1000s are shown in Figs.17 and 18.The plot sampling time is 2s.Many engine operation points are in the high efficiency area(260g/kWh)whenσoptis optimal,which leads to a reduction in fuel consumption.
Next,the motor operating points are indicated as Figs.19 and 20.Whenσoptis optimal,many motor operating points are in higher load (20-40Nm) and high speed (4000-6000r/min);then,whenσoptis 0.5,this causes the improvement in the efficiency of the motor.These results show that the developed controller could operate the powertrain in high efficiency area, which leads to reduction in total fuel consumption.
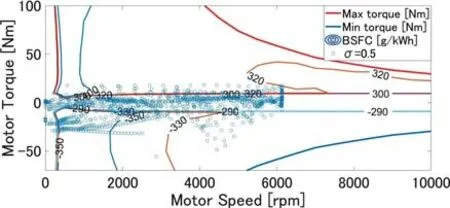
Fig.19 Motor operation points(σopt =0.5)
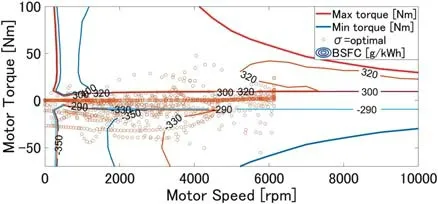
Fig.20 Motor operation points(σopt =optimal)
5 Conclusions
In this paper, a powertrain controller for HEVs with information on traffic signals, road, and the preceding vehicle is proposed for the purpose of reducing fuel consumption.The controller decides the reference acceleration of the ego vehicle to reduce sudden acceleration and deceleration based on the information of the traffic signals and the preceding vehicle. Then, the controller decides the reference torque of engine, generator, and motor to achieve the reference acceleration. The optimal power split ratio was calculated to minimize the total fuel consumption. As a result of simulation, the controller could operate the powertrain in high efficiency area which leads to the reduction in fuel consumption.
Open Access This article is licensed under a Creative Commons Attribution 4.0 International License,which permits use,sharing,adaptation, distribution and reproduction in any medium or format, as long as you give appropriate credit to the original author(s) and the source, provide a link to the Creative Commons licence, and indicate if changes were made. The images or other third party material in this article are included in the article’s Creative Commons licence,unless indicated otherwise in a credit line to the material. If material is not included in the article’s Creative Commons licence and your intended use is not permitted by statutory regulation or exceeds the permitteduse,youwillneedtoobtainpermissiondirectlyfromthecopyright holder. To view a copy of this licence, visit http://creativecomm ons.org/licenses/by/4.0/.
杂志排行
Control Theory and Technology的其它文章
- Stochastic model predictive braking control for heavy-duty commercial vehicles during uncertain brake pressure and road profile conditions
- Characterizing human driver characteristics using an artificial neural network and a theoretical model
- On-board torque management approach to the E-COSM benchmark problem with a prediction-based engine assignment
- Speed planning and energy management strategy of hybrid electric vehicles in a car-following scenario
- Real-time energy optimization of HEVs under-connected environment:a benchmark problem and receding horizon-based solution
- Optimization of fuel consumption and NOx emission for mild HEV via hierarchical model predictive control
