Numerical simulation of operation performance on production and injection of a double well geothermal system in Kailu Basin, Inner Mongolia
2022-06-27YukunSunFengLiuHuajunWangXinzhiGao
Yu-kun Sun, Feng Liu, Hua-jun Wang*, Xin-zhi Gao
1 School of Energy and Environment Engineering, Hebei University of Technology, Tianjin 300401, China.
2 Institute of Hydrogeology and Environment Geology, Chinese Academy of Geological Sciences, Shijiazhuang 050061, China.
3 Technology Innovation Center of Geothermal & Hot Dry Rock Exploration and Development, Ministry of Natural Resources, Shijiazhuang 050061, China.
4 Tianjin Geothermal Exploration and Design Institute, Tianjin 300250, China.
Abstract: Inner Mongolia is abundant in geothermal resources, but the development and utilization of medium-depth geothermal resources for clean heating in winter is still in the preliminary stage compared with the neighboring provinces. In this paper, a recently developed geothermal heating system using the Mesozoic sandstone reservoirs in Baokang of Kailu Basin, Eastern Inner Mongolia was investigated, a threedimensional geological model of a pair of production and injection well was established, and numerical simulations on the long term operation performance were conducted and verified by pumping test and water level recovery test data. The effects of flow rates, the direction of wells, injection temperature and ratios on the flow field and water level in the thermal reservoir were analyzed. The results show that considering a 30-year operation period and a production rate from 90 m3/h to 110 m3/h, the optimum well spacing can be increased from 225 m to 245 m, with an average value of 235 m. With the decrease of the injection temperature, the cold front of the injection water has an increasing influence on the temperature in the production well. A complete injection or the principle of production according to injection is recommended in order to maintain the long-term operation stability. In addition, the location of the injection well should be arranged in the downstream of the natural flow field. The present results can provide a useful guide for the optimum design and performance prediction of geothermal wells, thus maintaining the production and injection balance and promoting the sustainable development and utilization of medium-depth and deep geothermal resources.
Keywords: Geothermal well; Optimum well spacing; Production and injection; Numerical simulation; Heat breakthrough
Introduction
In recent years, the sustainable development and utilization of medium-depth geothermal energy resources has become one of the important technical approaches to promoting clean heating, energy conservation and low-carbon emission in North China(Wang et al. 2017a; Wang et al. 2017b; Wang et al.2018). A reasonable well spacing is a key factor to ensure the long-term operation stability and energy efficiency of a geothermal production and injection system. If the well spacing is too small, the heat breakthrough is easy to occur during the injection of geothermal tail water; On the contrary, if the well spacing is too large, it will lead to insufficient hydraulic supply in the producing wells, thereby reducing the operation efficiency and economic benefits of the geothermal system. Therefore, it is very crucial to determine the optimum production and injection patterns based on the local geological geothermal conditions in the development of geothermal fields (Mao et al. 2019; Tan et al. 2019).
Previous experimental and simulation studies analyzed the effects of geological structure, hydrogeological conditions, thermal reservoir conditions,well spacing and other factors on the production and injection capacity of geothermal systems (Axelsson, 2010; Shaik et al. 2011; Darius et al. 2011).For instance, Noack et al. (2013) established a 3D numerical model for the geothermal field in Brandenburg Basin, Germany, and analyzed the cooling effect of underground flow in the regional temperature field. Using the open-source code FALCON,Xia et al. (2017) analyzed the water circulation and heat extraction of an enhanced geothermal system during the 30-year operation at a depth of 3000 m,and preferable horizontal spacing, downward deviation angle of the parallel wells, and injection flow rate was recommended. Major et al. (2018) used FEFLOW to simulate the heat storage and heat extraction of sandstone reservoir in Danish geothermal field during the 30-year operation, and analyzed the influence of the storage volume and the injection coefficient. Lous et al. (2018) established a 3D transient flow model by using FEFLOW, analyzed the flow and temperature field in thermal reservoirs during the operation of 50a, and discussed the effects of the permeability coefficient, injection temperature, production capacity, and thermal conductivity of thermal reservoirs. Blank et al.(2020) developed a numerical model based on finite element analysis and gradient-free optimization to simulate groundwater flow and heat transport in thermal sedimentary aquifers, and investigated the optimal positioning and spacing of multiwell systems.
At the same time, domestic researchers have also done much work in the field of the production and injection of medium-depth geothermal wells.For instance, Zhang et al. (2006) used HST3D to analyze the variations of the temperature field in thermal reservoirs under different spacing of geothermal wells. The results showed that with the increase of well spacing, the temperature in the production well changes slowly and the amplitude decreases. Lei and Zhu (2010) used TOUGH2 to simulate the injection of geothermal tail water in the Guantao Formation reservoirs in Tianjin. The results showed that a high injection rate helps to slow down the lowering of the groundwater head.Ke et al. (2019) studied the variations of the temperature and hydraulic level of reservoirs in the stratum of Lantian-Bahe Group under different well layouts and operating settings using FEFLOW.Kong et al. (2020) used OpenGeoSys to simulate the heat storage of carbonate reservoirs in Xiong county geothermal field, and proposed that the operation cost should be taken into consideration when optimizing the production and injection patterns of geothermal wells. To sum up, it can be seen that the production and injection flow rate, well spacing and other parameters have a great impact on the long-term operation stability and reliability of the entire geothermal system. In addition, the design and operation of geothermal wells in engineering practices also show obvious regional differences, which should be considered according to local conditions.
Inner Mongolia is located in the region with extremely cold weather, with a strong demand for heating in winter. But the region has long relied on coal as its main heating fuel. In recent years, as a positive response to the nation policy of clean heating in winter, a series of Blue Sky Protection Campaigns are being launched in many northern provinces to make full use of renewable energy and reduce the environmental pollution. In October 2021, the first medium and deep geothermal heating demonstration system was successfully built and operated in the Kailu Basin of Inner Mongolia.Up to now, the entire system is operating steadily,achieving the expected energy-saving and economic benefits. Taking this demonstration project as the research object, this paper uses FEFLOW to perform the three-dimensional modeling and numerical simulation on the production and injection of geothermal wells, analyze the variation characteristics of the temperature and flow field in the thermal reservoirs under different production and injection patterns, and finally evaluate the influences of the well spacing and injection parameters on the operation performance of the geothermal system.The purpose is to provide valuable guidance for the sustainable development and utilization of medium-depth geothermal energy in areas with similar geothermal geological conditions.
1 Region geological and climatic conditions
The working area is located in the west of Baokang Town (Horqin Zuoyi Zhongqi), Kailu Basin,Inner Mongolia. The geographical coordinates range from 123°11′39″E to 123°19′10″E and from 44°03′00″N to 44°08′26″N, with a total area of about 100 km2. This area belongs to the aeolian-alluvial plain, high in the west and low in the east, with an altitude of 139-148 m. The general terrain is wavy. Especially, it is affected by the distribution of aeolian sand dunes. In terms of geological structure, the area falls in ZhangJiayao Sag of the northwest of Baokang Sag. Baokang Sag is located in the south of the central depression area of Ancient Songliao Basin, as shown in Fig. 1(Qin et al. 2015). Influenced by the Mesozoic Yanshan tectonic movement, the Cretaceous sedimentary depression was developed based on the Paleozoic fold basement. The overall shape of the depression looks like a triangle open to the north,which is 35-80 km long from north to south and 6-70 km wide from east to west, covering an area of 3 678 km2.

Fig. 1 Geological schematic map in the south of Songliao Basin (modified from Qin et al. 2015)
According to the regional geological data, the strata in the working area can be divided from top to bottom as follows: (i) Quaternary: Daqinggou formation (0-81.55 m), loose deposits; (ii) Neogene: Taikang Formation (81.55-90.00 m), massive grayish white sand and gray mudstone with poor consolidation; (iii) Upper Cretaceous: Mingshui Formation, Sifangtai Formation (K2sf), Nenjiang Formation (K2n), Yaojia Formation (K2yj),Qingshankou Formation (K2qs), and Quantou Formation (K2q) (90.00-641.60 m); (iv) Lower Cretaceous: Fuxin Formation (K1f), Shahai Formation(K1sh), and Jiufotang Formation (K1jf) (641.60-1 503.6 m).
Influenced by the ancient geological movement in the basin, there is a large-scale tensional normal fault in the working area. On the eastern side of the fault, there is a descending plate with lower Cretaceous and Carboniferous-Permian strata developed, and on the western side of the fault, there is an ascending plate with Carboniferous and Permian strata developed, which provides favourable hydraulic conditions for geothermal production and injection. In the present work, the sandstone thermal reservoir of Shahai Formation (K1sh) is mainly exploited as the target layer with good permeability and abundant geothermal resources. The upper Cretaceous and Cenozoic strata, composed of mudstone and sandstone of continental lacustrine and fluvial deposits with a high degree of cementation,form the cap layer overlying the thermal reservoirs.The flow direction of the natural flow field at the projection site is roughly from west to east.
In terms of climate, the working area belongs to the arid and semi-arid continental climate zone.The annual average ambient temperature and wind speed is 5.5℃ and 4 m/s, respectively. The typical tjaele thickness ranges from 140 cm to 180 cm,about 100 cm thicker compared with the North China Plain. In addition, Energy Saving Design Standard for Residential Buildings in Cold and Cold Areas (JGJ 26-2018) according to the national standard. Baokang falls in the climate zone of Severe Cold C, indicating a very strong heating demand for buildings. In the above standard, the heating period of 164 days per year is recommended for civil buildings. In recent years,however, the heating period of 6 months (October 15 to April 15 or October 20 to April 20) is recommended by the local government. The latter will be adopted in the following simulations.
2 Numerical modeling
2.1 Groundwater flow equations
Based on the assumption that (i) groundwater flows in the horizontal, anisotropic and heterogeneous thermal reservoirs satisfies the Darcy’s law and (ii)the possible effects of physical and chemical reactions on the clogging of geothermal wells are ignored, three-dimensional transient flow and heat transfer process during the production and injection operation process of geothermal wells can be described as follows:
Flow field governing Equation:

Temperature field control equation:

Where:ux,uy,uzare the flow velocity at different orientations (m/s),CfandCsare the volume specific heat capacity of fluid and medium(J/m3·K),his the thickness of reservoirs (m),His the water head (m),Kx,KyandKzare hydraulic conductivities at different orientations (m/d),tis time (s),Tis the temperature (℃),μis the storage coefficient (m-1, taken as 10-5),λx,λyandλzare the thermal conductivity of reservoirs at different orientations (W/m·K).
2.2 3D geological model
Considering the boundary conditions as well as the computation time and efficiency, the scale of 3D geological model is setted as follows: 10 000 m(length) ×10 000 m (width) ×1 500 m (depth), with the plane area of 100 km2surrounding the production and injection wells (Fig. 2). In the present model, the ground depth of 0-968.6 m (Daqinggou formation to Fuxin Formation, Quaternary),968.6-1 050.4 m (the upper part of Shahai Formation) and 1 232.7-1 503.6 m (Jiufotang Formation) is simplified as impermeable layers, and 1 050.4-1 232.7 m (the lower part of Shahai Formation) is simulated as geothermal reservoirs.
2.3 Mesh generation and boundary conditions
In order to ensure the calculation accuracy and improve the calculation speed, the Triangle algorithm is used to generate the finite element meshes along the horizontal direction, and the meshes around the production and injection well is locally refined.Generally, the mesh density decreases from the production and injection well to the boundary of far field. Finally, five layers and six faces are generated in the model. Each face has 10 000 nodes and each layer has 199 914 cells. The total number of nodes and cells is 60 000 and 99 570, respectively.
In the model, both the production and injection well are located in the same layer. Both the eastern and western boundaries of the model is set as a fixed head. According to the test results, the thermal water head in the production well is+11.96 m. Considering that the groundwater flows from the west to the east, the water head at the western and eastern boundary is set to be +26.96 m and -3.04 m, respectively, in which the hydraulic gradient is 0.003.
According to the 50-year meteorological data of Tongliao Weather Station, the variation of the average land surface temperature (Ts) with the annual average ambient temperature (Ta) can be formulated as follows: Ts=1.140 6Ta+1.018 8.Therefore, when Ta is 5.5℃, Ts is 7.3℃, which is used as the boundary condition at the top of the geological model. Fig. 3 shows the vertical ground temperature distribution within the depth range of 0 m to 1 500 m, from which the geothermal heat flow is calculated to be 57.6 mW/m2, used as the constant heat flux boundary at the bottom of the model. Except the flow boundary, other side boundaries are set as the constant temperature conditions. Table 1 lists the hydrogeological and thermophysical parameters for numerical simulation, in which the porosity and hydraulic conductivity are obtained from the bore logging data, and the thermal properties of rocks and fluid are taken from partial core sampling tests and previous empirical data (Blöcher et al. 2010). Table 2 summarizes all the simulation scenarios, in which the heating period of 6 months or 183 days (October 15 to April 15) is considered.In non-heating seasons, the geothermal system does not work. It should be noted that although a long period of 50 years or 100 years is usually considered for geothermal resource evaluation. In this work, a simulation period of 30 years is used after consultation with the project owner. Operation period with such length was also used in previous studies by Xia et al. (2017), Major et al. (2018) and Ke et al. (2019).
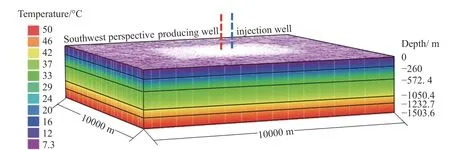
Fig. 2 3D geological model of production and injection well system
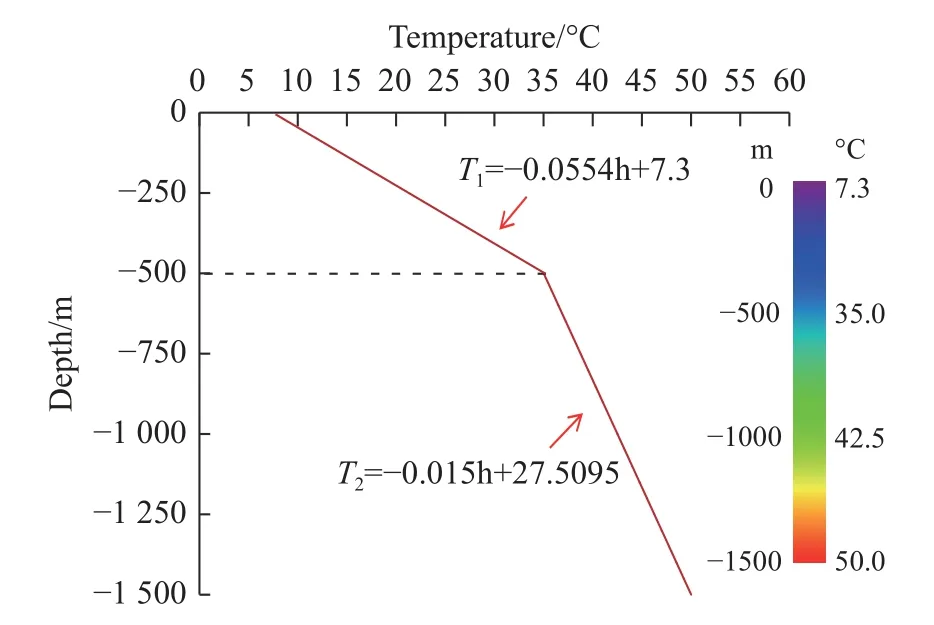
Fig. 3 Vertical ground temperature distribution
2.4 Model verification
In order to verify the reliability of the above threedimensional geological model, the water pumping test data in the production well and the water level recovery test data during the actual operation are used for comparison with simulated results.
(a) Pumping tests (February, 2017)
Pumping tests were performed in February 2017 after the completion of drilling and cleaning in the production well (BDR1#). A submersible pump QSJ50 was installed at the depth of 92.40 m. The pumping test lasted about 295 h, and Table 3 shows the complete results. Further, Fig. 4(a) shows the comparison between the observed drawdown and the simulated drawdown from the model. It can be seen that there was a good fit with the maximum relative deviation of 5.54 %.

Table 1 Hydrogeological and thermophysical parameters for simulations

Table 2 Simulation scenarios (elapsed time: 30 a)

Table 3 Geothermal water pumping test results
(b) Water level recovery tests (November, 2021)
In October 2021, the geothermal heating demonstration system in Baokang was put into operation.When the production flow rate was about 85 m3/h,the dynamic water level was steady at the depth of 74.1 m. During the temporary maintenance in November, the water level recovery test was carried out. At the same time, the water level recovery process was simulated under the same operation parameters. As shown in Fig. 4(b), there was a good agreement between the two.
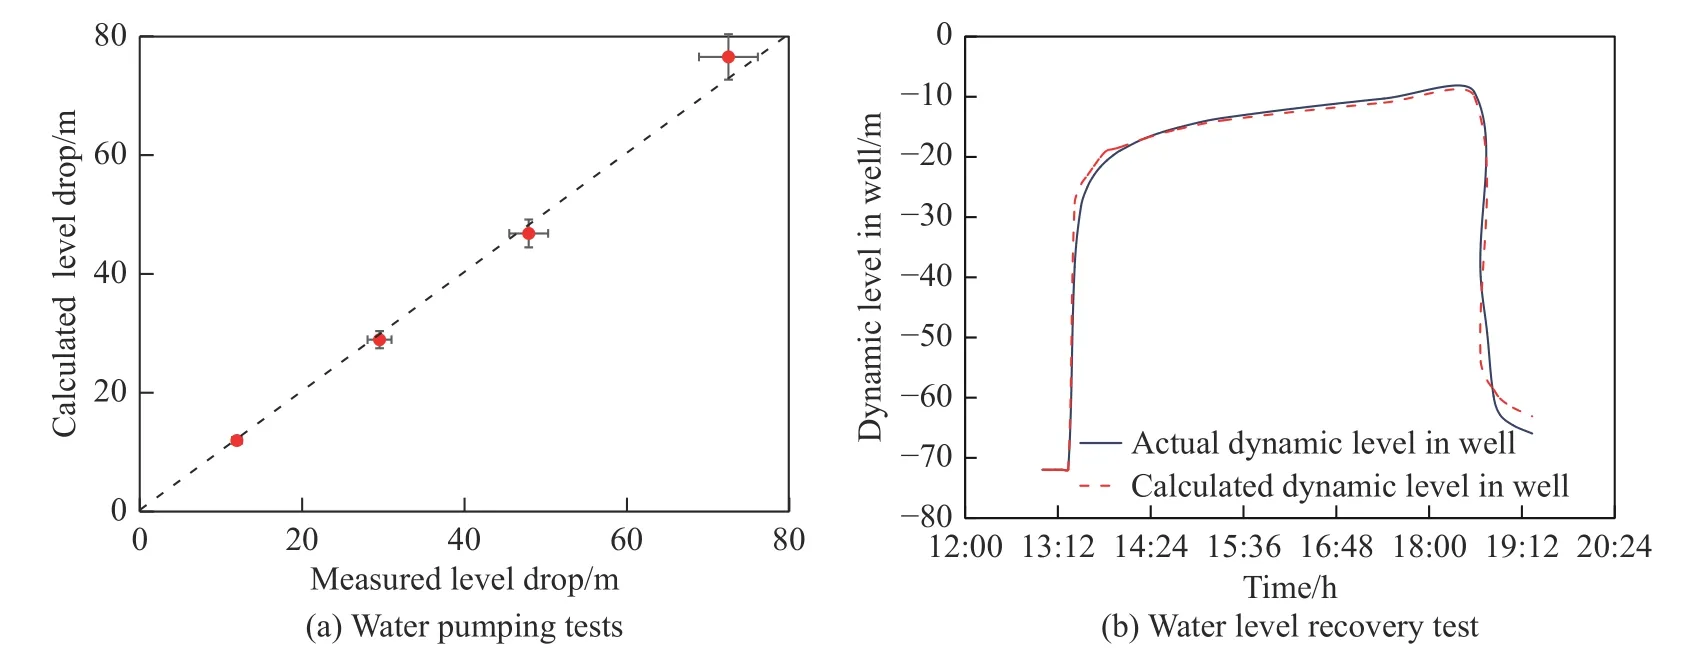
Fig. 4 Comparison between the in-situ test and simulation results
3 Optimum well spacing analysis
In the geothermal well systems, heat breakthrough refers to the fluid temperature in the pumping well drops due to the cold water entering the thermal reservoir. In any situation, the heat breakthrough is not expected. It easily occurs especially when the well spacing is too small. Up to now, there have been different understandings on the value of the temperature drop when the heat breakthrough happens. For instance, Dang et al. (2016) suggested a temperature drop of 2℃ at the bottom of pumping well as the heat breakthrough, and this definition was also adopted by Ke et al (2019). Kong et al.(2020) suggested a more rigorous temperature drop of 0.2℃. In the present work, a temperature drop of 0.2℃, 0.5℃, 1℃ and 2℃ is taken into full consideration for the purpose of a comprehensive comparison.
3.1 Well spacing estimation
For the design of medium-depth geothermal well systems in China, the spacing between the production and injection well is usually calculated based on the domestic Technical Regulations for Sandstone Injection (DZ/T 0330-2019). Under the condition that both the production and the injection keep the same flow rate, the reasonable well spacing is recommended by

Where:his the total thickness of injection sandstone layers (m),Qis the production rate(m3/a),Ris the reasonable well spacing (m),tis the operation period (a),ρwis the density of geothermal water (kg/m3),ρris the density of sandstone (kg/m3),cwis the specific heat capacity of geothermal water [J/ (kg·K)],cris the specific heat capacity of sandstone [J/ (kg·℃)],nis the porosity (%).
Under the geothermal geological conditions in the present work, the estimated designed well spacing during the operation period of 30 years with the production rate of 90 m3/h was about 208 m, in which the density of thermal water and sandstone is 998 kg/m3and 2 400 kg/m3, and the thickness and porosity of injection layers is 182.3 m and 23.4%,respectively. It should be noted that the above designed well spacing is only based on the static energy balance principle, which still needs to be further verified by the long-term dynamic flow and heat transfer process in the underground aquifers.
3.2 Optimum well spacing under different flow rates
Fig. 5 shows the variations of temperature and water level at the bottom of the production well under different well spacing (150-300 m) during the 30-year operation with the production and injection flow rate of 90 m3/h. Fig. 5(a) and Fig. 5(c) show the daily temperature variation at the bottom of production wells during 30 years of operation with different well spacing. Fig. 5 (b) and Fig. 5 (d) are smoothed from Fig. 5(a) and Fig. 5(c) to simplify the procedure of optimization.
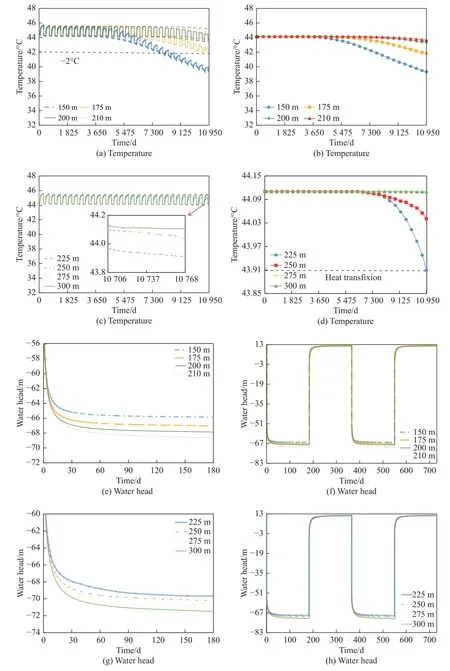
Fig. 5 Variations of temperature (a-d) and water head (e-h) in the production well under different well spacing during the 30-year operation
The simulation results show that during the longterm operation, the temperature at the bottom of the production well tends to decrease. This is caused by the fact that the temperature of the pumping fluid is gradually affected by the movement of the low temperature fluid in the injection well to the production well, which is just the mechanism how the heat breakthrough happens. Similar results were found in previous studies by Zhai (2019), Ke et al. (2019) and Kong et al. (2020). As shown in Fig. 5(b), the temperature of 44.1℃ in the production well is taken as a comparison basis. If the temperature drop of 0.5℃ is defined as the heat breakthrough, the reasonable well spacing should be 210 m under the production/injection flow rate of 90 m3/h, which is consistent with the calculation result (208 m) by the Eq. (3). This could imply the temperature drop for the heat breakthrough applied in the above-mentioned Technical Regulations for Sandstone Injection (DZ/T 0330-2019). It can also be found that when the well spacing increases from 150 m to 300 m, the water head in the production well drops quickly, although the temperature shows a relatively slower decreasing trend. This indicates that for given hydraulic conductivity in the thermal reservoir, too large well spacing is not conducive to the hydraulic replenishment of geothermal fluid from the injection well to the production well.Therefore, an optimum well spacing is crucial. If the temperature drop of 0.2℃ is considered for the heat breakthrough, the optimum well spacing should be 225 m, ensuring there is an allowable heat breakthrough and a good hydraulic connection between geothermal wells.
Fig. 6 shows the temperature distribution in the thermal reservoir with flow rate of 90 m3/h under different well spacings after the 30-year operation.It can be seen that as the well spacing increases,the effect of the cold front of the injection fluid on the production well gradually fades away, thereby appearing a lowering of the thermal breakthrough.In addition, the shape of the temperature field surrounding the injection well tends to be varying from an eccentric to concentric circular, as the well spacing increases. Fig. 6(c) shows the temperature field under the optimum well spacing of 225 m to avoid the heat breakthrough.
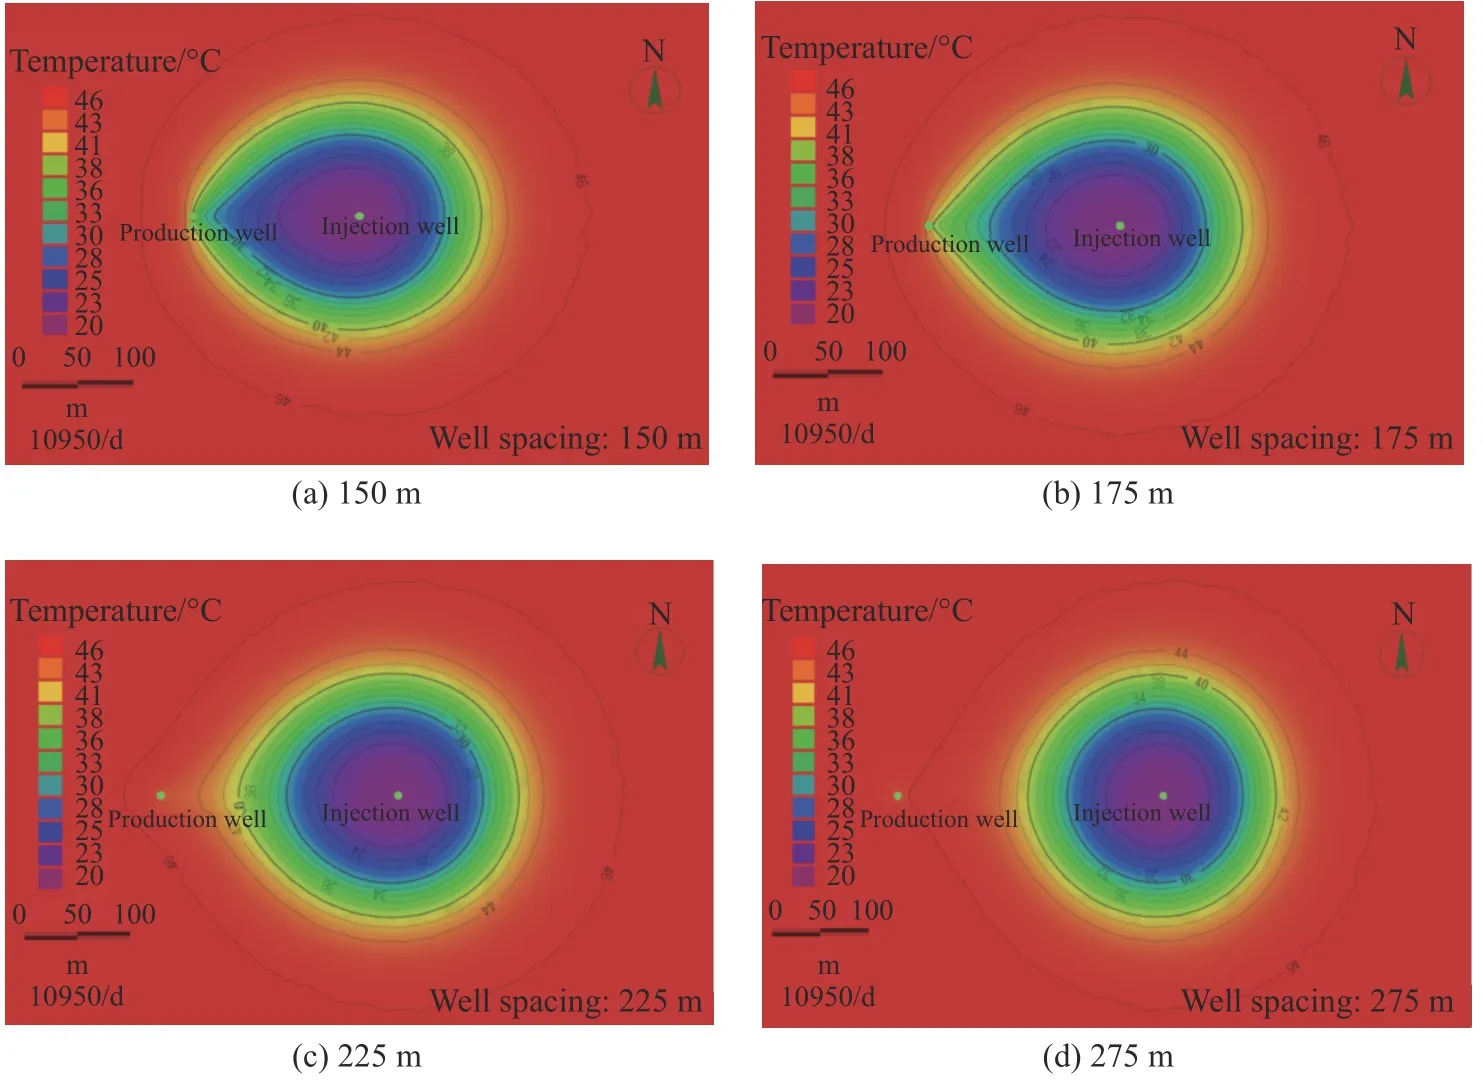
Fig. 6 The temperature distribution in thermal reservoir under different well spacing after the 30-year operation
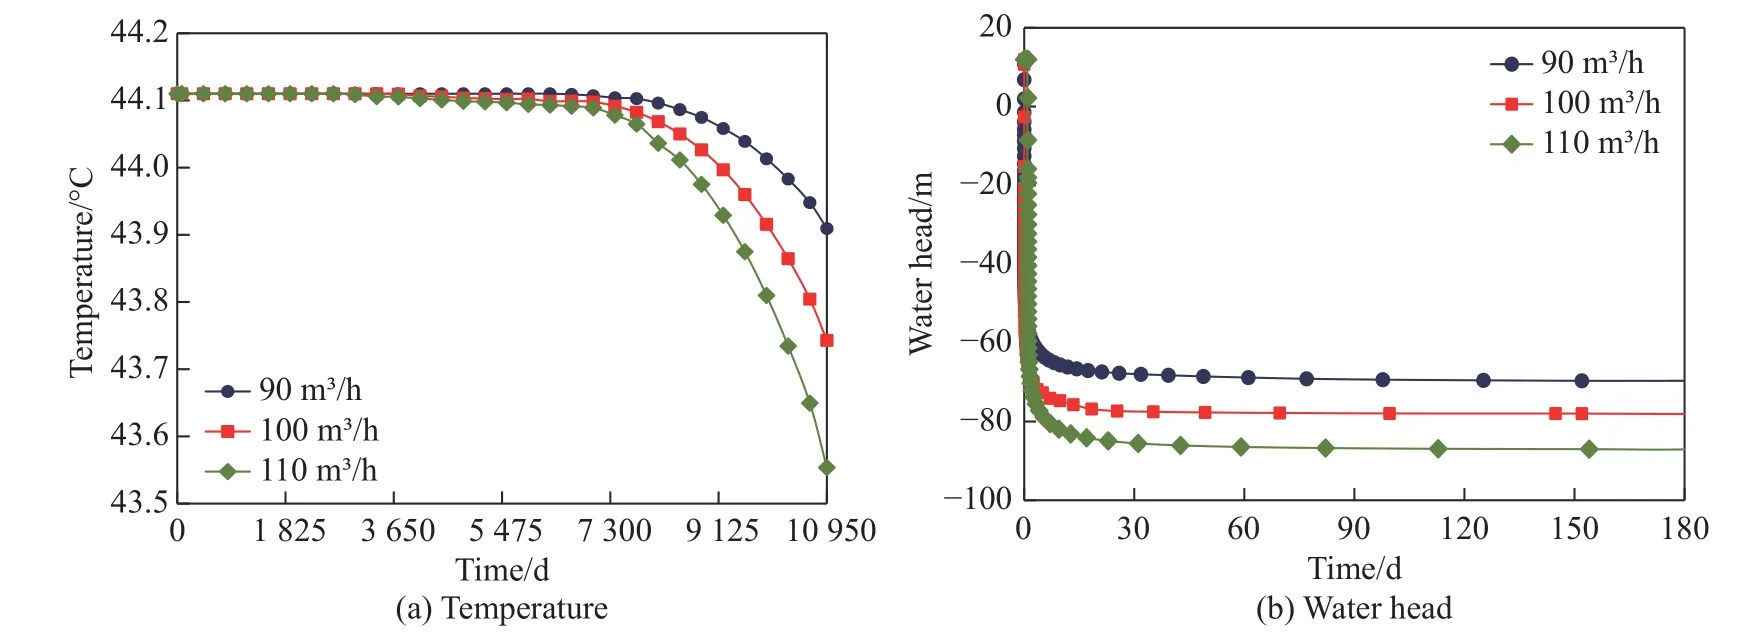
Fig. 7 Variations of temperature and water head in the production well under different flow rates
Fig. 7 shows the variations of temperature and water head in the production well with the flow rate of 90 m3/h, 100 m3/h and 110 m3/h, which cover most of the flow rate range during the actual operation for well spacing 210 m. It can be seen that as the flow rate increases, both the temperature drop and the water head drop tend to be increasing,indicating an earlier occurrence of the thermal breakthrough. In fact, this is mostly because that under large production and injection flow rates, the hydraulic connection will be enhanced due to the increased hydraulic gradient. Therefore, under high flow rates, a large well spacing is required to prevent the heat breakthrough. In this case, when the flow rate is 100 m3/h and 110 m3/h, the optimum well spacing will be a higher value of 235 m and 245 m, respectively, compared with that of 90 m3/h (225 m).
Table 4 summarizes the optimum well spacing under three production and injection flow rates. It can be seen that when the flow rate ranges from 90 to 110 m3/h, the optimum well spacing increases from 225 m to 245 m, respectively, with an average value of 235 m. During the actual operation of the geothermal heating demonstration system in Baokang in the winter of 2021, it was found that the flow rate varied typically from 80 m3/h to 90 m3/h, providing a satisfied heating capacity to keep a high room temperature of 24-26℃. The actual well spacing is 250 m, covering the above range of optimum values. This indicates that there is a low probability of the thermal breakthrough occurred in the present geothermal heating system under long term operation, which is supported by the simulation results and part of actual operation data.Of course, a long term monitoring is still very necessary, which is expected to be reported in our later studies.

Table 4 Optimum well spacing under different flow rates
4 Analysis of influencing factors on production and injection
4.1 Effects of injection well orientations
According to the hydrogeological conditions of the study area (Fig. 1), the natural groundwater flow tends to be from the west to the east. Fig. 8 shows the variations of the temperature and water head in the production well under four injection well orientations, i.e. east, west, south and north, in which the well spacing and flow rate are 225 m and 90 m3/h,respectively. It can be seen that when the injection well is located in the west of the production well or the upstream of the natural flow field, the highest temperature drop and water head drop would happen in the production well. When the injection well is located in the east of the production well or the downstream of the natural flow field, the lowest temperature drop and water head drop would occur in the production well. For the above two situations, the deviation on the temperature andwater head is 0.1℃ and 0.52 m, respectively. In addition, if the injection well is located in the north and south of the production well, the temperature and water head in the production well will keep the same varying trend, as the result of the same effects of artificial and natural flow field around geothermal wells. After comparison, it is recommended that the location of the injection well should be arranged in the downstream of the natural flow field (or the east of the producing well in this work). This result is also supported by previously similar studies (Kong et al. 2017). It should also be noted that for large scale geothermal heating systems with multiple production and injection wells and complex layout of buildings, there may still be difficulties when applying the downstream-first principle. For such situations, a comprehensive analysis based on numerical simulation is absolutely necessary (Irtek and Serhat, 2003;Kong et al. 2020).

Fig. 8 Variations of temperature and water head in the production well under different injection well orientations
4.2 Effects of injection temperatures
In the above calculations and analysis, the injection temperature is set as 20℃. As discussed, different injection temperatures may create a difference thermal driving force between the production and the injection wells, thereby affecting the evolution of the temperature and flow field around geothermal wells. Fig. 9 shows the variations of temperature and water head in the production well under the injection temperature of 10-35℃, covering most of the injection temperature range during the actual operation, in which the well spacing and production and injection flow rate are 225 m and 90 m3/h, respectively. For instance, when the heating load of user buildings is low at the early or late stage of the whole heating season, the heat pump unit does not work and the temperature difference on the heat source side of primary plate heat exchanger (PPHE) ranges from 5℃ to 8℃,with the corresponding injection temperature of 34℃ to 37℃. On the contrary, when the heating load of user buildings is very high during the coldest days of the heating season, both the PPHE and the heat pump unit operate at full capacity, the temperature difference on the heat source side of PPHE can reach 15℃, with the corresponding injection temperature of about 27℃. If another heat pump unit is considered for geothermal cascade utilization, the above temperature difference will be higher, with a lower injection temperature.Under the present calculation conditions, only when the injection temperature is 10℃, the temperature drop in the production well at the end of operation exceeds 0.2℃. Therefore, as long as the injection temperature is higher than 15℃,preferably around 20℃, the heat breakthrough can be effectively avoided. In addition, the injection temperature of less than 25℃ is recommended according to the national standard Technical Specification for Geothermal Space Heating Engineering (CJJ 138-2010).
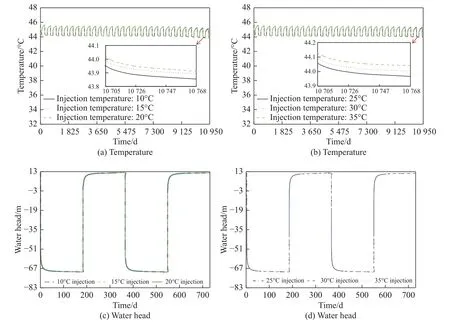
Fig. 9 Variations of temperature and water head in the production well under different injection temperatures
Fig. 10 shows the influence radius of the cold front with injection temperature varying from 10℃to 35℃. It can be seen that as the injection temperature increases, influence radius decreases from 258 m to 252 m. This indicates that a lower injection temperature can bring a higher risk of heat breakthrough. On the other hand, as mentioned above, a lower injection temperature is usually introduced by the geothermal cascade utilization, which is beneficial to provide the highest heating capacity and helps to achieve the highest energy efficiency.Therefore, considering the long-term operation safety of geothermal wells, it is recommended that the cascade utilization of geothermal wells should be applied on the premise of the effective control on the heat breakthrough, and especially the injection temperature should be able to match the actual heating loads of user buildings. This is essentially an optimum problem on the whole geothermal heating system.
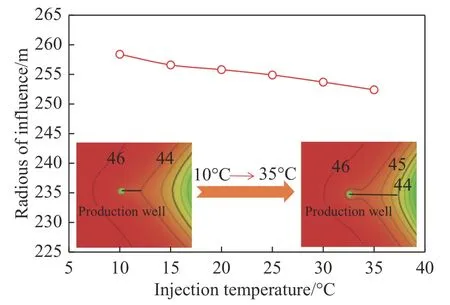
Fig. 10 Influence radius of the cold front of injection water under different injection temperatures
4.3 Effects of injection ratios
Fig. 11 shows the variations of temperature and water head in the production well under the injection ratios of 0-100%, in which the well spacing and flow rate are 225 m and 90 m3/h, respectively,and the injection temperature is 20℃. It can be seen that as the injection rate increases, the temperature drop and water head drop in the production well show an increasing and decreasing trend, respectively. However, compared with temperature,water head drop is more important for the stable operation of geothermal systems (Zhang et al.2016). In the present calculations, when the injection ratio is 0% and 100%, the water head in the production well drops by 2.49 m and 0.08 m, respectively, at the end of 30-year operation. Therefore, for the long term operation safety of geothermal systems as well as the sustainable development and utilization of geothermal resources,the injection ratio of 100% is strongly recommended and should be strictly carried out.During the practical engineering, there is still a difficult technical problem for the complete injection in the sandstone reservoirs (such as Minghuazhen or Guantao Formation, Neogene in North China), which is quite different from the situation in baserock reservoirs (Wang et al. 2018). The experiences from the last decades have showed that there are too many geothermal wells with low injection ratios, and the ground water level is falling sharply in medium-depth geothermal reservoirs in some areas including the Beijing-Tianjin-Hebei region (Wang et al. 2017b). For such a situation, the principle of ‘production according to injection’ should be adopted, and the practice of more production and less injection should be prohibited.

Fig. 11 Variations of temperature and water head in the production well under different injection ratios
5 Conclusions
(1) The numerical simulation result shows that under the present geothermal geological conditions and with a 30-year operation period, when the production flow rate varies from 90 m3/h to 110 m3/h,the optimum well spacing increases from 225 m to 245 m, respectively, with an average value of 235 m, which is much lower than the actual well spacing of 250 m, indicating that for the present geothermal heating system, the occurrence of thermal breakthrough has a low probability under the long term operation.
(2) With the decrease of the injection temperature, the cold front of the injection water has an increasing influence on the temperature of the production well. Under the present simulation conditions, the injection temperature of more than 15℃,preferably 20℃, is recommended in order to avoid or alleviate the heat breakthrough. It is also recommended that the injection well should be located in the downstream of the natural flow field.
(3) For the long term operation safety of geothermal systems as well as the sustainable development and utilization of geothermal resources, the injection ratio of 100% is recommended. During the practical engineering, considering the technical difficulty for the complete injection in some sandstone reservoirs, the principle of ‘production according to injection’ should be adopted, and the practice of more production and less injection should be prohibited.
Acknowledgement
This work was supported by China Geological Survey Program (DD20190128) and Natural Science Foundation of Hebei Province (No. E2022202082).Especially, thanks the editor and anonymous reviewers for their helpful suggestions on the quality improvement of final manuscript.
杂志排行
地下水科学与工程(英文版)的其它文章
- Spatial confirmation of termite mounds as Bio-geo indicator for groundwater occurrences using ground magnetic survey: A case study from Perambalur Region of Tamil Nadu, India
- Research on the characteristics and influencing factors of terrestrial heat flow in Guizhou Province
- Comparative analysis of bacterial contamination in tap and groundwater: A case study on water quality of Quetta City, an arid zone in Pakistan
- Holistic approach of GIS based Multi-Criteria Decision Analysis (MCDA)and WetSpass models to evaluate groundwater potential in Gelana watershed of Ethiopia
- Genetic model and exploration target area of geothermal resources in Hongtang Area, Xiamen, China
- Assessment of water level threshold for groundwater restoration and overexploitation remediation the Beijing-Tianjin-Hebei Plain
