Research on the characteristics and influencing factors of terrestrial heat flow in Guizhou Province
2022-06-27ShuaichaoWeiFengLiuWeiZhangGuilingWangRuoxiYuanYuzhongLiaoXiaoxueYan
Shuai-chao Wei, Feng Liu,3, Wei Zhang, Gui-ling Wang*, Ruo-xi Yuan, Yu-zhong Liao, Xiao-xue Yan
1 Institute of Hydrogeology and Environmental Geology, Chinese Academy of Geological Sciences, Shijiazhuang 050061, China.
2 Technology Innovation Center of Geothermal & Hot Dry Rock Exploration and Development, Ministry of Natural Resources, Shijiazhuang 050061, China.
3 China University of Geosciences (Beijing), Beijing 100083, China.
Abstract: Terrestrial heat flow is an important physical parameter in the study of heat transfer and thermal structure of the earth and it has great significance in the genesis and development and utilization potential of regional geothermal resources. Although several breakthroughs in geothermal exploration have been made in Guizhou Province. The terrestrial heat flow in this area has not been properly measured, restricting the development of geothermal resources in the province. For this reason, the terrestrial heat flow in Guizhou was measured in this study, during which the characteristics of heat flow were determined using borehole thermometry, geothermal monitoring and thermal property testing. Moreover, the influencing factors of the terrestrial heat flow were analyzed. The results show that the thermal conductivity of rocks ranges from 2.0 W/(m·K) to 5.0 W/(m·K), with an average of 3.399 W/(m·K); the heat flow varies from 30.27 mW/m2 to 157.55 mW/m2, with an average of 65.26 ± 20.93 mW/m2, which is slightly higher than that of the average heat flow in entire land area in China. The heat flow in Guizhou generally follows a dumbbell-shaped distribution, with high values present in the east and west and low values occurring in the north and south.The terrestrial heat flow is related to the burial depths of the Moho and Curie surface. The basaltic eruptions in the Emeishan led to a thinner lithosphere, thicker crust and lateral emplacement, which dominated the basic pattern of heat flow distribution in Guizhou. In addition, the dichotomous structure of regional active faults and concealed deep faults jointly control the heat transfer channels and thus influence the terrestrial heat flow.
Keywords: Thermal conductivity; Terrestrial heat flow; Moho; Curie surface; Emeishan basaltic
Introduction
The terrestrial heat flow (heat flow in short) directly reflects the thermal processes inside the Earth(Wang and Huang, 1990; Jiang et al. 2019; Yang et al. 2020; Zhang et al. 2021; Chen et al. 2022) and is a fundamental physical parameter for characterizing the heat transfer in the Earth from inside to outside. Moreover, the heat flow is one of the most critical parameters for study of regional geothermal fields, lithospheric thermal structures and tectonic evolution, and for geothermal resources assessment(Wang et al. 2021; He, 2015; Furlong and Chapman, 2013; Rolandone et al. 2013; Grall et al.2012; Zhang et al. 2019; Wang et al. 2020; Li et al.2021). In the case of one-dimensional steady-state conduction, heat flow is calculated by multiplying the average rock thermal conductivity of the cross section and the average geothermal gradient of that section (Wang, 2015; Liu et al. 2020a).
Wang et al. (1990) carried out the earliest study on the heat flow in Guizhou Province, obtaining estimated heat flow of 29.3-58.45 mW/m2in 24 boreholes, with an average of 45.95 mW/m2, which can roughly reflect the regional geothermal conditions. A study by Yuan et al. (2006) suggest that Guizhou is in the middle-low temperature geothermal gradient zone, the geothermal gradient is 20-25℃/km and heat flow is 40-60 mW/m2. Heat flow was found to be high in the west and low in the east, while Xing et al. (2007) reported a slightly lower range of 30-50 mW/m2. Until now,only two measured heat flow points have been published in Guizhou, both of which are in Guiyang city and the heat flow was measured at 63.40 mW/m2and 67.19 mW/m2, respectively (Wu et al. 2012).
In recent years, Guizhou has been actively promoting itself as the “Hot Spring Province of China”. The amount of geothermal exploration and the number of geothermal wells in the province have been increasing, offering great potential for the development and utilization of geothermal resources. Many studies have been conducted on geothermal exploration technology and theory(Wang and Wang, 2007; Lu et al. 2013; Zhang et al. 2014; Duan et al. 2015; Yang et al. 2018; Ban et al. 2018; Zhu, 2020), but most of them are limited to a site scale and do not cover the whole province. As a result, the heat flow of most areas in Guizhou has not previously been measured (Jiang et al. 2016). This gap has restricted the study of geothermal resource exploration and distribution patterns in the province. In 2020, the project team of the project entitledNational Geothermal Heat Flow Value Measurement and Target Area Selectionorganized by the China Geological Survey carried out heat flow measurements in Guizhou. In this study, borehole temperatures, collected rock samples were measured, and thermal property tests of rocks were conducted across the province. Then,based on the collected data and measurements, the heat flow values were compiled and analyzed, and a primary distribution map of heat flow was generated in Guizhou Province. Finally, this study analyzed the influencing factors of the heat flow and made suggestions regarding the key areas of the future exploration and research on geothermal resources in Guizhou.
1 Regional geothermal geological characteristic
Guizhou is located at the intersection of the Upper Yangtze Block and the Jiangnan Orogenic Belt(Fig. 1a). Since the Neoproterozoic, Guizhou has undergone several phases of tectonic activities.Influenced by the Tethys Tectonic Domain and the Jiangnan Orogenic Belt, deep structures have controlled the paleogeographic pattern, tectonic unit delineation, geological evolution and context of mineralization in the region (Wang et al. 2021;Dai et al. 2013). Active faults have mainly developed in the north-west, north-east and nearlynorth-south directions. Among them, the Pu’an-Guiyang-northern Fanjingshan fault zone divides the Upper Yangtze Block and the Jiangnan Orogenic Belt. There are obvious differences in geological setting, geophysics, and geochemistry on both sides of the fault zone (GSGP, 2017). A relatively complete strata has developed in Guizhou and all strata from the Neogene to the Quaternary are exposed. The outcrops mainly consist of sedimentary rocks dominated by carbonates and epimetamorphic sedimentary rocks dominated by greenschist facies, followed by a few igneous and deeply metamorphic rocks. Among these outcrops, carbonates are the most widely distributed, accounting for about 61.9% of the province’s area (GSGP,2017).
Hydrocensus show that there are currently a total of 212 hot springs and geothermal wells in Guizhou, including 36 geothermal wells, 84 exploitable geothermal wells, and 92 artesian hot springs(Fig. 1b; Wang et al. 2018). In addition, hot springs of 20-24℃ account for 16% of the province’s geothermal resources, 25-40℃ account for 52%,40-60℃ account for 31%, and 60-90℃ account for only 1%. Most of the hot springs fall in the warm water category in low-temperature geothermal resources (Yang et al. 2015). According to the tectonic genesis, there are two types of underground geothermal water in Guizhou: Uplifted mountain type and sedimentary basin type. The former is more widely distributed in the province and mainly consists of two types of folded zones in terms of tectonic style, namely the Jura and Jiangnan types.The latter is distributed in Chishui and Xishui areas in Guizhou. High temperature contributes to the horizontal circulation of groundwater in the Permian and Triassic carbonate rocks, leading to the formation of thermal brines associated with oil and gas (Wang et al. 2018).
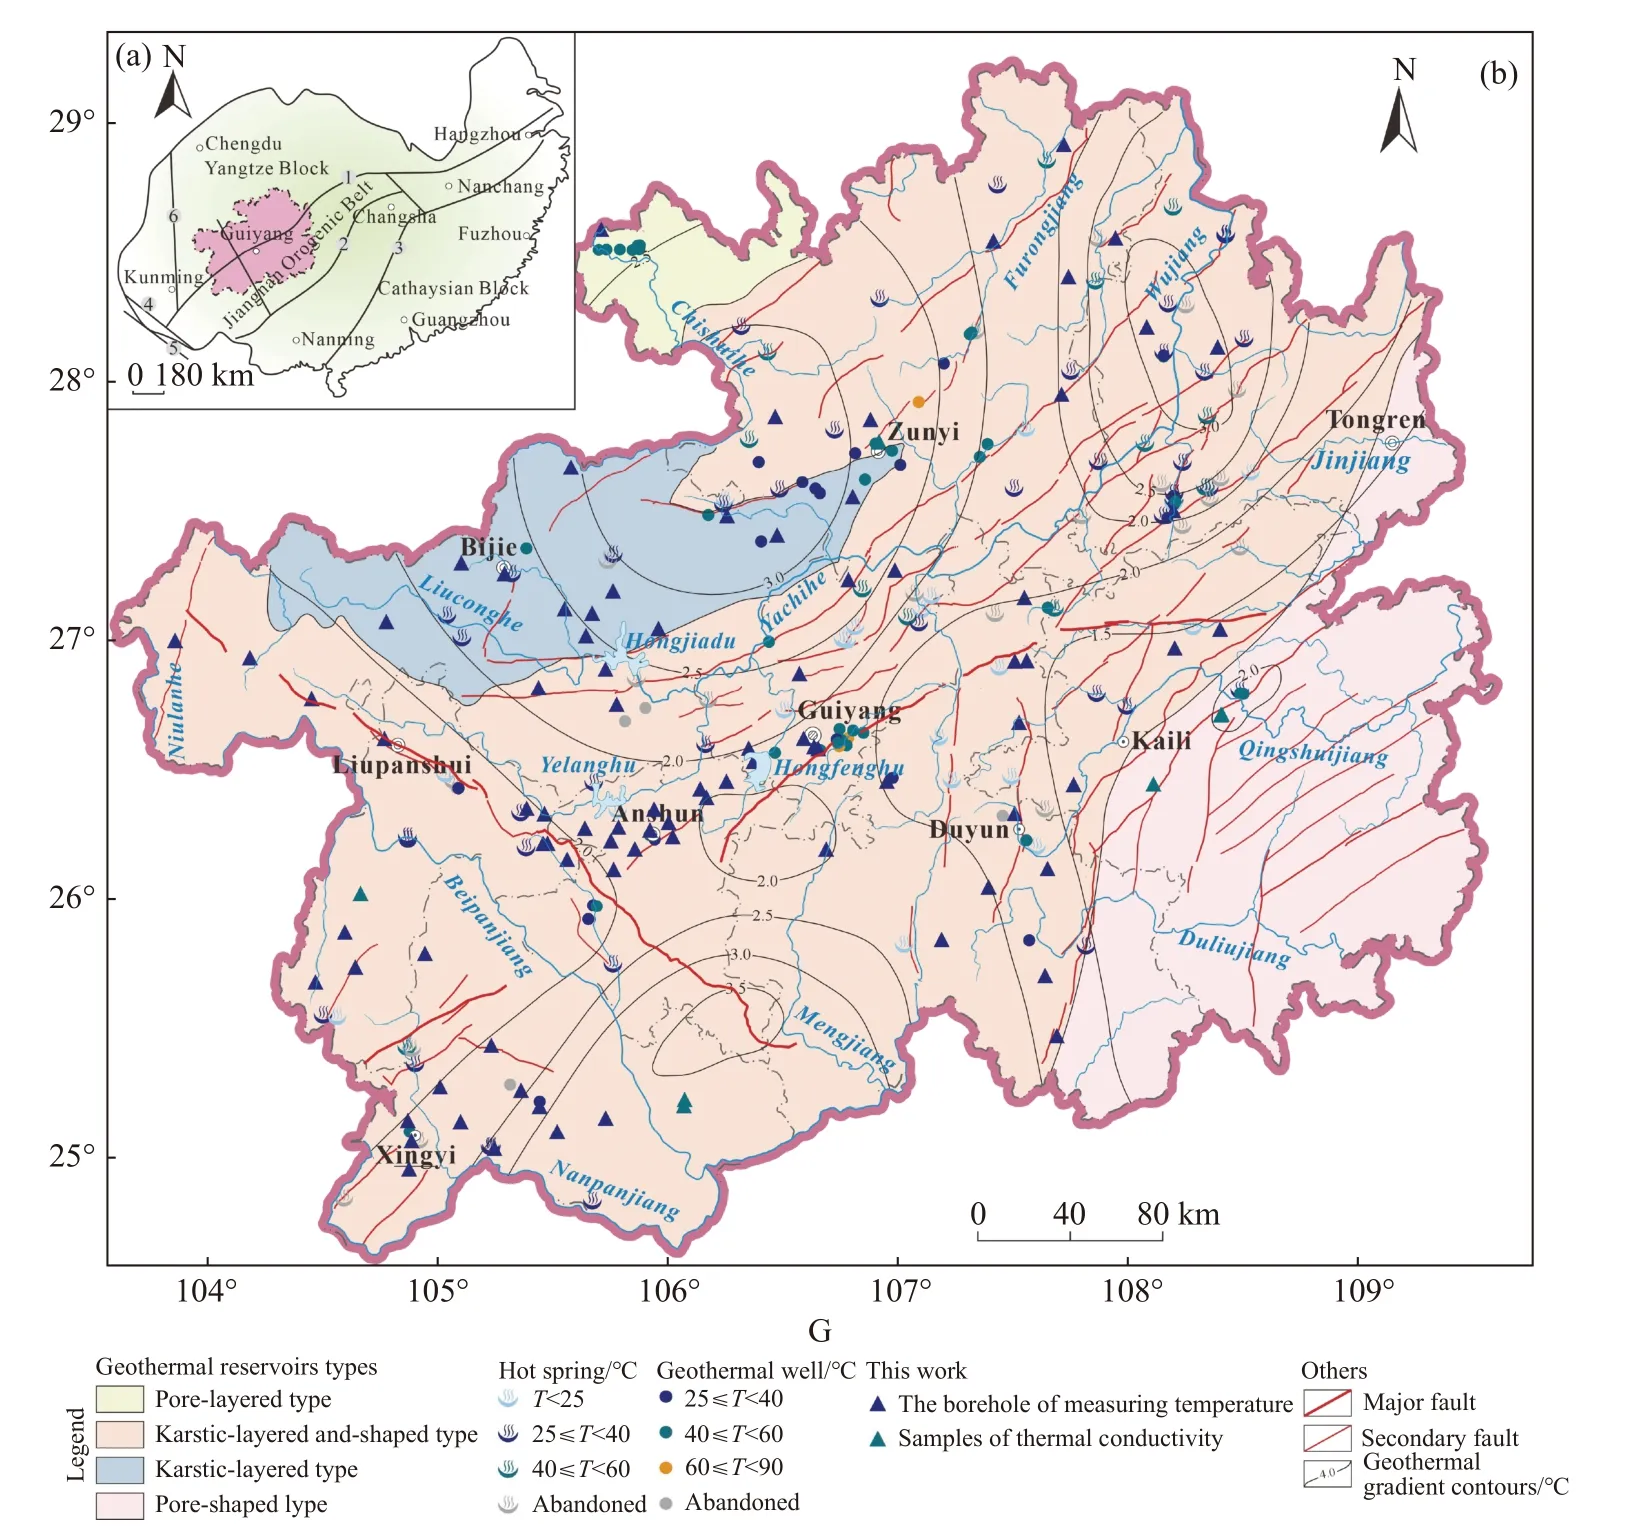
Fig. 1 (a) Map showing the geotectonic location of Guizhou Province (modified from Dai et al. 2013); (b)Geological map showing geothermal resources in Guizhou Province (modified from Wang et al. 2018)
2 Sampling and tests
Geothermal logging and monitoring were carried out in 85 boreholes. The JGS-1B intelligent engineering logging instrument produced by the Chongqing Geological Instrument Factory was used for geothermal logging. It has a measurement range of 0.1-80℃ and an accuracy of 0.5℃. The geothermal monitoring was carried out using a TD-016C geothermal monitoring system manufactured by Beijing Hongou Chengyun Instrument and Equipment Co., Ltd, which has a measurement range of 0-90℃, a resolution of 0.05℃, and an accuracy of 0.2℃ (Liu et al. 2020a). The temperature measurements were carried out when the borehole was in steady-state or quasi-steady-state conditions.
A total of 66 thermal conductivity samples in 34 groups were collected from the Upper Paleozoic to Triassic strata. They are composed of siliceous tuff, marl, tuff, muddy dolomite, dolomite, siltstone, siltstone, fine sandstone, metamorphic tuff and slate. All the samples were either borehole cores or rocks collected from the core strata at the ground surface near the boreholes. The samples were collected in Anshun, Zunyi, Bijie, Liupanshui, Xinyi, Duyun, Kaili and Tongren areas in Guizhou (Fig. 1).
The thermal conductivity tests of rocks were performed by the Donghua University of Science and Technology and the Tianjin Rockcord Technology Co., Ltd. using a Thermal Conductivity Scanning (TCS) automatic thermal conductivity scanner made by a Germany company and a flat film thermal analyzer TC3200 made by Xi’an Xiaxi Electronic Technology Co., which have a measurement range of 0.2-25 W/(m·K) and measurement accuracy of 3% (Liu et al. 2020a).
3 Results
3.1 Thermal conductivities of rocks
The test results are shown in Table 1. Most of the thermal conductivities of the collected rocks are within 2.0-5.0 W/(m·K), with an average of 3.399 W/(m·K), a minimum of 1.523 W/(m·K), and a maximum of 5.533 W/(m·K). According to the thermal conductivity statistics of different lithologies, the average of thermal conductivity is in the order of sandy mudstones (2.322 5 W/(m·K)) < siltstones (3.013 W/(m·K)) < marls (3.05 W/(m·K)) <limestones (3.096 (W/(m·K)) < tuffs (3.33 W/(m·K)) < siliceous limestones (3.562 W/(m·K)) <slates (3.611W/(m·K)) < fine-grained sandstones(3.981W/(m·K)) < dolomites (3.981W/(m·K)) <muddy dolomites (4.031W/(m·K)). In addition, the thermal conductivities of dolomite and chert vary the most, with a wide rage of up to 3.3 W/(m·K).This variation may be due to differences in mineral composition, rock structures and stratigraphy(Song et al. 2019).
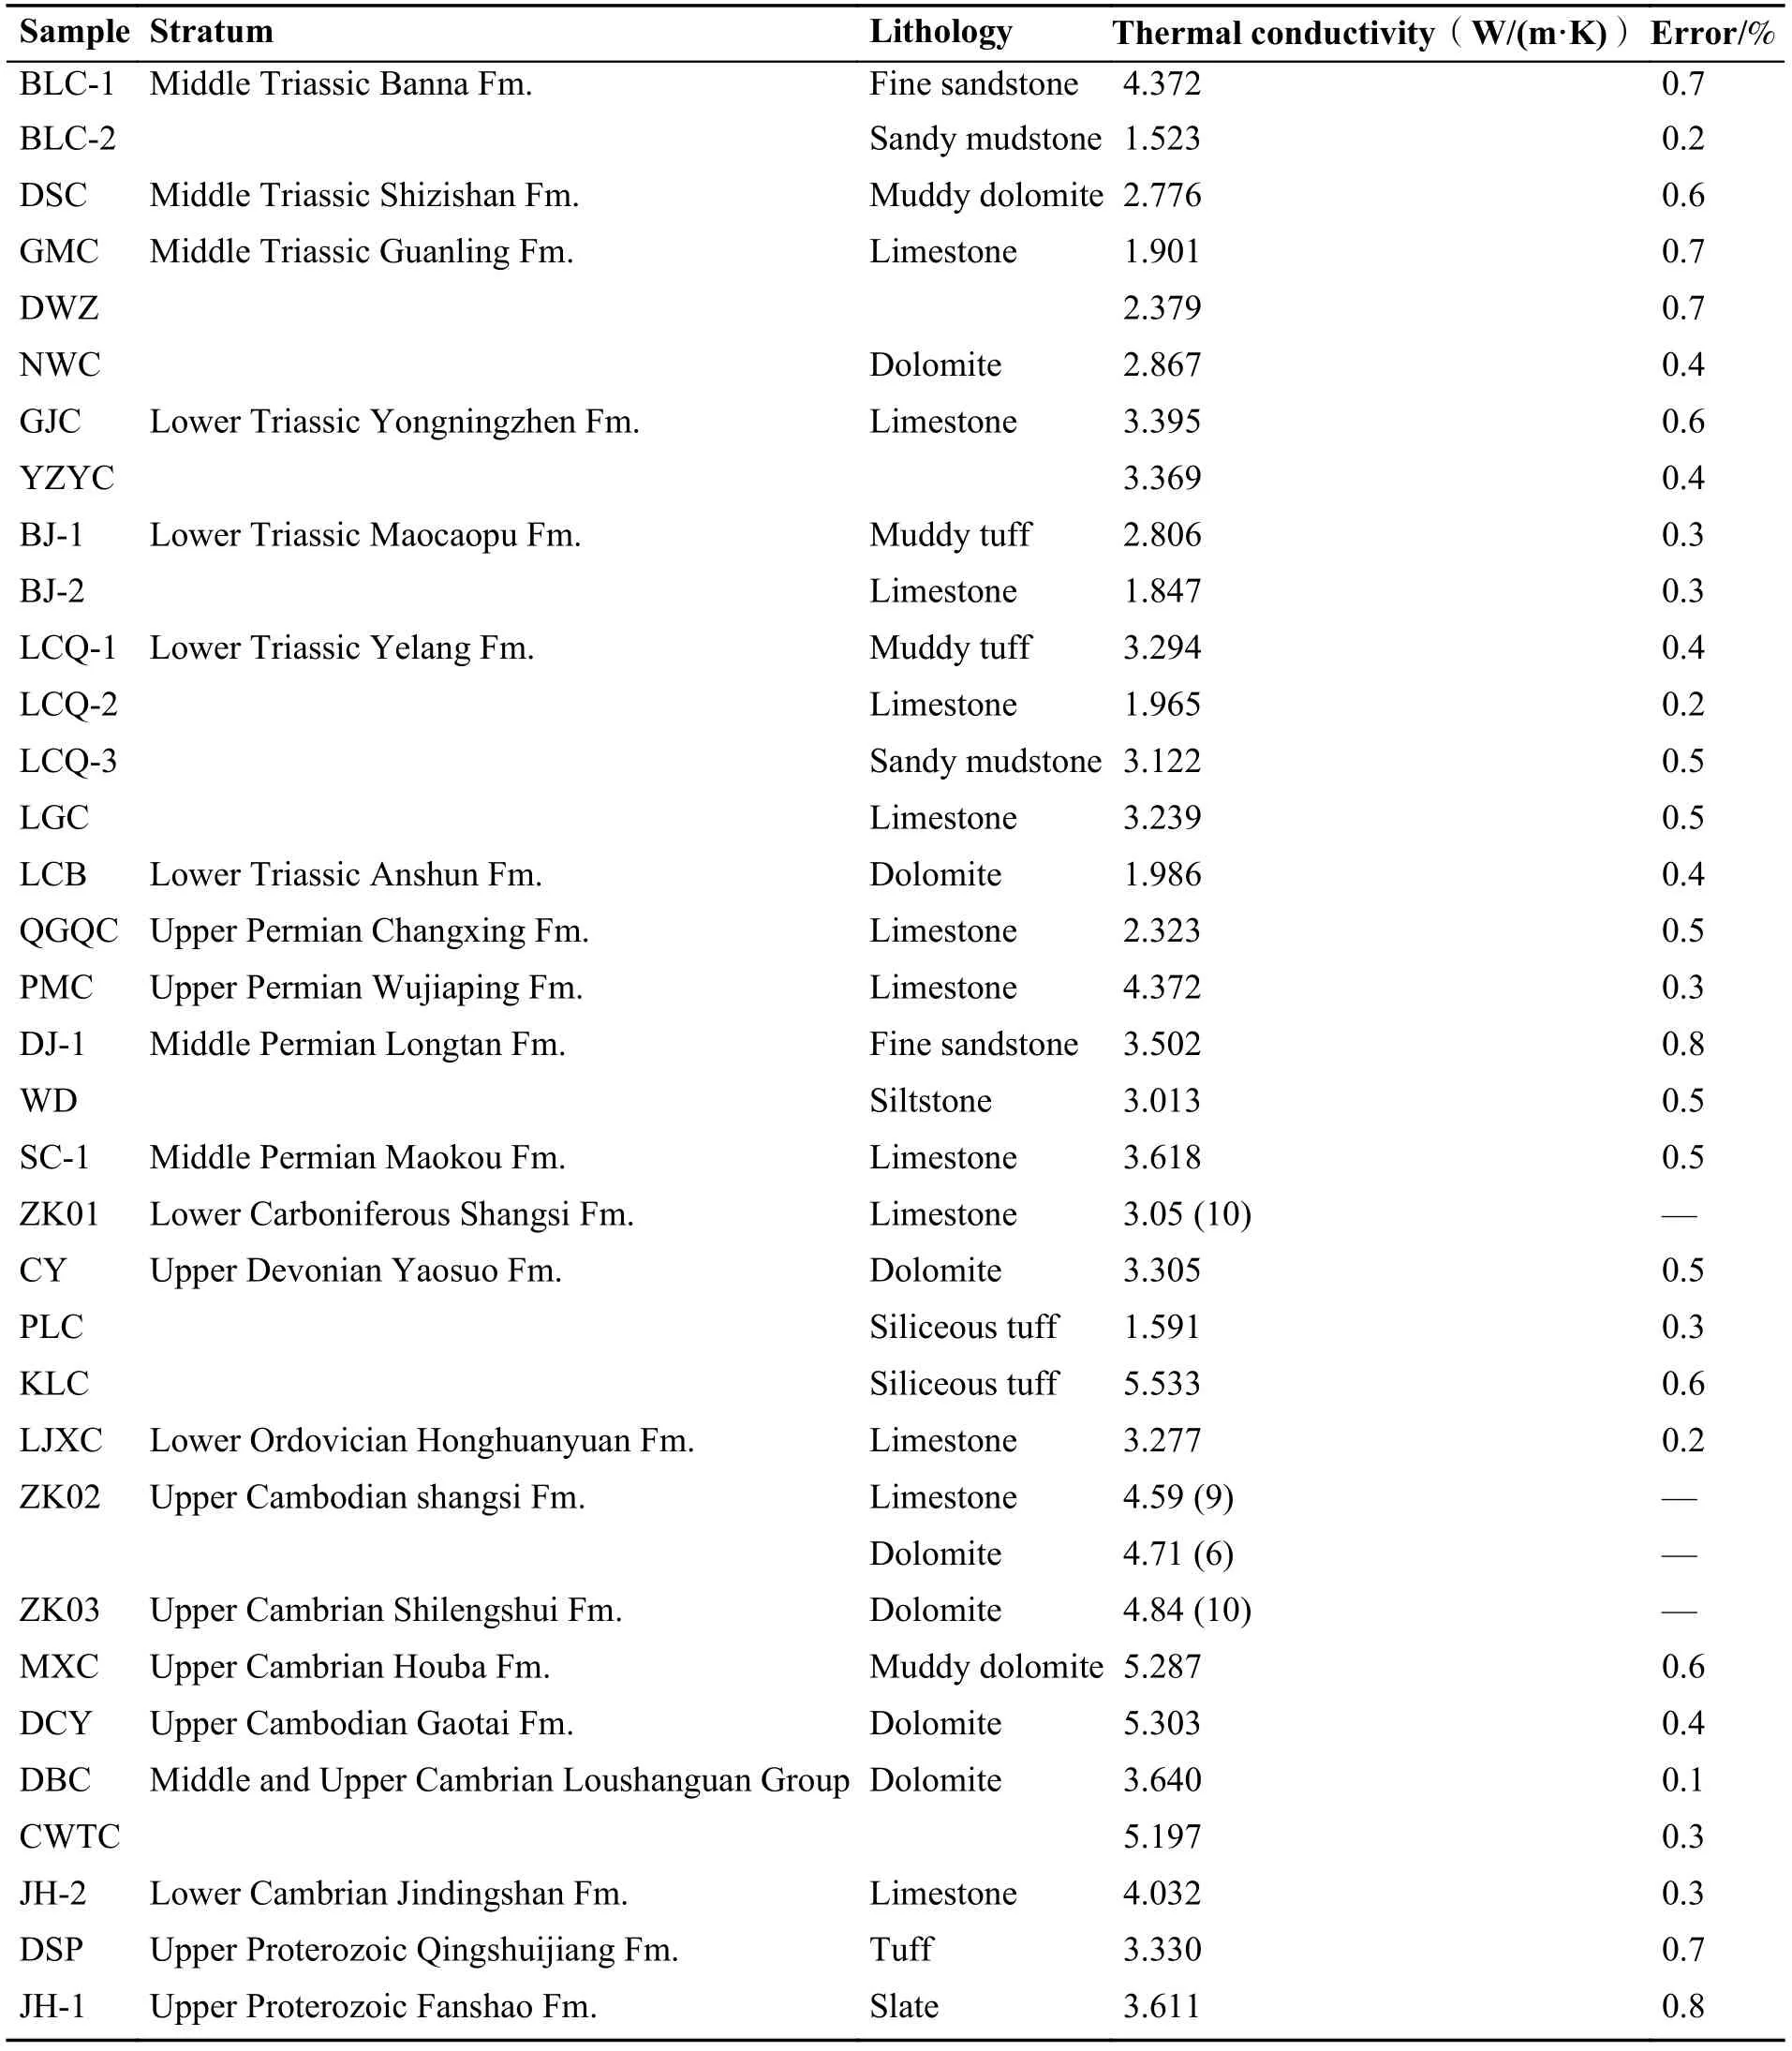
Table 1 Test results of rock thermal conductivity in the study area
The thermal conductivities obtained in this study are basically consistent with those published by Song et al. (2019) in Table 2, while dolomite and tuff have slightly lower values and the rest have slightly higher values than the average value.
Comparing our results with results from the same lithologies in North China (Chen et al. 1988), Northwest China (Wang et al. 1995), and Southeast China (Xiong et al. 1994) (Table 2), it can be found that the present thermal conductivity of mudstones in Guizhou is close to that in Northwest China,higher than that in North China, and lower than that in Southeast China. The thermal conductivities of siltstones and tuffs in Guizhou are close to those in Southeast China and higher than those in North and Northwest China. The thermal conductivities of marls in Guizhou are significantly higher than those in North China and Southeast China. In addition, the thermal conductivities of dolomites and tuffs in Guizhou are close to those in North China and higher than those in Northwest China and Southeast China.
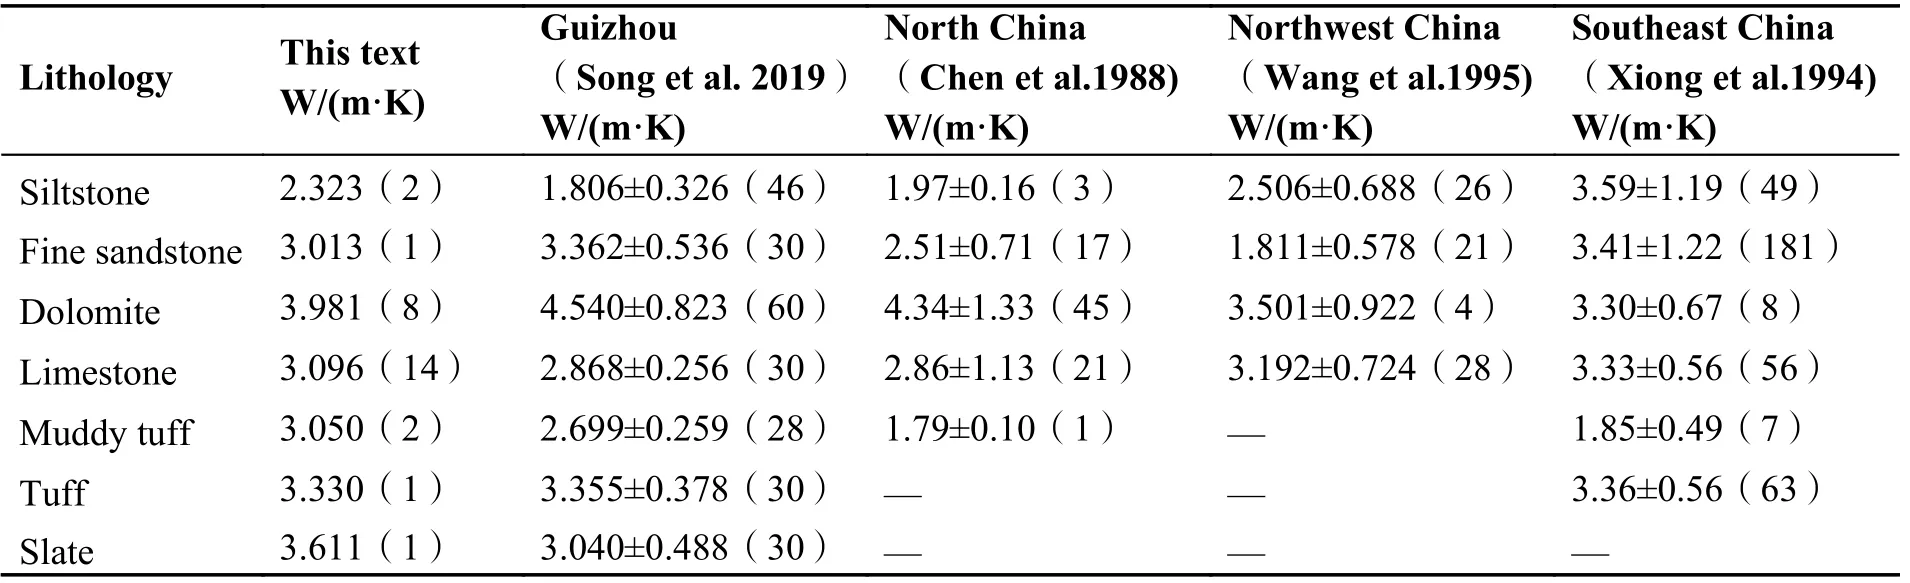
Table 2 Comparison of thermal conductivity statistics of different lithologies with other regions
3.2 Measurement and distribution of heat flow
To calculate the heat flow, the following equation was used to determine the heat flow densityqunder one-dimensional steady-state heat transfer conditions (Liu et al. 2020b):
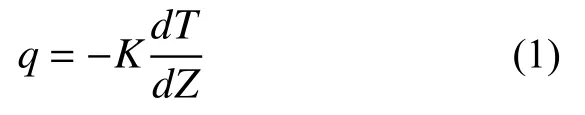
Where:qis the density of heat flow (mW/m2), -indicating that the direction ofqis vertically upward;is the geothermal gradient (℃/km);Kis the thermal conductivity (W/(m·K)) of rocks in the measured well section.
After obtaining the geothermal gradient of the borehole and the thermal conductivity of rocks in the measured well section, the heat flow was estimated using the segmentation method (Liu et al. 2020a) as follows:
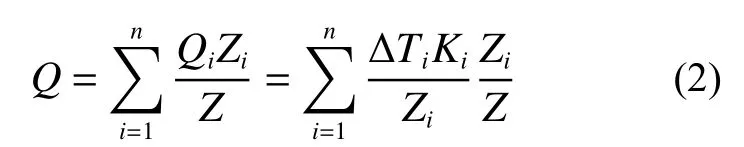
Where:Qis the total heat flow;Qiis the heat flow at a measured sectionZi; ΔTi/Ziis the product of the geothermal gradientand,Kiis the thermal conductivity of the measured section;Zis the total length of all measured sections.
In the real condition, the logging curves will show up-concave and down-convex jagged fluctuations because of the groundwater movement and the difference in thermal properties across the tectonic interface in Fig. 2 (Zhang et al. 2020; Mao et al. 2019). To identify the segment that reflects the changes in the formation temperature, it is necessary to screen out the pure heat conduction segment from the curve, where the temperature linearly increases with depth. The actual geothermal gradients can then be estimated using linear fitting method. The approach was applied on the temperature curve of 43 boreholes that can roughly represent the geothermal fields in the study area(GBBGMEDGP, 2015; Ban et al. 2018; Tu et al,2019; Chen et al. 2014; Hou, 2016; Wu et al. 2012;Tian, 2016; Yuan, 1997; Song et al. 2012; Fang et al. 2020; Zhang and Li, 2015; Lu et al. 2013; Ding et al. 2019; Mu and Wu, 2021). The coefficient of determination (R2) is used to assess the goodness of the fit. When R2>0.95, the temperature curve of the selected section is considered representative of the geothermal characteristics of the borehole area,and the geothermal gradients obtained under these conditions can be used to calculate heat flow.
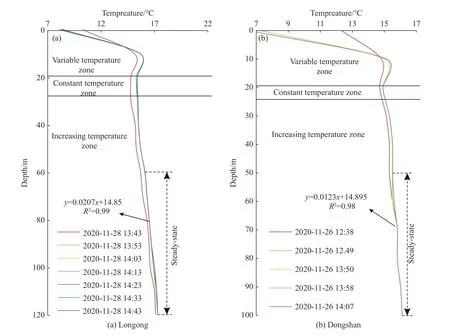
Fig. 2 Temperature curve of ground temperature monitoring
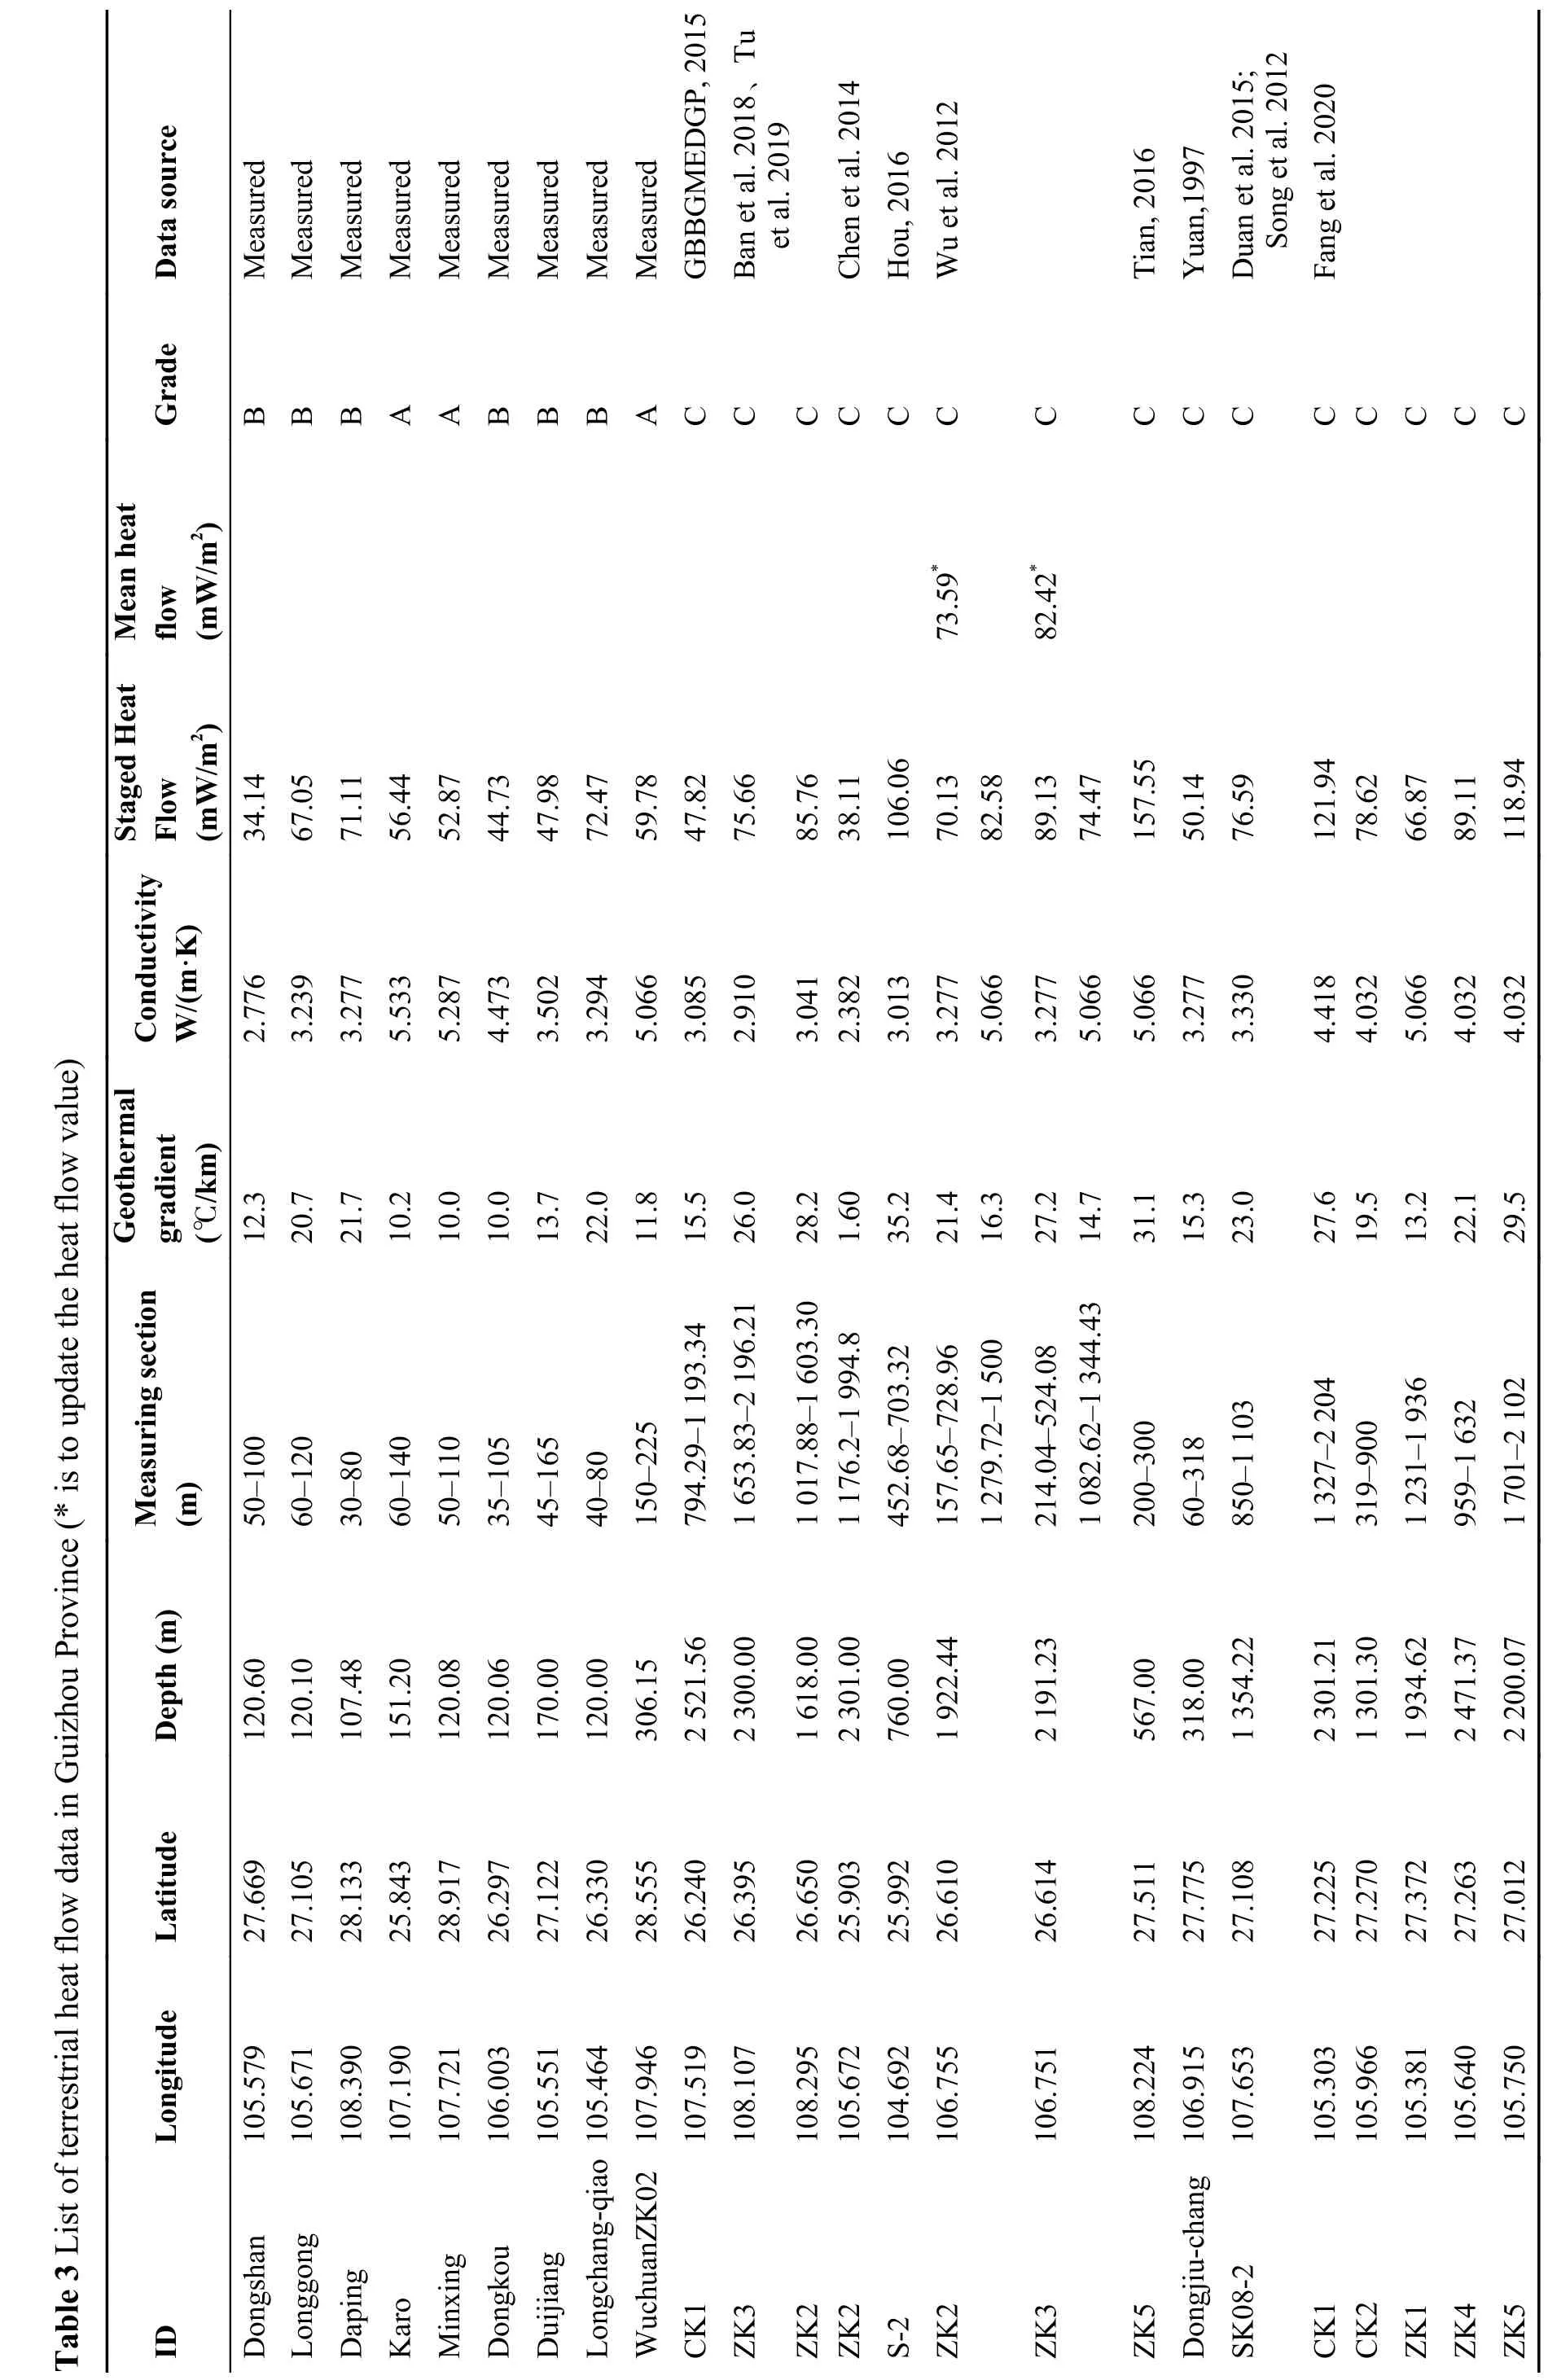
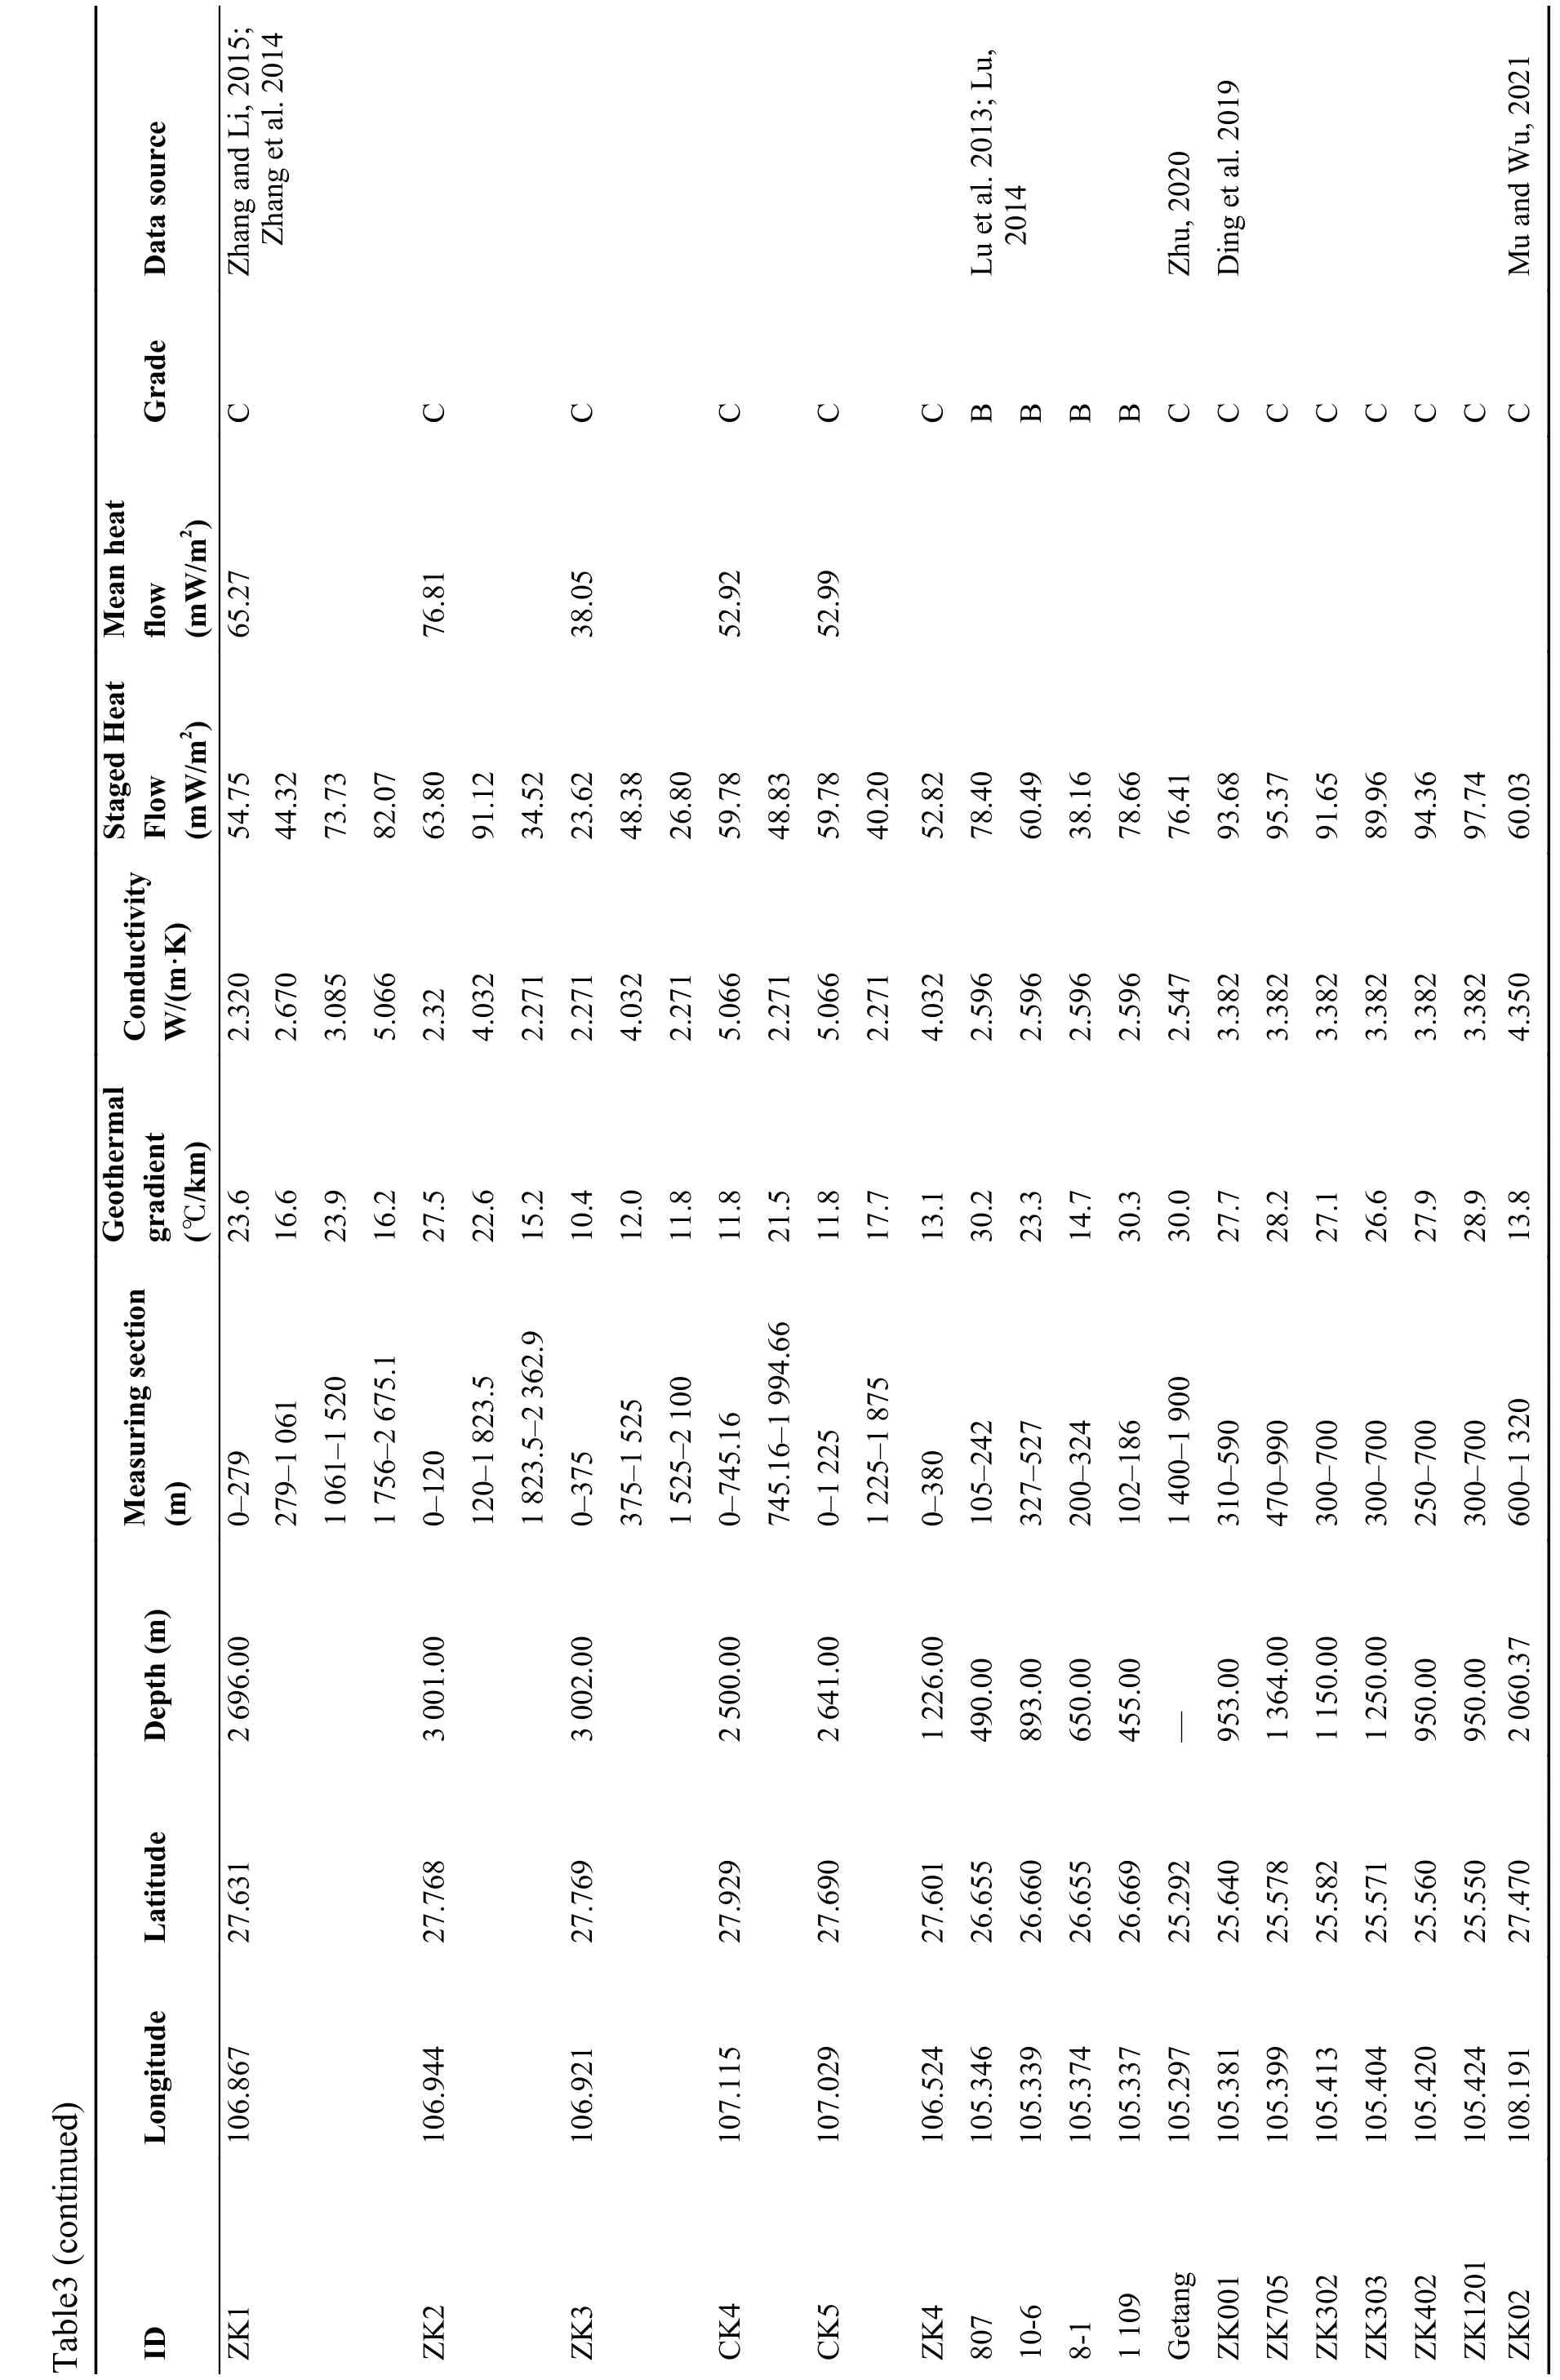
The rock thermal conductivity was from the present measured data or previously published data(Guo et al. 2018; Song et al. 2019; Lu, 2014), and the heat flow was calculated using the segmentation method. The heat flow values are shown in Table 3. The temperature data from the boreholes Wuchuan ZK02, Karo, and Minxing in this study have high quality. The heat conductivities of the cores of these three wells were used to calculate the heat flow. The quality standard of the resulting heat flow values can reach Class A (Wang et al. 1990).There are four Class A data points in this study.The heat flow values of the boreholes Dongshan, Longgong, Daping, Dongkou, Duijiang and Longjiangqiao reached Class B in terms of quality standard because they were calculated using the thermal conductivities of the nearby surface rocks corresponding to the lithology at the depths of the boreholes. The heat flow values of boreholes 807,10-6, 8-1 and 1 109 in the supplementary survey area of Qianxi County also reached Class B since their temperature data have high quality and were calculated using the average thermal conductivity(2.596 W/(m·K)) of siltstones in the Longtan Formation where a linear conduction segment was identified (Guo et al. 2018; Lu, 2014). There are 10 Class B data points in this study. The temperature measurement sections of other boreholes had better data quality, but their heat flow values were calculated using thermal conductivities of nearby surface samples or reference values in the literature and thus fell in Class C in terms of quality standard. As a result, there are 29 Class C data points in this study.
This study updated the thermal conductivities used in previous calculations to be more representative of geological environment. For example, Wu et al. (2012) used the thermal conductivity of the reference borehole (Wang et al. 1990) to calculate the heat flow of boreholes ZK2 and ZK3 in the geothermal field of Wudang District. However, the lithology of the outcrops of the reference borehole is unknown. To improve this, in the current study,the thermal conductivities of the actual lithology of ZK2 and ZK3 were used to calculate the heat flow.The average heat flow values were calculated to be 70.89 mW/m2and 79.70 mW/m2, respectively,which are 5.5% and 25.70% higher than those in the study of Wu et al. (2012) (Fig. 3). Furthermore,both of the newly estimated heat flow are higher than the average value of 62.5 mW/m2in China(Hu et al. 2000). This may be explained by the redistribution of heat flow in the core of the Wudang anticline uplift, where the two boreholes are located. The accumulation of heat flow in the uplifted area of the anticline results in higher background heat flow values (Wu et al. 2012).
According to the results, the average heat flow in Guizhou Province is 65.26 ± 20.93 mW/m2with a variation range of 30.27-157.55 mW/m2, and a mode range of 40-80 mW/m2. The high values above 100 mW/m2are located in areas with highamplitude geothermal gradient anomalies. As shown by the histogram on which the high-amplitude anomalies have been removed, the heat flow is nearly normally distributed (Fig. 4). The histogram also shows that the average heat flow value of Guizhou Province is slightly lower than that of Southeast China of 67.9 mW/m2(Xiong et al. 1993), slightly higher than that of the whole land area of China of 62.5 mW/m2(Hu et al. 2000), and similar to that of the global land areas of 65 mW/m2(Pollack et al. 1993).
?
?
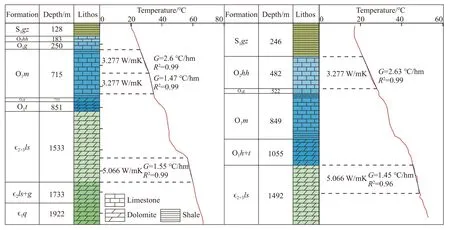
Fig. 3 Stratigraphic column and temperature curve of ZK2 (left) and ZK3 (right) in Wudang geothermal field,Guizhou (modified from Wu et al. 2012)
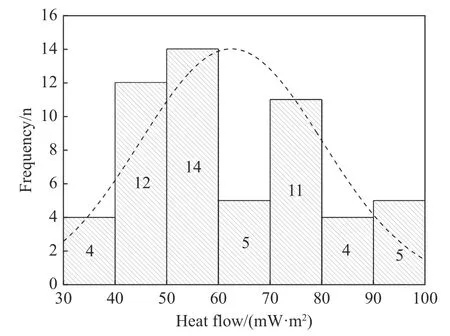
Fig. 4 Histogram of terrestrial heat flow in Guizhou Province
The heat flow contour map (Fig. 5) of Guizhou Province was created using new values from this study combined with existing estimated values(Wang et al. 1990). Fig. 5 shows that the heat flow in Guizhou Province are generally high in the east and west and low in the north and south, following a “dumbbell” distribution. Geographically, the region to the west of the Wangmu-Puding-Qianxi-Dafang area has a significantly high heat flow area with value range of 70-100 mW/m2. The regions to the east of the Sandu-Leishan- Huangping-Shiqian area and to the south of the Jiangkou-Jinping area are high heat flow areas with values higher than 65 mW/m2. The region to the north of the Jinsha-Meitan-Dejiang-Jiangkou area is classiefied as a low heat flow area with values generally lower than 65 mW/m2, and even lower than 50 mW/m2in Chishui and Yanhe areas. The regions to the south of the Zhenning-Puding-Guiding-Majiang area, to the west of the Danzhai-Sandu area, and to the east of the Luodian-Guanling area are defined as extreamly low heat flow regions with values much lower than 65 mW/m2, and only 40 mW/m2in the Anshun-Changshun areas.
4 Discussions
4.1 Relationships between geothermal flow and the Moho and the Curie surface
The Moho and Curie surface are important interfaces in the crust-mantle thermal structure. The former represents the crustal thickness, whereas the latter is a temperature isothermal surface of the crust (Wang, 2015). There is a relationship between these two interfaces and heat flow. The depth map of the Moho generated by the inversion of the gravity and magnetic data shows that the depth of the Moho in Guizhou Province is 34-46 km in Fig. 6 (Qu et al. 2019), while 38 km to 48.5 km was obtained through the inversion of the Parker density interface (Wu et al. 2016). The Moho depth by using the above method is high in the east and low in the west, reflecting that the crust tends to gradually thicken from east to west in Guizhou.As the depth map of Moho surface and heat flow distribution show (Fig. 5 and Fig. 6), the heat flow values are mostly high where Moho surface is deep and low where the Moho surface is shallow, and there is a positive correlation between them.
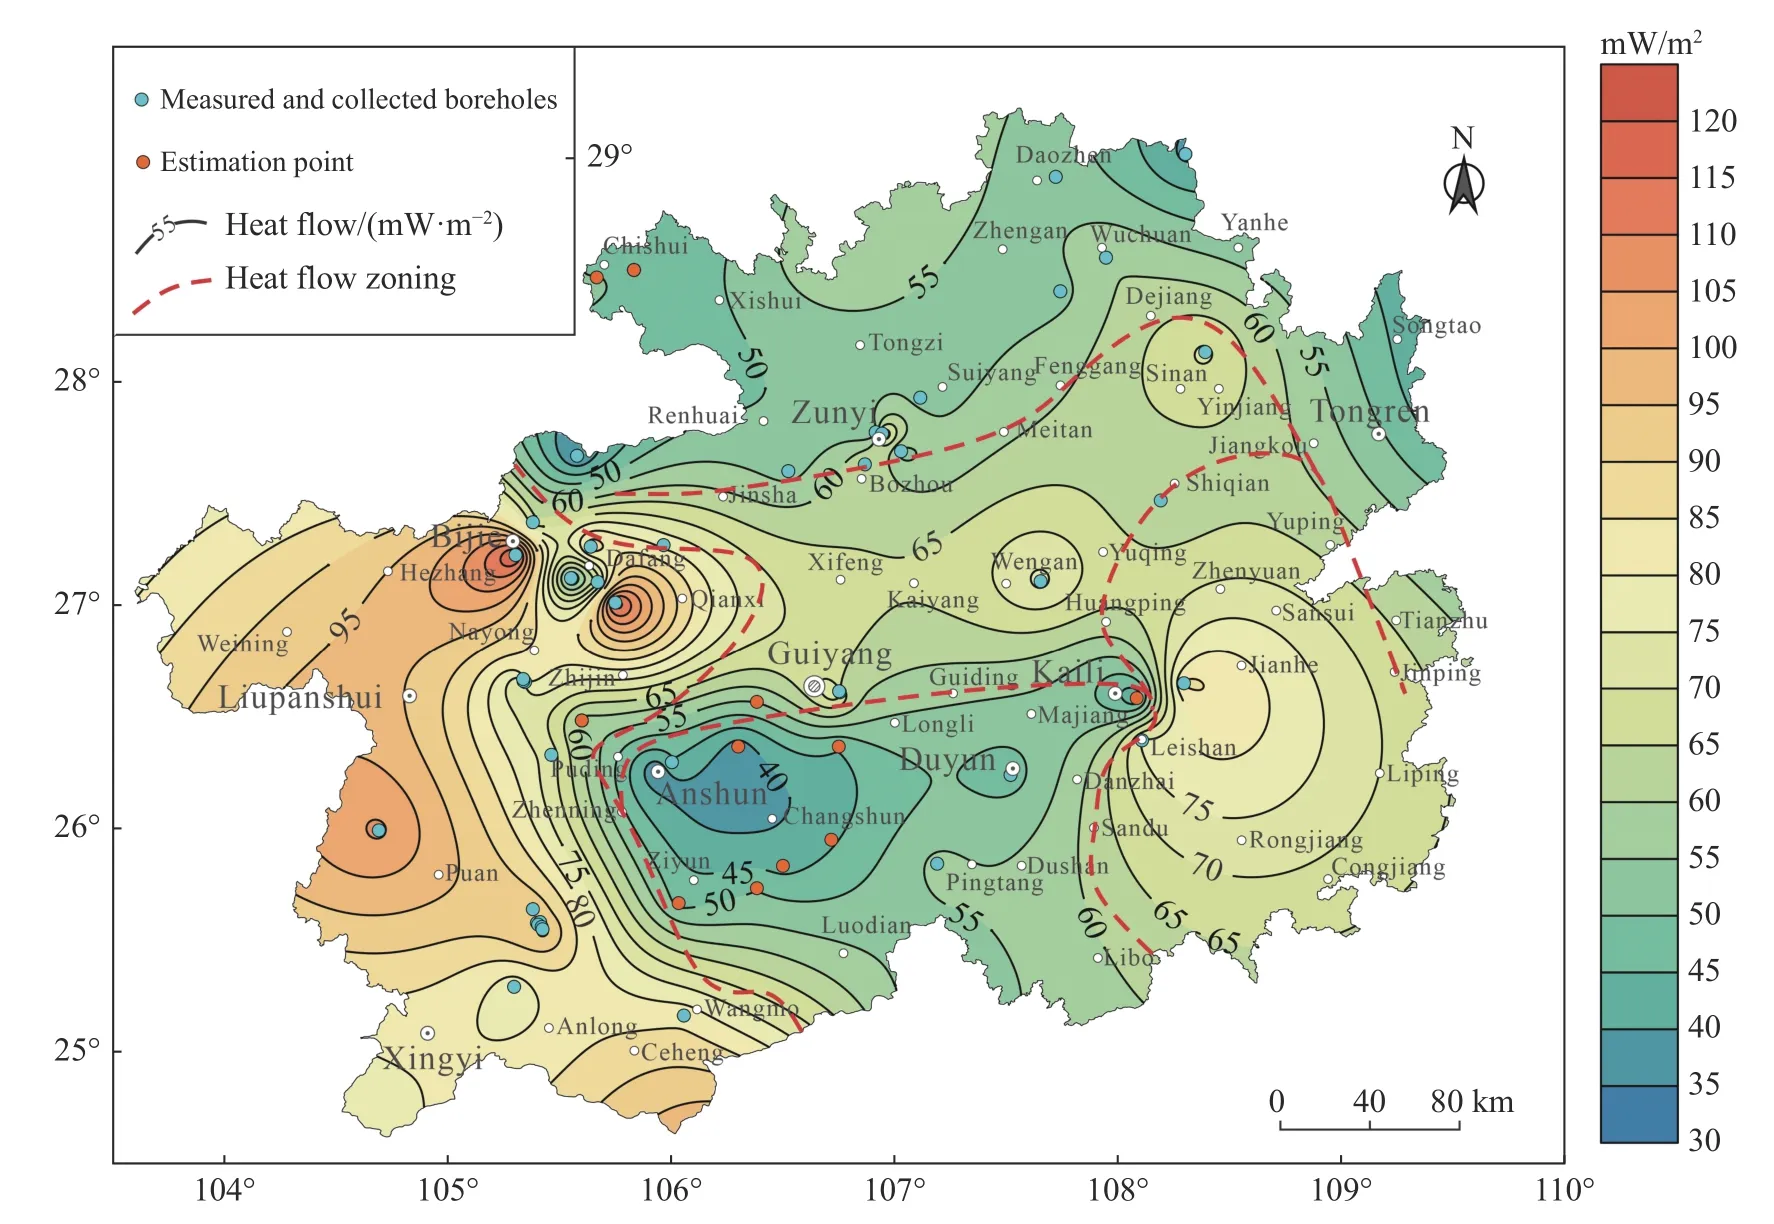
Fig. 5 Contour map of terrestrial heat flow in Guizhou Province
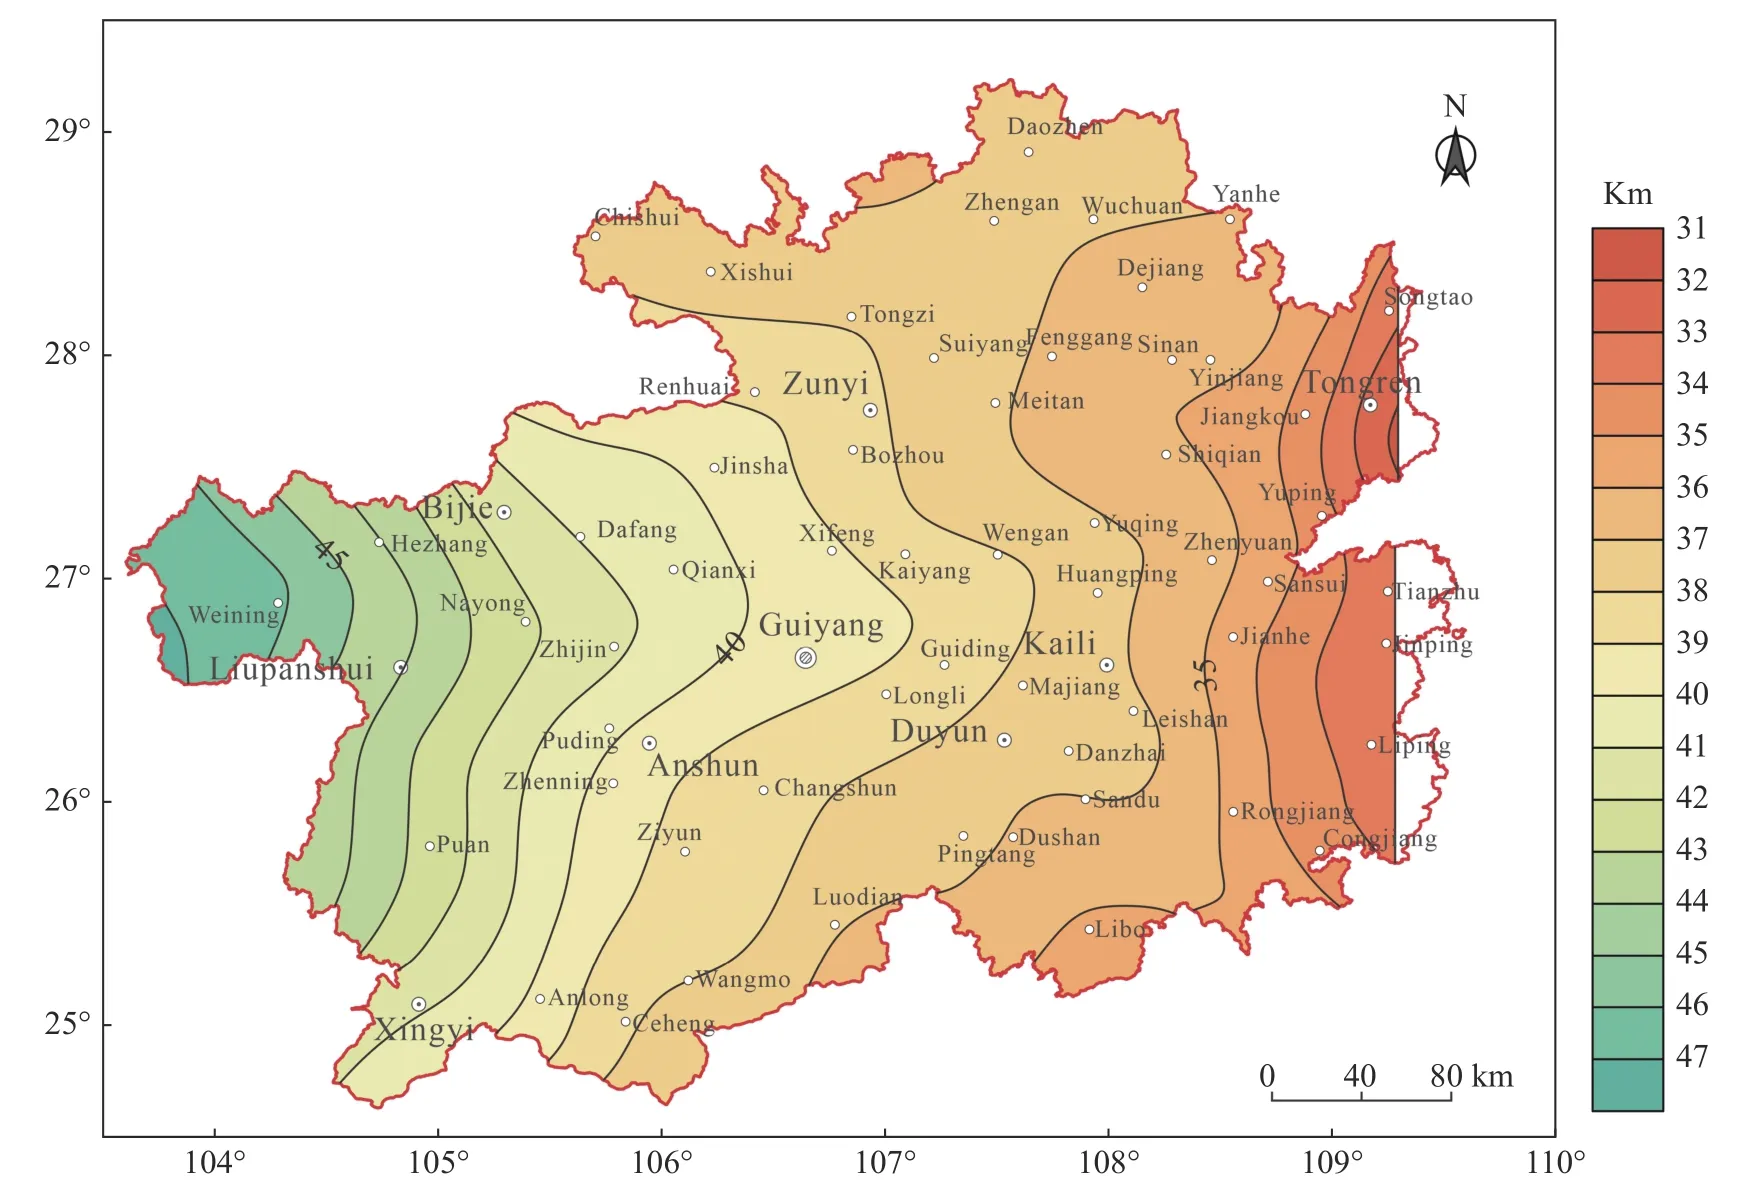
Fig. 6 Map of Moho depth in Guizhou Province (modified from Qu et al. 2019)
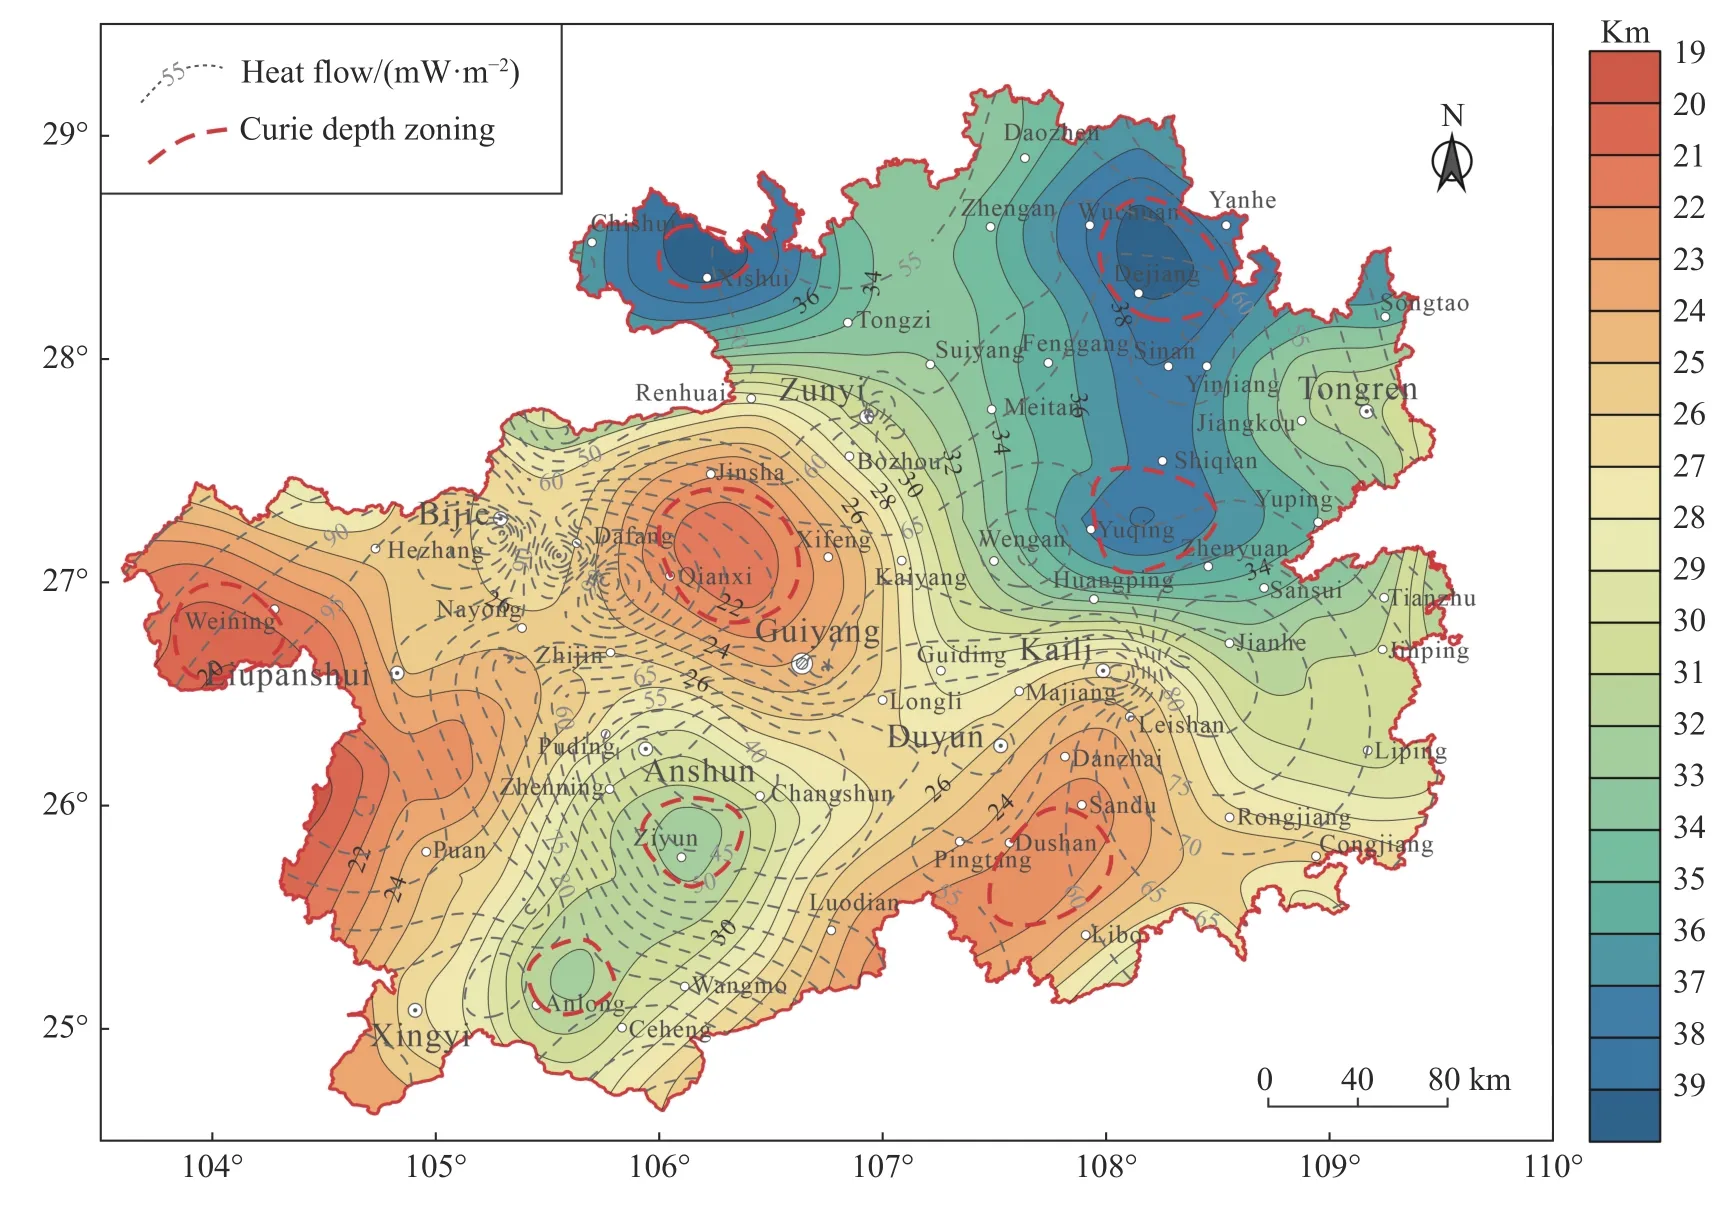
Fig. 7 Map of depth of Curie in Guizhou Province (modified from Xiong et al. 2016)
The depth map of the Curie surface in Guizhou in Fig. 7 (Xiong et al. 2016) shows that the Curia surface in the west is uplifted, with a depth of 20-30 km, while the Curie surface in the east is depressed, with a depth of 26-38 km. Generally, the depth of the Curie surface gradually decreases from northeast to southwest and presents a banded distribution. Moreover, the Curie surface in areas such as Qianxi, Dushan, and Weining shows cloddy convexity, whereas the Curie surface in areas such as Ziyun, Anlong, Dejiang, Yuqing, and Xishui show cloddy depression. As shown in the depth map of the Curie surface and the distribution of geodetic heat flow (Fig. 7), the heat flow value is generally high in the shallow areas of the Curie surface, whereas the heat flow value tends to be low in the deep areas of the Curie surface, except for some local areas, which may be caused by the lack of local heat flow points or other factors.According to the relationships of the heat flow distribution characteristics with the Moho and the Curie surface, the heat flow values are generally high in areas with deep Moho and shallow Curie surface and lower in areas with shallow Moho and deep Curie surface.
4.2 Relationship between Emeishan basalts and geothermal flow
Terrestrial heat flow values are important parameters reflecting the thermal structure of the crust and mantle. In this paper, a scatter diagram of the regional heat flow values in the Emeishan large igneous province (ELIP) was created using the heat flow data of the whole land area of China(Wang and Huang, 1990), the estimated heat flow points in Guizhou (Wang et al. 1990), and the heat flow data calculated in this study (Fig. 8a). This diagram reflects the influence of ELIP on heat flow distribution patterns of Guizhou.
The heat flow data of the Panxi, Yunnan, and Sichuan basins have high quality and are defined as Class A (Wang and Huang, 1990). In the present study, the measured and collected data were reprocessed and the derived thermal conductivity datasets are considered more representative of the actual geological conditions of Guizhou, which were then used for the calculation and the result heat flow data generally have a better quality as Class C. Wang et al. (1990) used the temperature data of the borehole bottom or the thermal conductivities of neighboring boreholes to calculate heat flow data in Guizhou. Although the heat flow values were estimated, they still provided some information on the distribution of heat flow in areas far from the ELIP center. The scatter diagram of heat flow values in the ELIP region (Fig. 8a)shows that the heat flow is high in the inner and middle zones of the ELIP and but gradually decreases with the distance from the ELIP center(Jiang et al. 2018). The average values of heat flow in the inner, middle, and outer zones are 75.56 mW/m2, 75.18 mW/m2and 59.15 mW/m2, respectively. In addition, the heat flow values are generally high near the NS-strike faults in the region,indicating that the NS-strike faults not only control the distribution of Emeishan basalts but also influence the distribution of heat flow (Fig. 8a).
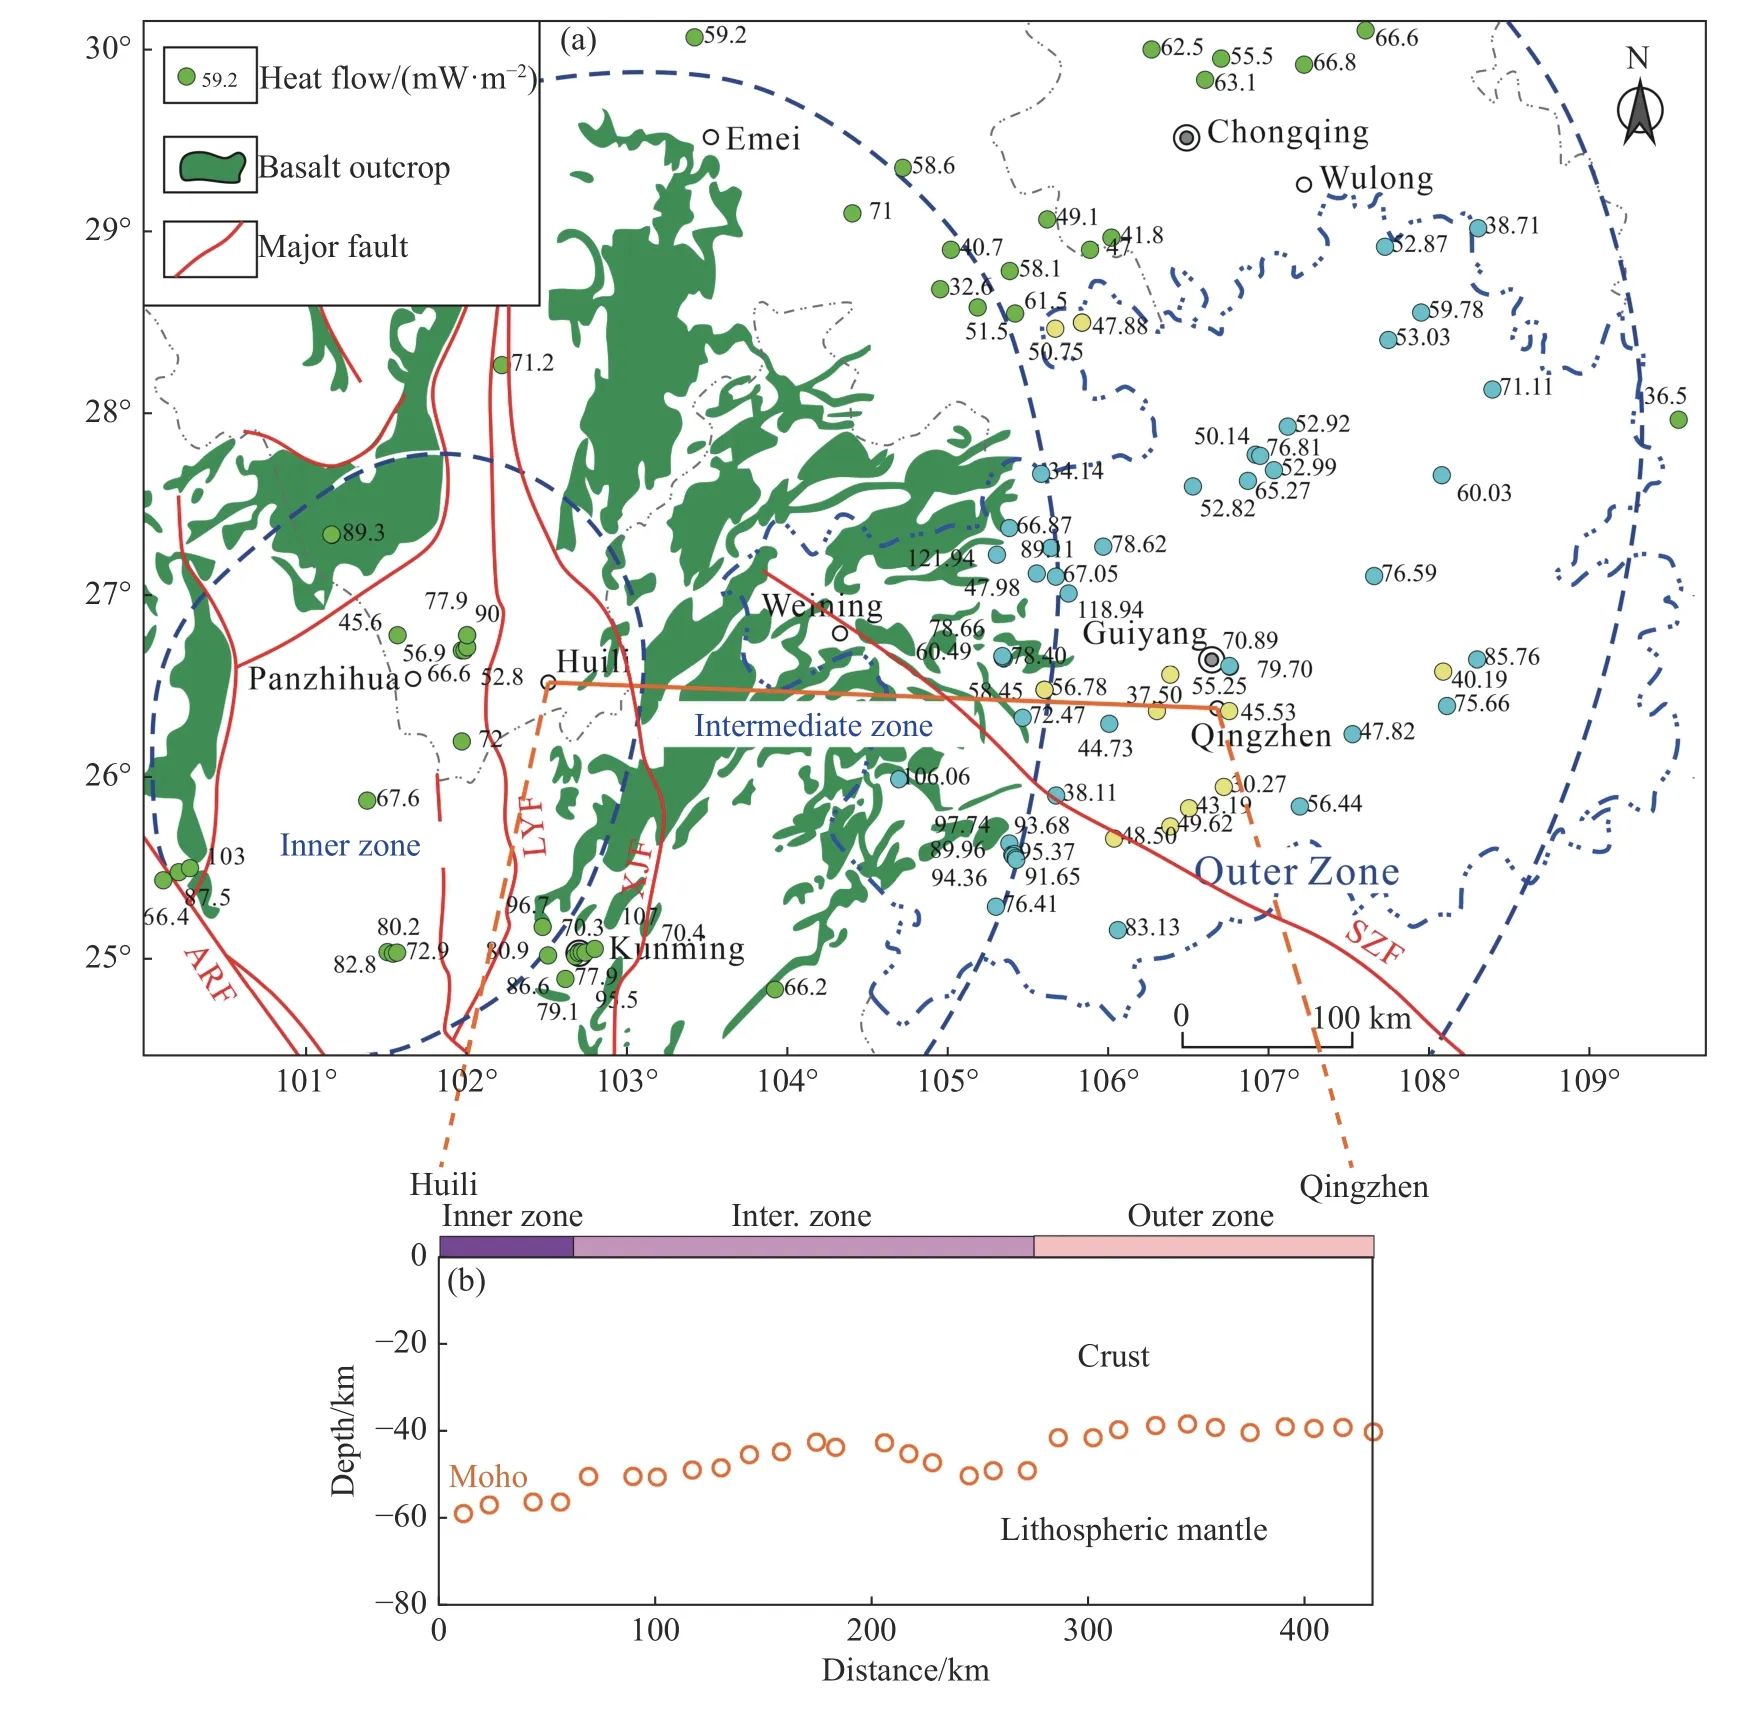
Fig. 8 (a) Map of Emeishan large igneous province and regional thermal flow dispersion. (b)Thermal lithospheric thickness of the Huili-Qingzhen transect (modified from Jiang et al. 2018)
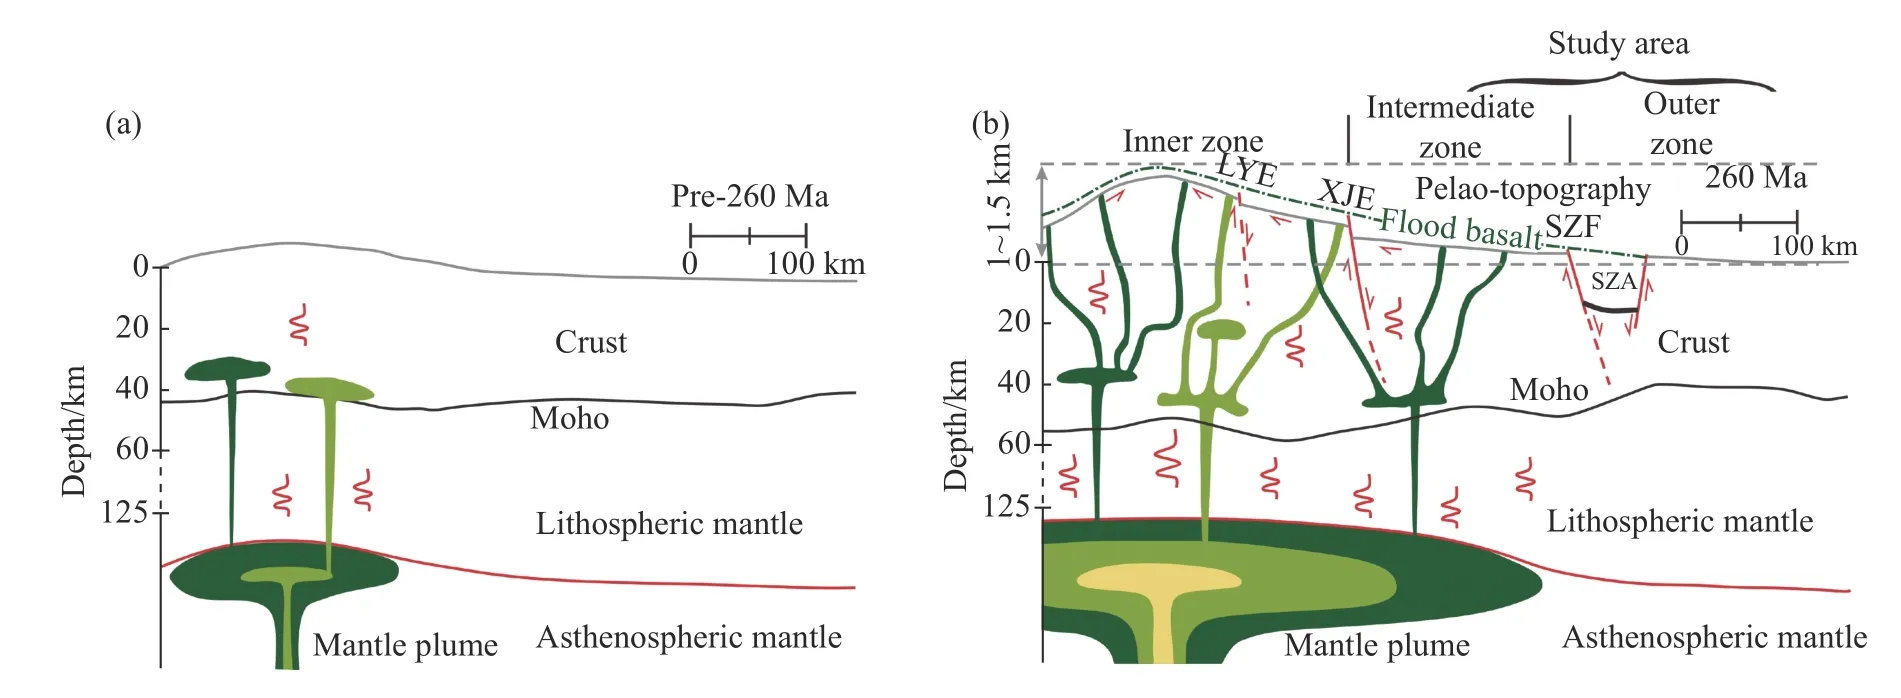
Fig. 9 Conceptual model for (a) early magmatic underplating by a mantle plume (modified after Feng et al.2021); (b) progressive magma emplacement at depth, topographic uplift in the Emeishan LIP (modified from Feng et al. 2021; Chen et al. 2015)
According to previous research, there are three main controlling factors of the heat flow distribution pattern in the ELIP area. One is the large-scale Late Paleozoic Emeishan basaltic magma. The area close to the Emeishan basaltic eruption area has relatively high heat flow values (~70 mW/m2),reflecting the thermal effect of magmatic activities.In addition, after the large-scale volcanism of the Emeishan mantle plume, a phase of large-scale and long-duration acid magma intrusion and eruption activities occurred; these acid magma activities have a close genetic connection with the Emeishan basalts, and the acid magmas may be eutectic products to the crust during the uplift of basaltic magmas (Lu, 1996). The distribution of intermediate-acid concealed bodies in western Guizhou,delineated using heavy magnetic anomalies, corresponds to the acid magma activities (Wang et al.2020). The radiogenic heat production of the intermediate-acid bodies may have contributed to the heat flow.
The second factor is the upwelling of the mantle plume. The mantle plume extrudes the continental lithosphere, tending to cause magma bodies to enter the crust or the magmatic diapirs to form at the bottom of the crust in Fig. 9a (Feng et al. 2021).This process may cause a large thermal anomaly to penetrate the overlying crust. The magmatic diapirs can also lead to the vertical uplift of the upper crust through physical and chemical effects. Accordingly, hot magmatic bodies keep rising until they erupt at the surface (Fig. 9b), causing differential dome-shaped uplifts of more than 1 000 m in the inner zones and over 400 m in the middle zones(He et al. 2003). This process has produced an extensional tectonic setting and has activated some large regional faults (Chen et al. 2015) with depths of tens of kilometers which often connect to the mantle, providing thermal convection conditions.Structures and magmatic bodies may have caused the differential distribution of heat flow within the Emeishan basalts region.
The third factor is the mantle plume activities.The formation of the ELIP is related to the upwelling of mantle plumes, the fact that mantle plume materials impact the lithospheric basement, and the extensive magma diapirs. These activities are destructive of the lithosphere, as they cause lithospheric thinning and crustal thickening (Jiang et al.2018; Shellnutt, 2014; Sun et al. 2010). In addition,geophysical studies have shown that although mantle temperature anomalies and mantle plume upwelling do not exist at the bottom of the lithosphere in the Emeishan basaltic region currently (He et al. 2014), Emeishan mantle plume could still affect the inner and middle zones of the relatively thin lithosphere where the heat flow are found to be high. Cross section showing the inner, middle,and outer zones from east to west in Huili-Qingzhen area and lithospheric thickness are presented in Fig. 8a, Fig. 8b and Fig. 9b. The lithospheric thickness gradually increases and the crustal thickness gradually decreases from the inner and middle zones outward. The change in crustal thickness may affect the heat flow distribution, but the additional surface heat flow resulting from the deep basaltic layer of the crust contributes little. Therefore, the lithospheric factor of the basaltic layer has limited influence. In addition, diapirs cause lateral emplacement of mantle plume material and crust, leading to the formation of basal laminated intrusions,which may also have some influence on heat flow.
4.3 Relationships between structures and terrestrial heat flow
Based on tectonic deformation, sedimentary rocks,geophysics, geochemistry, magmas, earthquakes,thermal springs, and deposit indicators, Dai et al.(2013) inferred 10 deep faults (Fig. 10) extending in four directions with lengths of from ~60 km to~520 km. These deep faults are mostly lithospheric faults, and generally cut through the simasphere and cause the ultramafic magmas in the upper mantle to rise along the faults, moniliform and banded ultramafic rock bodies, earthquakes, hot springs,and hydrothermal deposits could be formed and distributed along the fault zones. Since regional deep faults are considered to have rock, mineral,and thermal conductivity (GSGP, 2017), the intertwined and overlapping parts of the concealed deep faults tend to be areas with high heat flow values.
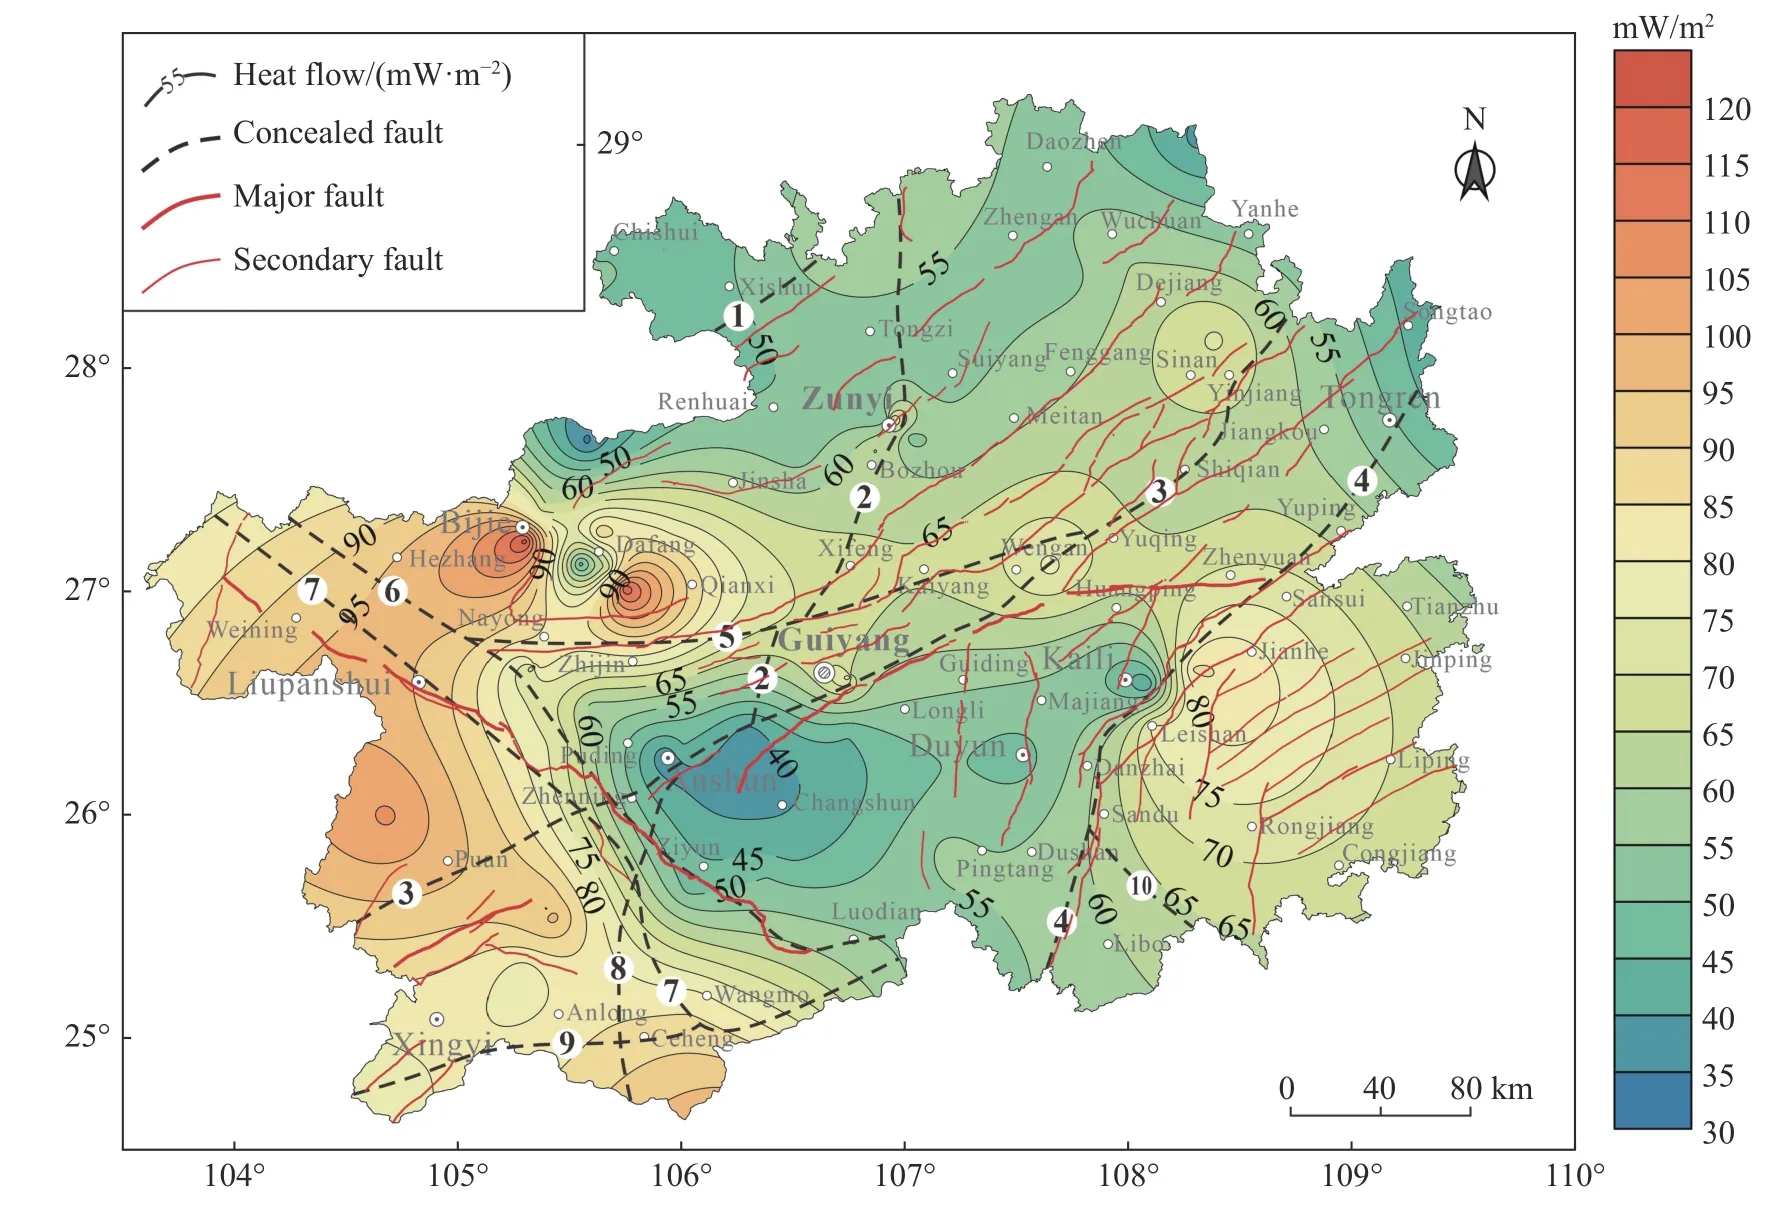
Fig. 10 Geological formations and heat flow distribution in Guizhou Province (hidden faults cited in Dai et al.2013)
The concealed deep faults not only connect to the heat source in the mantle but also obliquely intersect with the NE-, NNE-, and NS-strike active faults. Therefore, they are direct channels for the transfer of heat flow from deep to shallow parts of the Earth. As a result, the heat flow in Guizhou is partly controlled by both deep faults and shallow active faults (Chen, 2021). For example, as seen in Fig. 10, the Sinan-Yinjiang area, under the control of the concealed Muhuang-Guiyang-Pu’an deep fault and the Sinan-Baimadong strike-slip fault, is a region with high heat flow values. Similar conditions can be found in the Jianhe-Leshan area, controlled by the concealed Yuping-Shidong-Sandu deep fault and the Gedong active fault; the Weining-Liupanshui-Hezhang area, controlled by the Yadu-Ziyun, Shuicheng-Wangmu, and Shuicheng-Ziyun-Luodian faults. Comparted with the southern section of the Yadu-Ziyun between Wangmu and Luodian, the northwestern section of the area has no extenisvely developed faults (Mao et al. 1997) and thus has lower heat flow values.
5 Conclusions
Based on the measurement and characterization of the heat flow in Guizhou Province, the following conclusions can be made: (1) Most of the thermal conductivities obtained in this study are 2.0-5.0 W/(m·K), with an average of 3.399 W/(m·K).The thermal conductivities of rocks are in the order of sandy mudstones < siltstones < limestones <marls < tuffs < siliceous limestones < slates< finegrained sandstones < dolomites < argillaceous dolomites. (2) The heat flow values in Guizhou range from 30.27 mW/m2to 157.55 mW/m2, with an average of 65.26 ± 20.93 mW/m2, which is slightly higher than the average heat flow of whole land area in China. The heat flow values in Guizhou are high in the east and west and low in the north and south, presenting dumbbell-shaped distribution.(3) The factors influencing the regional heat flow include the Moho, the Curie surface, the Emeishan basalts, and geological structures. There is a correlation between the heat flow values and the depths of the Moho and the Curie surface. The Emeishan basalts dominated the basic pattern of heat flow distribution in Guizhou via the following activities:The reflective heat production of both the erupted basaltic magmas and the late intermediate-acid intrusions, the formation of dome-shaped uplifts at the bottom of the magmatic diapirs, the activation of some large regional faults that can provide thermal convection conditions by the dome-shaped uplifts, and the lithosphere thinning, crustal thickening, and lateral emplacement caused by the upwelling of mantle plumes. In addition, regional active faults and concealed deep faults jointly control the heat transfer channels and further influence the heat flow in Guizhou.
Acknowledgements
This work was supported by the China Geological Survey Project (Grant No. DD20190128; Grant No. DD20221676) and Basic Research Operations Project of the Institute of Hydrogeology and Environmental Geology, Chinese Academy of Geological Sciences (SK202212).
杂志排行
地下水科学与工程(英文版)的其它文章
- Numerical simulation of operation performance on production and injection of a double well geothermal system in Kailu Basin, Inner Mongolia
- Spatial confirmation of termite mounds as Bio-geo indicator for groundwater occurrences using ground magnetic survey: A case study from Perambalur Region of Tamil Nadu, India
- Comparative analysis of bacterial contamination in tap and groundwater: A case study on water quality of Quetta City, an arid zone in Pakistan
- Holistic approach of GIS based Multi-Criteria Decision Analysis (MCDA)and WetSpass models to evaluate groundwater potential in Gelana watershed of Ethiopia
- Genetic model and exploration target area of geothermal resources in Hongtang Area, Xiamen, China
- Assessment of water level threshold for groundwater restoration and overexploitation remediation the Beijing-Tianjin-Hebei Plain