Comparative analysis of bacterial contamination in tap and groundwater: A case study on water quality of Quetta City, an arid zone in Pakistan
2022-06-27KhanTanzeelAkhtarMalikMuhammadMalghaniGohramAkhtarRabia
Khan Tanzeel, Akhtar Malik Muhammad*, Malghani Gohram, Akhtar Rabia
1 Department of Environmental Science, Faculty of Life Sciences & Informatics, Balochistan University of Information Technology,Engineering and Management Sciences, Quetta 87300, Pakistan.
2 Department of Psychology, Balochistan University of Information Technology, Engineering and Management Sciences, Quetta 87300,Pakistan.
Abstract: Water is an essential element on earth, which provides human a variety of services in domestic use, agriculture, or industries. However, some serious health risks of drinking water are associated with microbial contamination, particularly with fecal matter. Therefore, microbial quality assessment is considered to be a necessary component of water quality assessment. This study investigates microbial contamination of water distributary system around the city by comparing groundwater (GW) and tap water(TW) quality in Quetta city. 31 GW samples and 31 TW samples were collected in the study area during the months of September, October, and November. Fecal coliform test was carried out in laboratory and their average total coliform contamination was computed. Results showed that the TW sample were all contaminated by coliform except for Chiltan town, hence are not considered suitable for drinking without any treatment according to WHO drinking water quality standards. The average coliform concentrations were 12 in Quetta main city, 11.6 in Jinnah town, 5.3 in Satallite town, 10 in Shahbaz town and 5 in Brewery town (0/100 mL CFU) and the TW samples from the three towns were even more contaminated with E.coli. Whereas among the GW, average microbial concentrations were 1.8 in Quetta main city, 2 in Satallite town, 1.4 in Shahbaz town, and 0.4 in Chiltan town (0/100 mL CFU), respectively, which shows that the contamination is occurring within the water distributary pipeline system when the water flows through the pipelines. Moreover, this research will be valuable for researchers and administrative authorities to conduct elaborative studies, and develop new policies to prevent further deterioration of drinking water in the water distribution system by pathogenic microorganisms and ensure safe drinking water to the public of Quetta city.
Keywords: Groundwater quality; Microbial contamination; Coliform bacteria; Drinking water quality
Introduction
Water provides human population variety of services whether in domestic use, agriculture, or industrialization. However, the small available proportion of drinking water is becoming polluted due to various anthropogenic activities like disposal of municipal and industrial waste, use of chemicals in agriculture, leakage and pollution from sewerage pipes (Jang et al. 2017; Liu et al.2021). Many outbreaks of waterborne diseases such as diarrhea, typhoid, gastrointestinal diseases have occurred in the past (Craun et al. 2006),usually caused by contamination of drinking water with fecal matter, particularly human feces that contain coliform bacteria. Meanwhile, environmental and human health is also highly threatened by GW contamination (Muhammad et al.2016). According to World Health Organization(WHO), 3.4 million people, mostly children, die from water-related diseases each year (Ngwenya et al. 2013). According to United Nations Children’s Fund (UNICEF) assessment, 4 000 children die each day due to contaminated water. WHO reports that over 2.6 billion people lack access to clean water, leading to 2.2 million deaths annually, of which 1.4 million are children (Pandey et al.2014). According to the UNICEF findings, almost 20-40% of hospitals in Pakistan have patients with waterborne illness (Kamran et al. 2020). With these sad and shocking numbers, the United Nations has set improving water quality as one of the eight Millennium Development Goals (MDGs).
Coliform bacteria are a group of comparatively harmless microorganisms in huge quantities that live in the digestive systems and intestines of human beings and animals. These microorganisms assist in the digestion of food and can be found in human and animal wastes. Soil and decaying vegetable can also be a source of these bacteria.Some coliform bacteria such as faecal coliforms are only present in faecal material. The most common component of this group is Escherichia coli (E.coli). These organisms may be separated from the total coliform group by their ability to grow at elevated temperatures since they are only associated with the faecal matter of homoiothermic animals.
In Pakistan, there are several potential sources of drinking water contamination, among which bacterioareas. Such contamination is normally attributed to leakage of pipes, pollution from sewerage pipes due to problems within the distribution system and intermittent water supply (Azizullah et al. 2011). About 50% of diseases and 40% of deaths in Pakistan are related to poor drinking water quality, as reported in community health studies. In most of the cities of Pakistan, the main source of water supply is GW which provides water for domestic as well as commercial use. GW is distributed to the consumers through a water distributary pipeline system and taps at homes or commercial places and the occurrence of coliform bacteria in those TW clearly shows its contamination with animal and human fecal matter during the water transmission within pipelines (Daud et al.2017).
Water-borne diseases are prevalent in developing countries. However, developed countries like US also face the challenge of waterborne disease outbreaks. The US EPA does routine sampling and testing of total coliform and E.coli in drinking water, positive samples will receive repeated tests to confirm the result. If a positive result for total coliform or E. coli is found in the drinking water, it is considered as violation of an acute Microbial contamination limit. According to US EPA, no more than one sample should be positive for total coliform in any 40 monthly samples in a specified drinking water system, and no more than 5% of samples should be positive in more than 40 samples which are collected routinely in a water system, (Pandey et al. 2014). If even the developed countries are combating this challenge and trying to overcome the water borne disease outbreaks, it is thus necessary for developing countries like Pakistan to pay more attention towards this situation.
Balochistan is the largest province of Pakistan,representing 44% of the country’s land. The unplanned construction, human settlements, and other human activities along with the local environment had caused serious stress on the drinking water quality as well as quantity (Ilyas et al. 2010). Because of the mismanagement of the drinking water supply system in the city, the issue bacterial contamination is increasing gradually, the assessment of the households drinking water quality becomes very important (Din et al. 2014). This research studied the difference between bacterial levels in tubewell and tap water and compared the levels of E. coli in TW and GW samples, to show the contamination source is from the tubewell or the water distribution system. Levels of E.coli, coliform, and total coliform in the tubewell water samples of the study area will help to identify the contamination levels and water quality in the study area.
1 Study area
1.1 Location and climatology
Quetta is the provincial capital and the largest city of Balochistan. It covers 2 653 square kilometers(1 024 sq. mi) of land and lies between 66°41'40″-67°17'25″ E and 30°01'29″-30°28'25″ N. The altitude of the city is around 1 680 meters above sea level. Quetta valley is surrounded by mountain ranges of: Chiltan, Murdar, Takato and Zarghoon. Mian Ghundi is located in the south of the valley, where Takato mountains lead towards Chaman and border of Afghanistan, Chiltan ranges gap through Lak pass in the south and leading towards Mastung, Zarghoon and Murdar ranges in the northeast lead towards Punjab through Loralai. The province has a wide agro-ecological diversity and is divided into four agro-climatic zones i.e. uplands, coast, planes and deserts. The zone of uplands is classified as arid in terms of rainfall,receiving an average of 200 mm to 250 mm rainfall annually, which signifies the need for irrigation water for high value crops. The uplands of Balochistan comprise Ziarat, Kalat, Quetta,Pishin, Killa Abdullah, Mastung, Zhob and Loralai districts. The Quetta valley is basically located in an arid zone of the province. The average temperature is 24-26℃ during the summer months of May-September, 12-18℃ in the autumn season from September-November, 4-5℃ in winter months from October-March and 15℃ in spring months of April-May. Quetta city does not have a sustained monsoon season. The imbalance between the precipitation and evaporation is an important factor to maintain the groundwater sustainability since the evaporation is higher than precipitation (Durrani et al. 2018). Since inhabitants of Quetta are largely dependent on groundwater resources for domestic, commercial and agriculture use, the main source of groundwater abstraction for these purposes is the alluvial aquifer.
The study area is divided into towns according to the administrative distribution of towns in Quetta city. The towns under study include Jinnah Town, Shahbaz Town, Satallite town, Brewery town and Chiltan town. Samples are taken from each town and labeled on the map as shown in Fig. 1.

Fig. 1 Map of study area with sampling points
1.2 Hydrogeology
The watershed area of Quetta is 1 756 km2, out of which 792 km2is covered by alluvium. The hills of Landi and Mian Ghundi crop out within the valley.Two basins exist in Quetta: The main Quetta valley in the north and the Dasht plain in the south.Quetta valley has a complex geology with both unconfined and confined aquifer (Alam, 2010). It is a synclinal valley filled with unconsolidated and semi-consolidated alluvial deposits of clay, silt,sand and gravel, which is underlain by consolidated rocks (Ghani et al. 2019). The unconsolidated and semi-consolidated sediments constitute the alluvial aquifer, whereas the consolidated rocks represent the bedrock or the confined aquifer(Alam et al. 2014).
1.3 Demography
Population in the Quetta District was 381 566 in 1981, 759 941 in 1998, 1 235 066 in 2010 and 2 275 699 in 2017 (PSO, 2020), increased six times in less than 40 years, as shown in Fig. 2.This drastic rise in the population of the Quetta valley had caused severe stress on the natural resources especially drinking water due to unplanned long-term groundwater extraction (Aftab et al.2018)

Fig. 2 Population Census of Quetta District Source:Pakistan Bureau of statistics
2 Method
2.1 Microbial analysis
To assess the groundwater quality of the Quetta city, 31 samples were collected from tubewells(source water) in the study area as GW and same amount of samples were collected from tap water(domestic source) as TW. All samples were collected in the 500 mL sterilized glass bottles for microbiological analysis - E.Coli, Coliform and Total Coliform. Tubewell is pumped for about 5-10 minutes before sampling and TW samples were collected from kitchen taps used for drinking purpose.
2.2 Sampling procedure
All information about the sampling point was noted in the notebook. Sampling site was assigned with a unique code for identification, which was labelled on the bottle along the sampling date and time. While collecting the TW samples, un-rusted and clean taps were selected. Aseptic techniques and conditions were adopted during the collection of microbiological samples. The flow rate of the tap water was kept constant to avoid the dislodging of bacterial film in the inner side of tap. When filling the sampling bottle, a small air gap was left.500 mL bottle was filled in 15 seconds which means the speed of filling the bottle is 2 L per minute, and the same speed was used for all the samples.
All water sample containers were filled slowly to prevent air bubbles and turbulence. Samples for microbiological analysis were transferred to the laboratory within six hours of collection. They were kept in the incubator with the temperature of 37℃before they were analyzed for E.Coli, Coliform and Total Coliform. The E.coli bacteria is facultative anaerobic. In other words, it is able to grow in both aerobic and anaerobic environments. Microbiological growth/bacteriological contamination were checked after 48 hours of incubation according to the AOAC official method 991.14, which are applicable to all foods.
In this study, microbial analysis was carried out by using 3M Petrifilm aqua plates, which have replaced the conventional agar and petri dishes and filter funnels used in testing of water. Each plate contains gel that are standard nutrients (Violet Red Bile (VRB) nutrients derived from MacConkey’s original formula) and a tetrazolium indicator. 3M Petrifilm aqua plates are designed to test E.coli and other coliform bacteria in 24 hours to 48 hours using following steps:
1. Petrifilm pack is taken out from the refrigerator and cooled down to 25℃ since it is stored at ≤8℃ and can be stored for 18 months. With a pipet perpendicular to the Petrifilm inoculate and spread the 1 mL of the sample on to the plate. Roll the top film down to cover the Petrifilm plate. With a flat side down place the spreader on the top film over the inoculum. Gently press the spreader to ensure the inoculum is equally spread onto the plate. Wait for 1 min.
2. The plates are prepared on a grid background to facilitate the colony counting. The plates are incubated inside incubator with the grided side down in stacks of up to 20 plates, at a temperature of 35℃± 1℃.
3. Count the colonies on a standard colony counter. Bacterial colonies are either red or blue due to the type of indicator present in the Petrifilm.
4. Disinfect before disposal. The Petrifilm can be disinfected by autoclaving or by soaking in 20%bleach for 1 hour.
A red indicator dye in the plate colors all the colonies red and a top film traps the gas, often seen as bubbles produced by the coliform bacteria. In addition, glucuronidase indicator forms a clue precipitate around the E.coli colonies. 3M Petrifilm aqua plates method has been approved by AOAC and considered as the official method of analysis.
2.3 Water quality analysis
Water quality of the samples was analyzed by the following parameters: Electrical conductivity (EC),total dissolved solids (TDS), pH and turbidity. 31 samples of GW and 31 samples of TW were tested in the laboratory for physical quality and the above parameters. Water quality analysis results are presented in Table 1 and statistical analysis of these parameters was done using SPSS software (Table 2, 3, 4 and 5).
2.4 Questionnaire Survey
A questionnaire survey was carried out to find out what the source of drinking water is, whether people treat the water before drinking and what the status of sanitary system of that area is. 100 questionnaires were filled by the residents of the towns in the study area.
3 Results and discussions
3.1 Microbial analysis of GW and TW
Results of GW bacterial contamination are summarized in Table 1. As the coliform organisms are easily detectable and countable in water, they are considered as a suitable microbial indicator of drinking water quality since long time ago. The bacterial contamination was 0 in GW samples from Brewery and Jinnah town. However, contaminations of 4 CFU/mL and 3 CFU/mL were found in Shahbaz town, 7 CFU/mL and 4 CFU/mL in Quetta Main city, 6 CFU/mL in Satallite town and 2 CFU/mL in Chiltan town, respectively. E.coli bacteria were not found in none of the samples,which indicates that the GW was not contaminated with E.coli pathogen. Fig. 3 shows the detailed contamination of coliform bacteria in each sample of GW in each town. Yellow bar shows the coliform bacterial contamination, and the brown bar shows the total coliform values. Bacterial contamination of GW is possible due to the capture of contaminated surface water directly into borehole,entrance of contaminants due to poor construction or damage to the lining of the tubewells and the leaching of microbial contaminants directly into aquifer (WHO, 2008). Other potential factors causing prevalence of coliform in tubewells in Quetta city include improper or bad of construction design of tubewell, and insufficient maintenance practices, mineralogy of the overlying sediment and chemical composition (Ferrer et al. 2020) and the spatial density of contamination sources (Knappett et al. 2012).
Table 1 shows the bacterial contamination app-earing in both TW and GW in different towns of Quetta city. The concentration of total coliform bacteria in 31 samples of TW were in the range of 4 CFU/mL to 38 CFU/mL and the bacterial contamination values in each town are listed in the Table 1. However, the E.coli bacteria are present in only 3 samples in Shahbaz town, Jinnah town and Quetta main city. The detailed results of the 31 samples of TW are also shown in Fig. 4, where the blue color bar shows the E.coli presence. Although the Coliform distribution in TW showed spatial variations regarding the overall distribution pattern, the samples collected from the main city were all contaminated with coliform bacteria.Samples collected from Chiltan Town did not contain any contaminant of E.coli or any other coliform bacteria. Table 1 shows that the E.coli and other coliform bacteria values are above the WHO limit for drinking water (0 in any 100 mL sample of water) and also above the Pakistan Standard of water Quality in majority of the samples. Waste of the livestock such as cattle and sheep, goats, pigs and chickens’ feces, are the major sources of Coliform bacteria as mentioned in a study carried out on a dairy farm of Quetta (Khan et al. 2016).
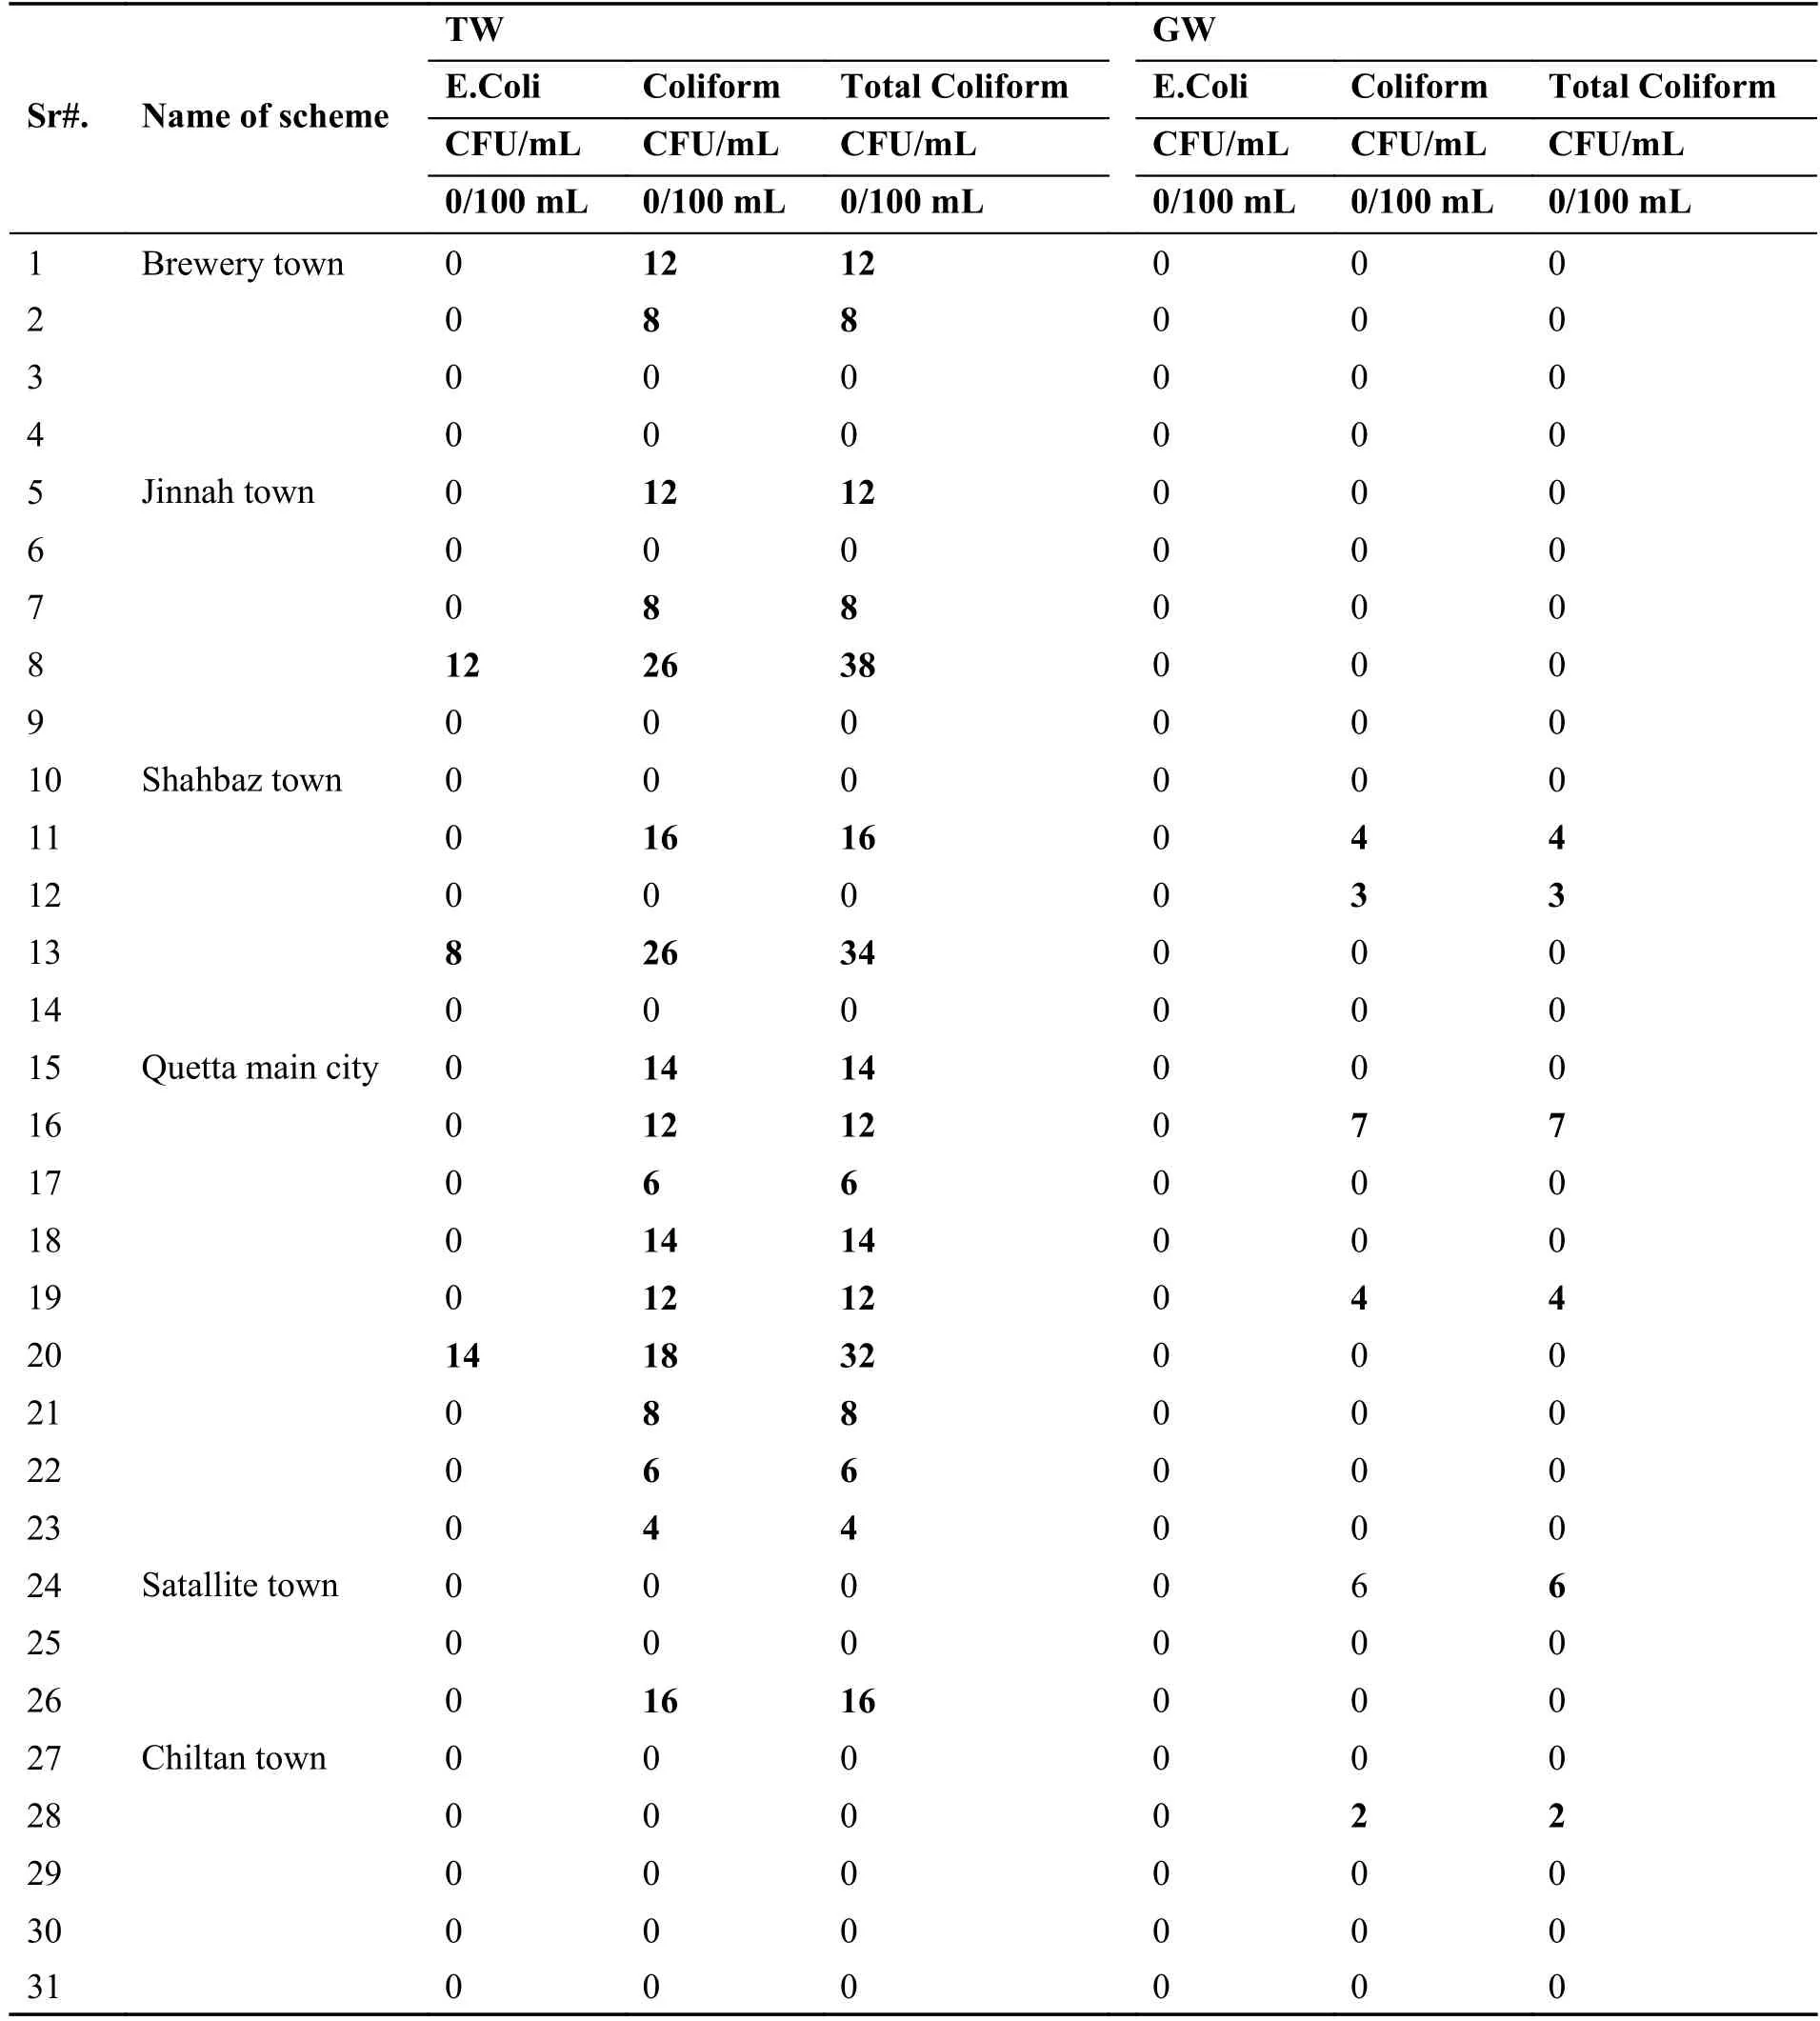
Table 1 Bacterial contamination in TW and GW

Table 2 Physiochemical parameters and microbes in TW

Table 3 Pearson Correlation of physiochemical parameters with Total Coliform in TW
3.2 Statistical calculation of GW and TW
Statistical calculation of physiochemical parameters was done by using IBM SPSS statistic 19,including regression, Pearson correlation and Frequency distribution Histogram. (Table 2, 3, 4, 5 and Fig.5-6).
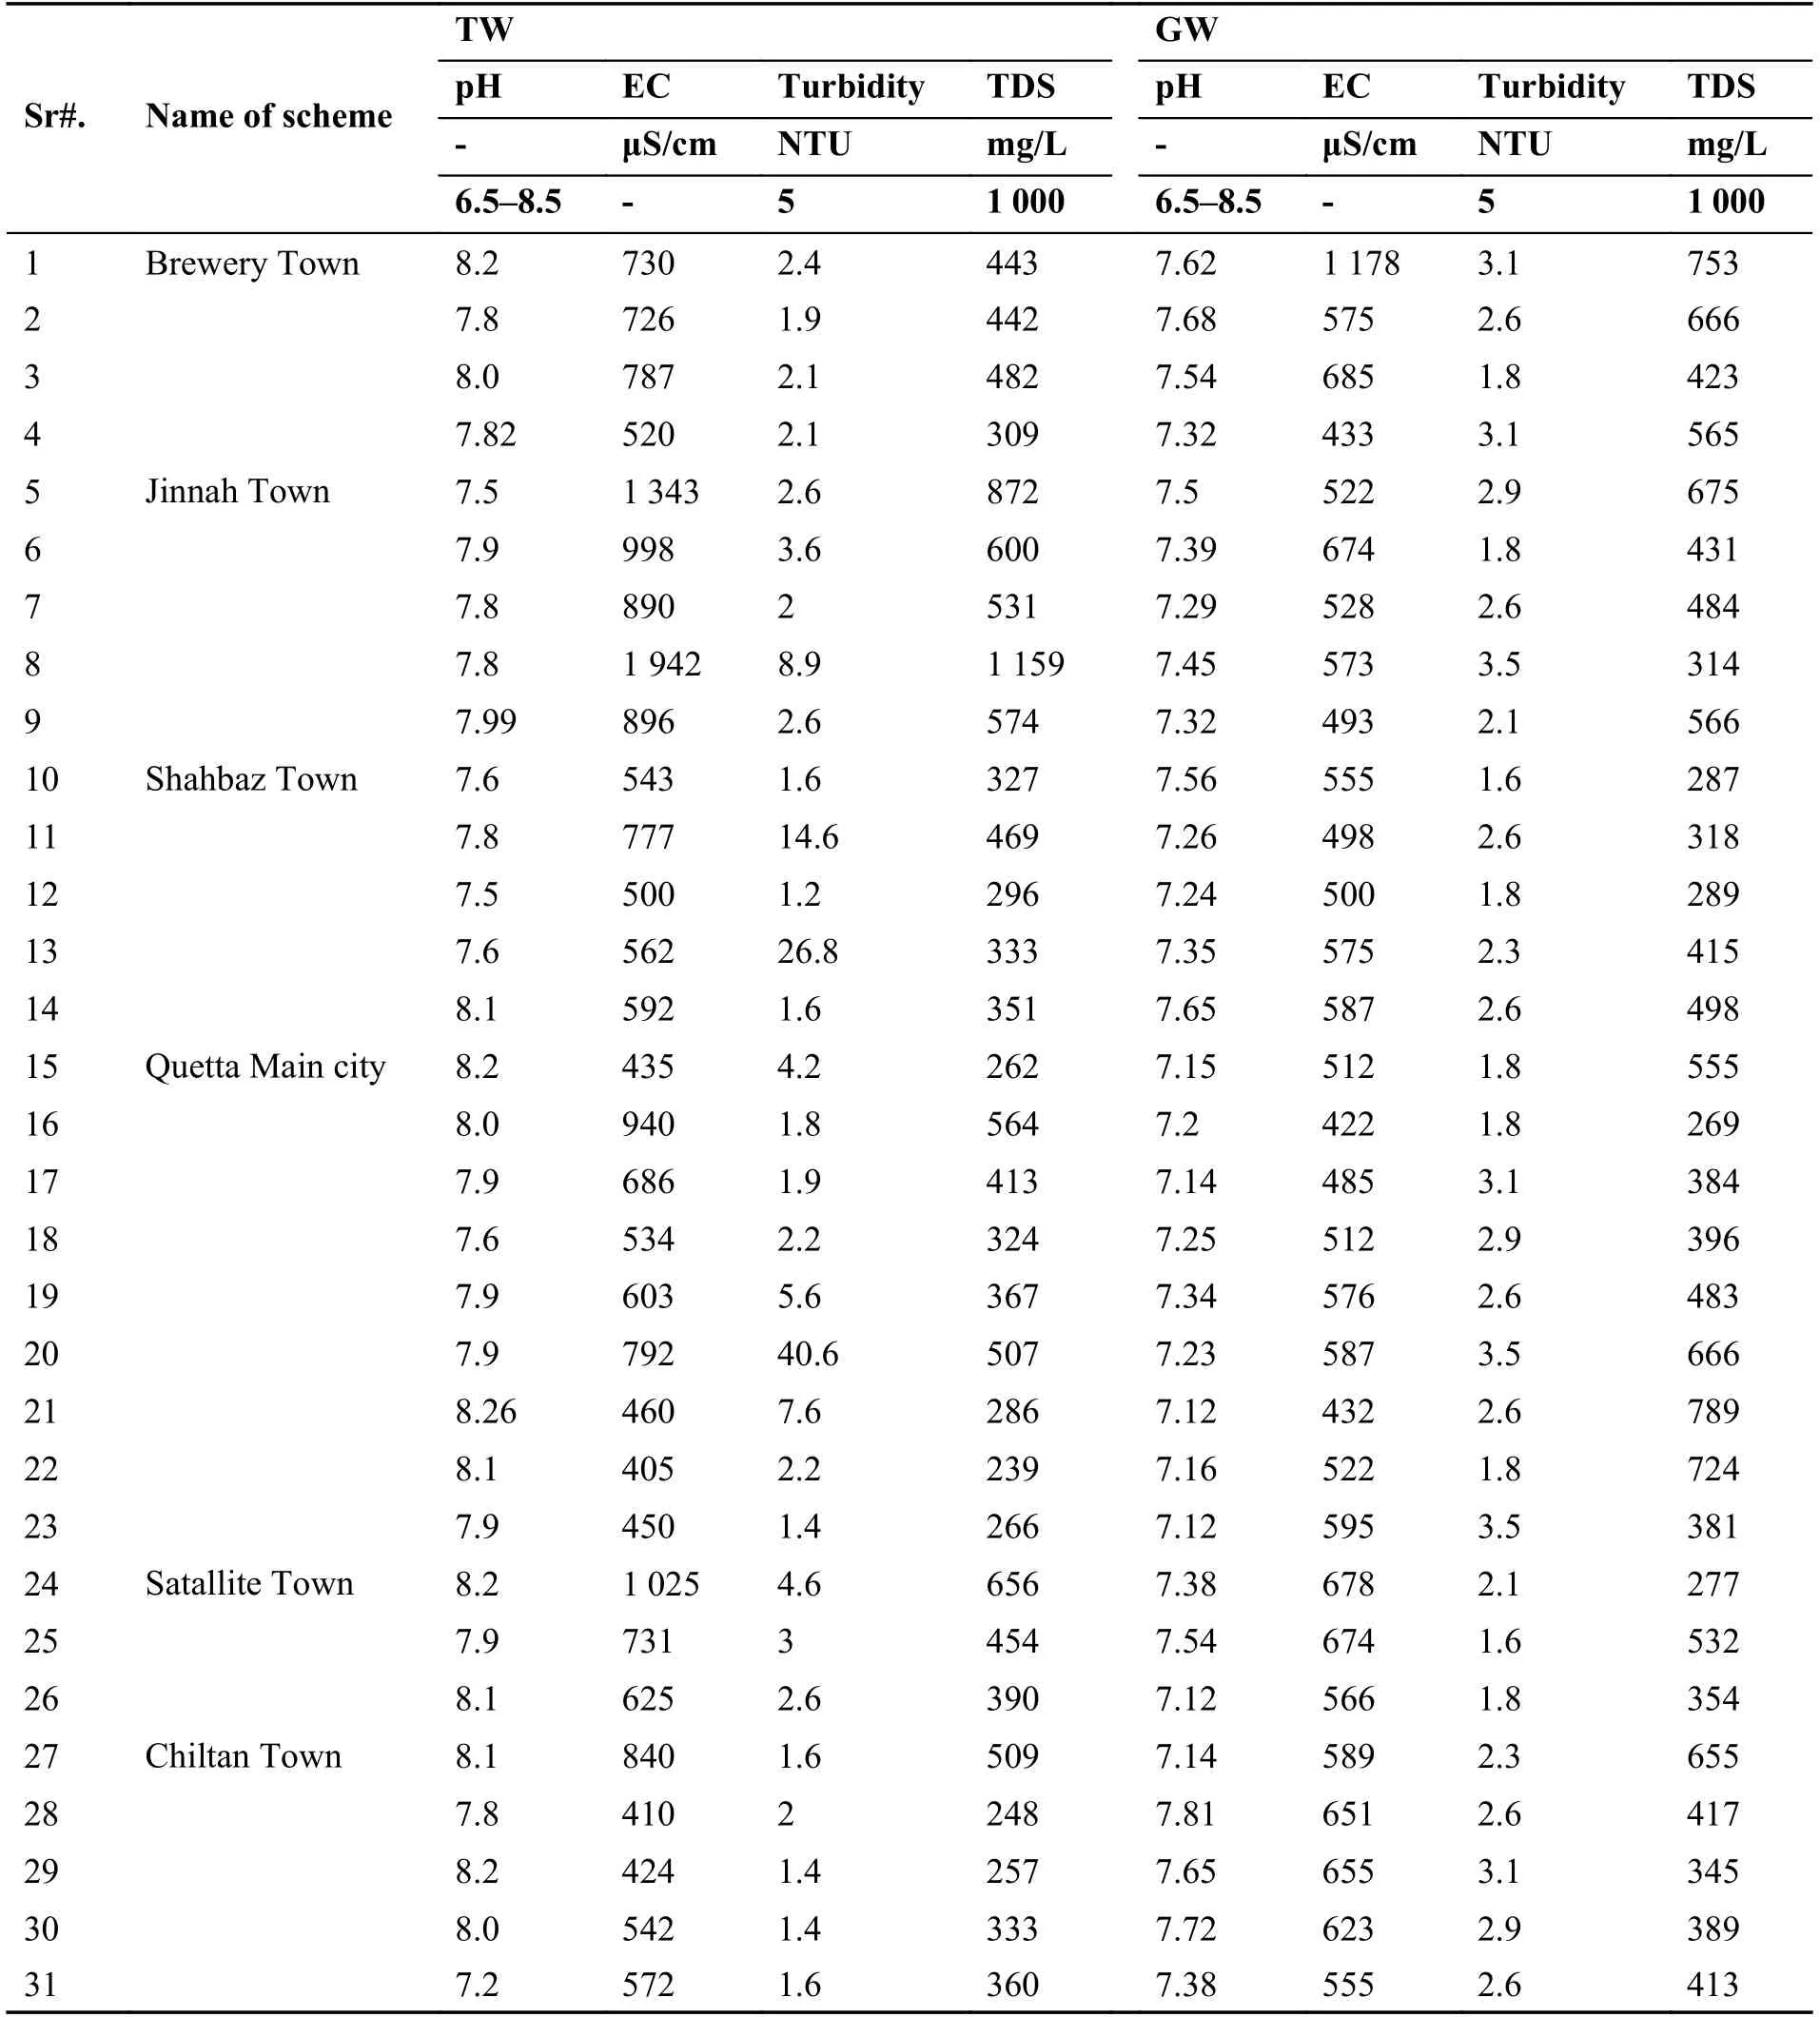
Table 4 Physiochemical Water Quality Analysis of TW and GW
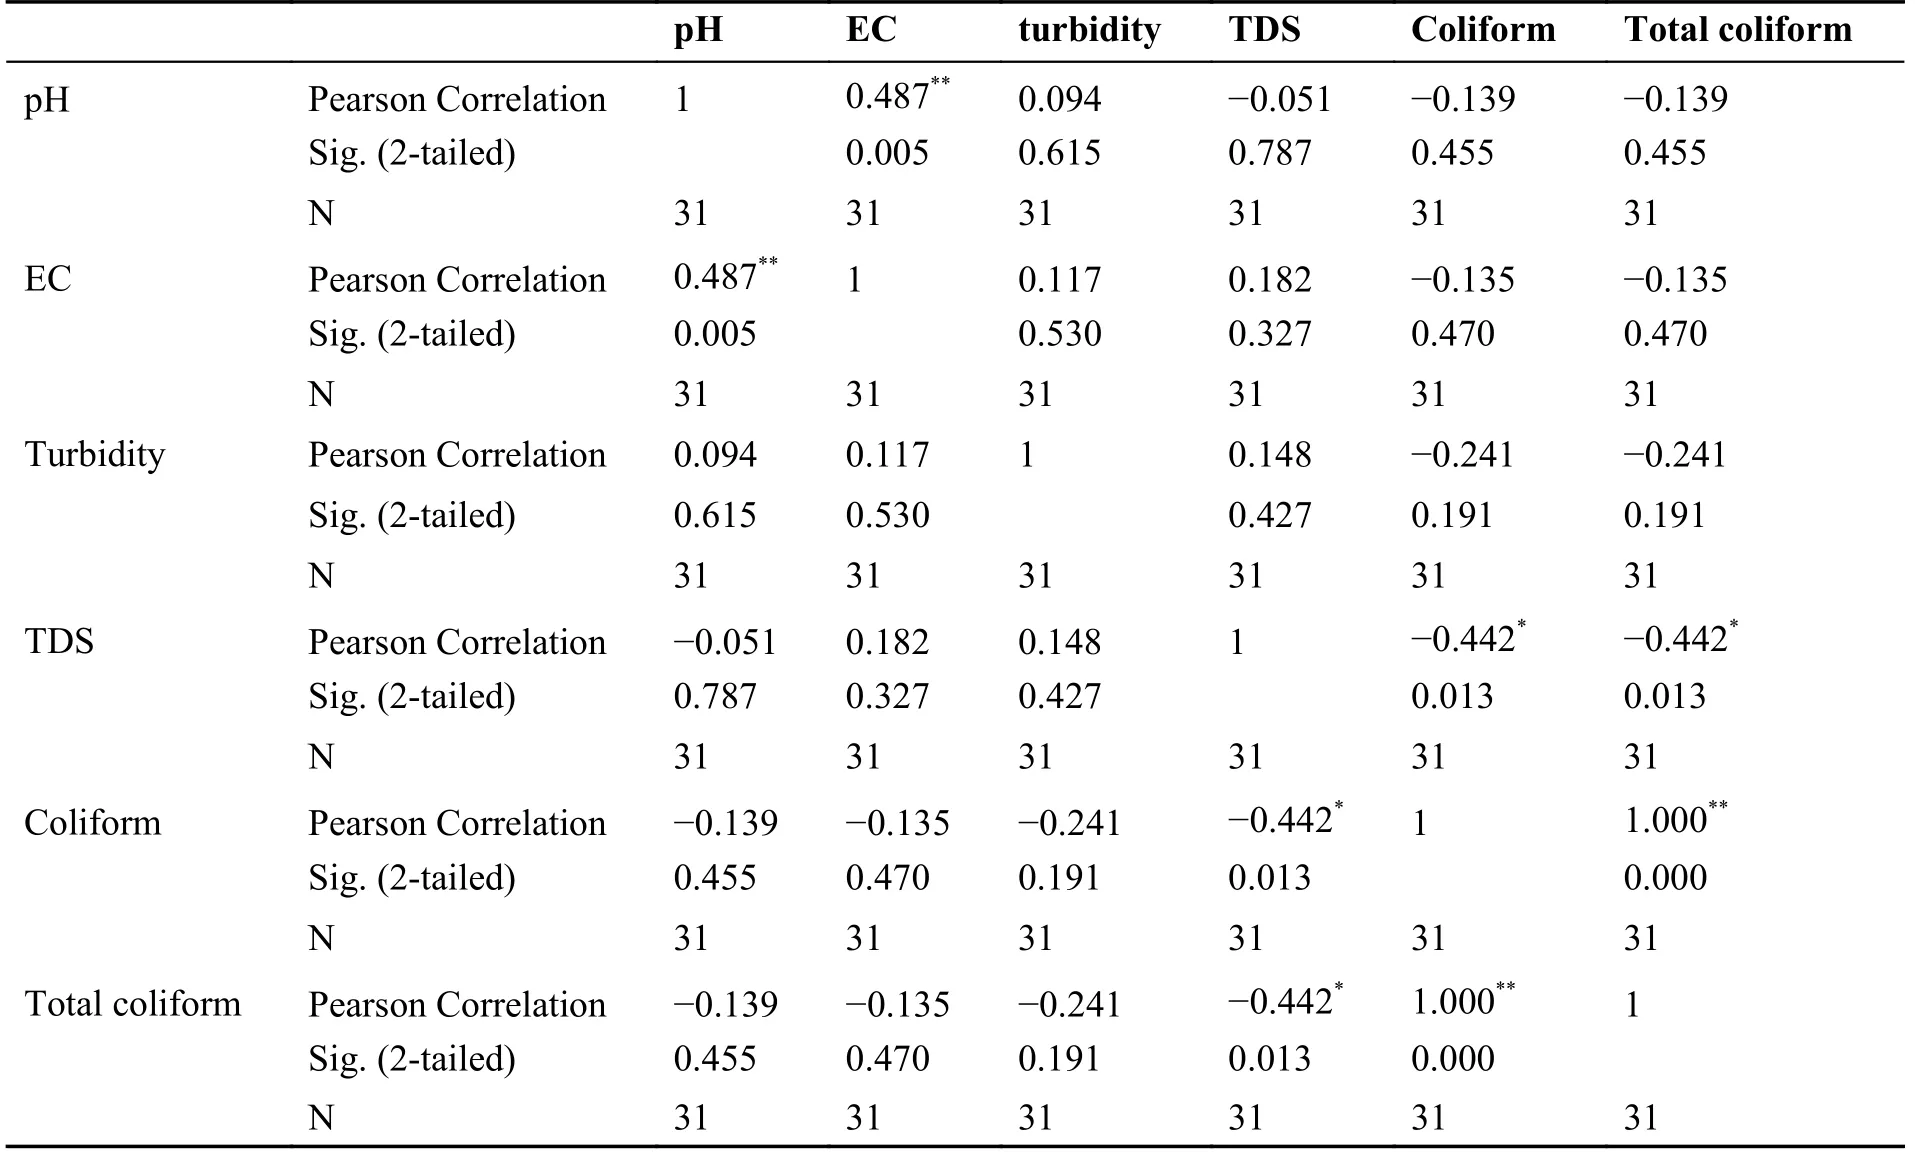
Table 5 Pearson Correlation of physiochemical parameters with total coliform in GW
Pearson correlation significant values (2-tailed)are 0.01 and 0.05. The correlation between EC and E.coli is 0.438, EC and coliform is 0.360 and EC and total coliform is 0.415. Since high EC value indicates a positive impact on the abundance of total coliform bacteria, there is a strong correlation between EC and coliform bacteria. Turbidity also has a significant correlation with E.coli (0.821),coliform (0.591) and total coliform bacteria (0.718).It indicates that higher turbidity in water favors the growth of bacteria. TDS also has a high correlation with E.coli (0.428), and total coliform bacteria(0.403) in TW.
The total coliform bacteria are a dependent variable in histogram of the physiochemical parameters.
3.3 Comparative analysis of GW and TW quality
Fig. 7 shows the comparative analysis of total coliform bacteria in TW and GW in Quetta city by plotting the mean average coliform contamination.Two lines on the graphs indicate that the coliform contaminations in Quetta main city are higher in both the TW and GW, which are 32 CFU/mL and 7 CFU/mL, respectively. The highest difference of coliform contamination is found in Jinnah town,where the Total Coliform in TW reached 38 CFU/mL but 0 in GW, indicating that TW was highly contaminated. It might be due to the remaining stagnant water in the pipelines, negative pressure causing cross-contamination of water supply by leaked sewer pipes or contamination of water in the water storage tank (Oyelakin et al. 2020). Same situation was found in Brewery town. In Satallite town and Shahbaz town, the coliform contamina-tion in TW is also higher than that in the GW.Chiltan town is a different case where the contamination of coliform bacteria is 0 in TW but was detected in the GW samples.

Fig. 3 Bacterial contamination in GW in each town
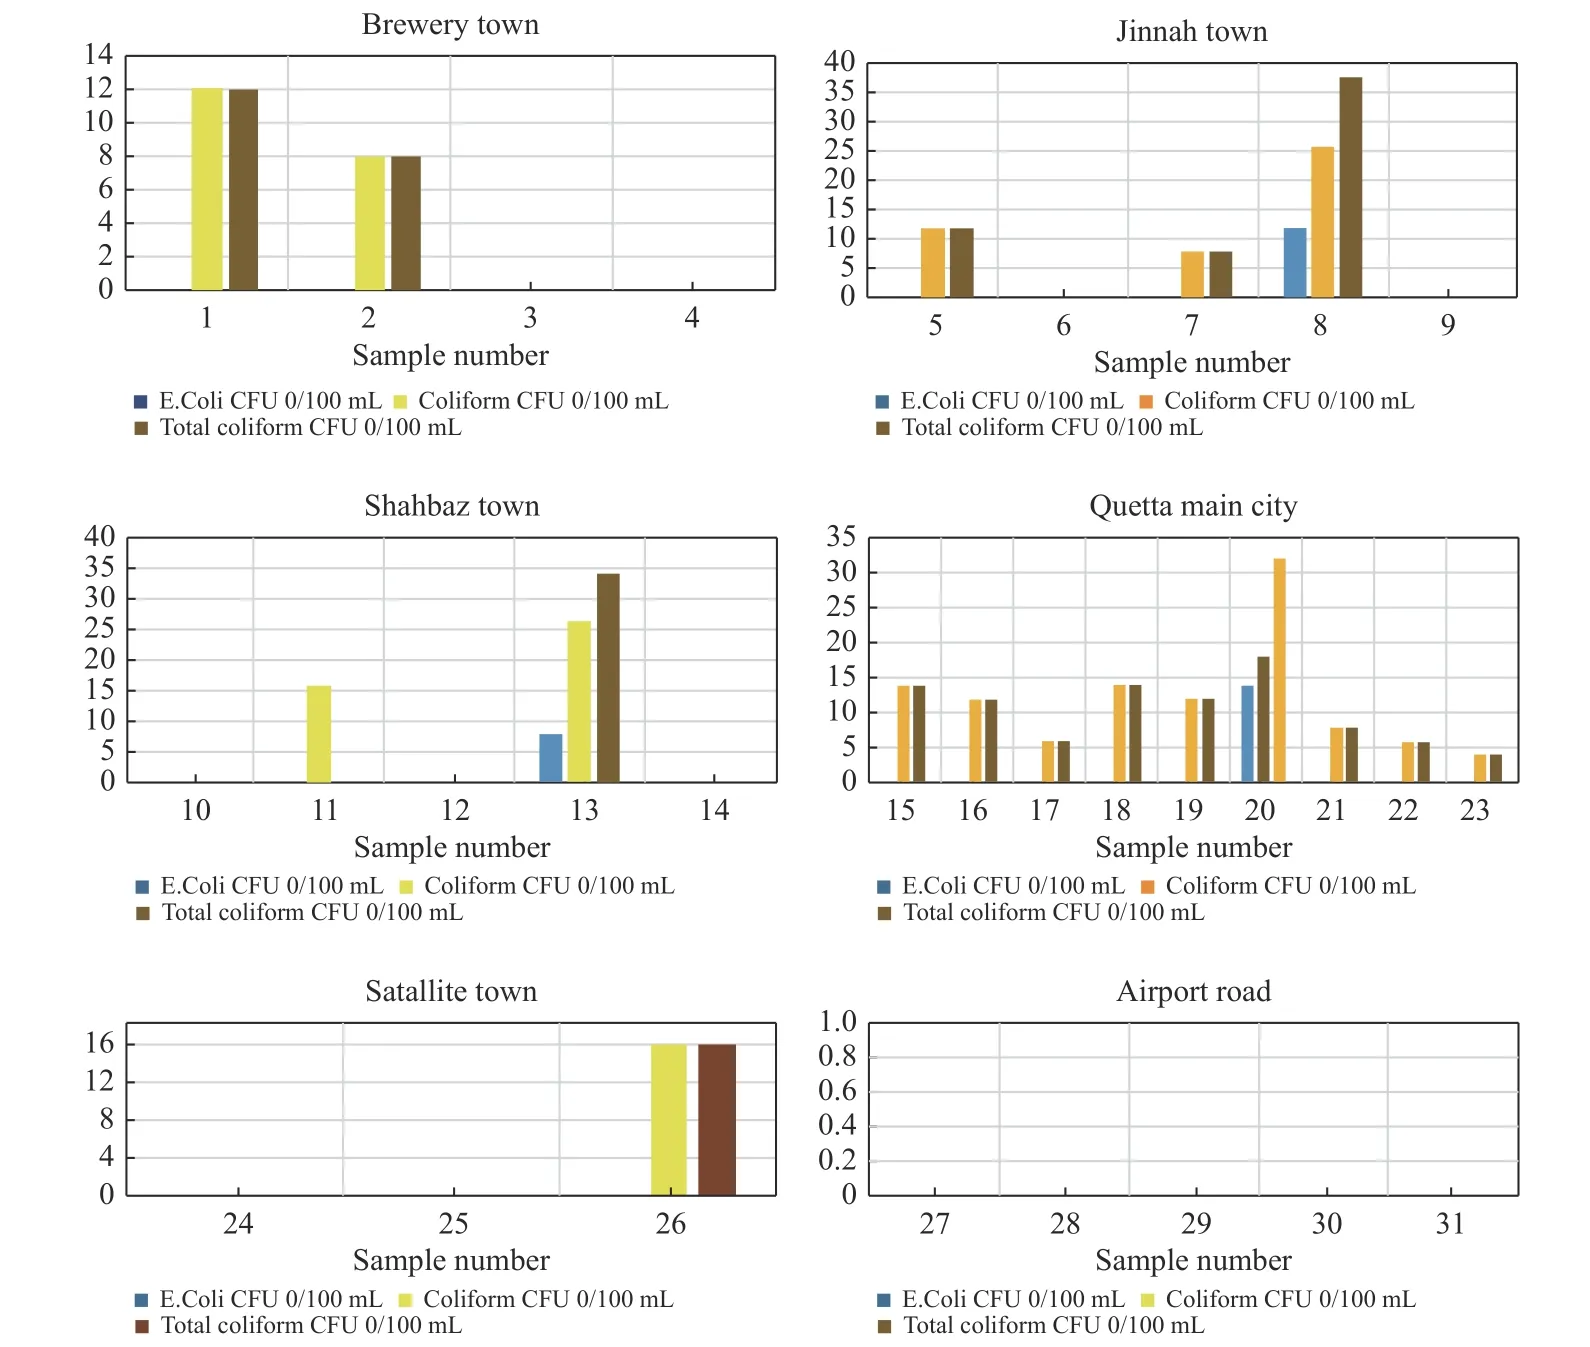
Fig. 4 Bacterial contamination in TW samples in each town

Fig. 5 Histogram of all the variables in TW
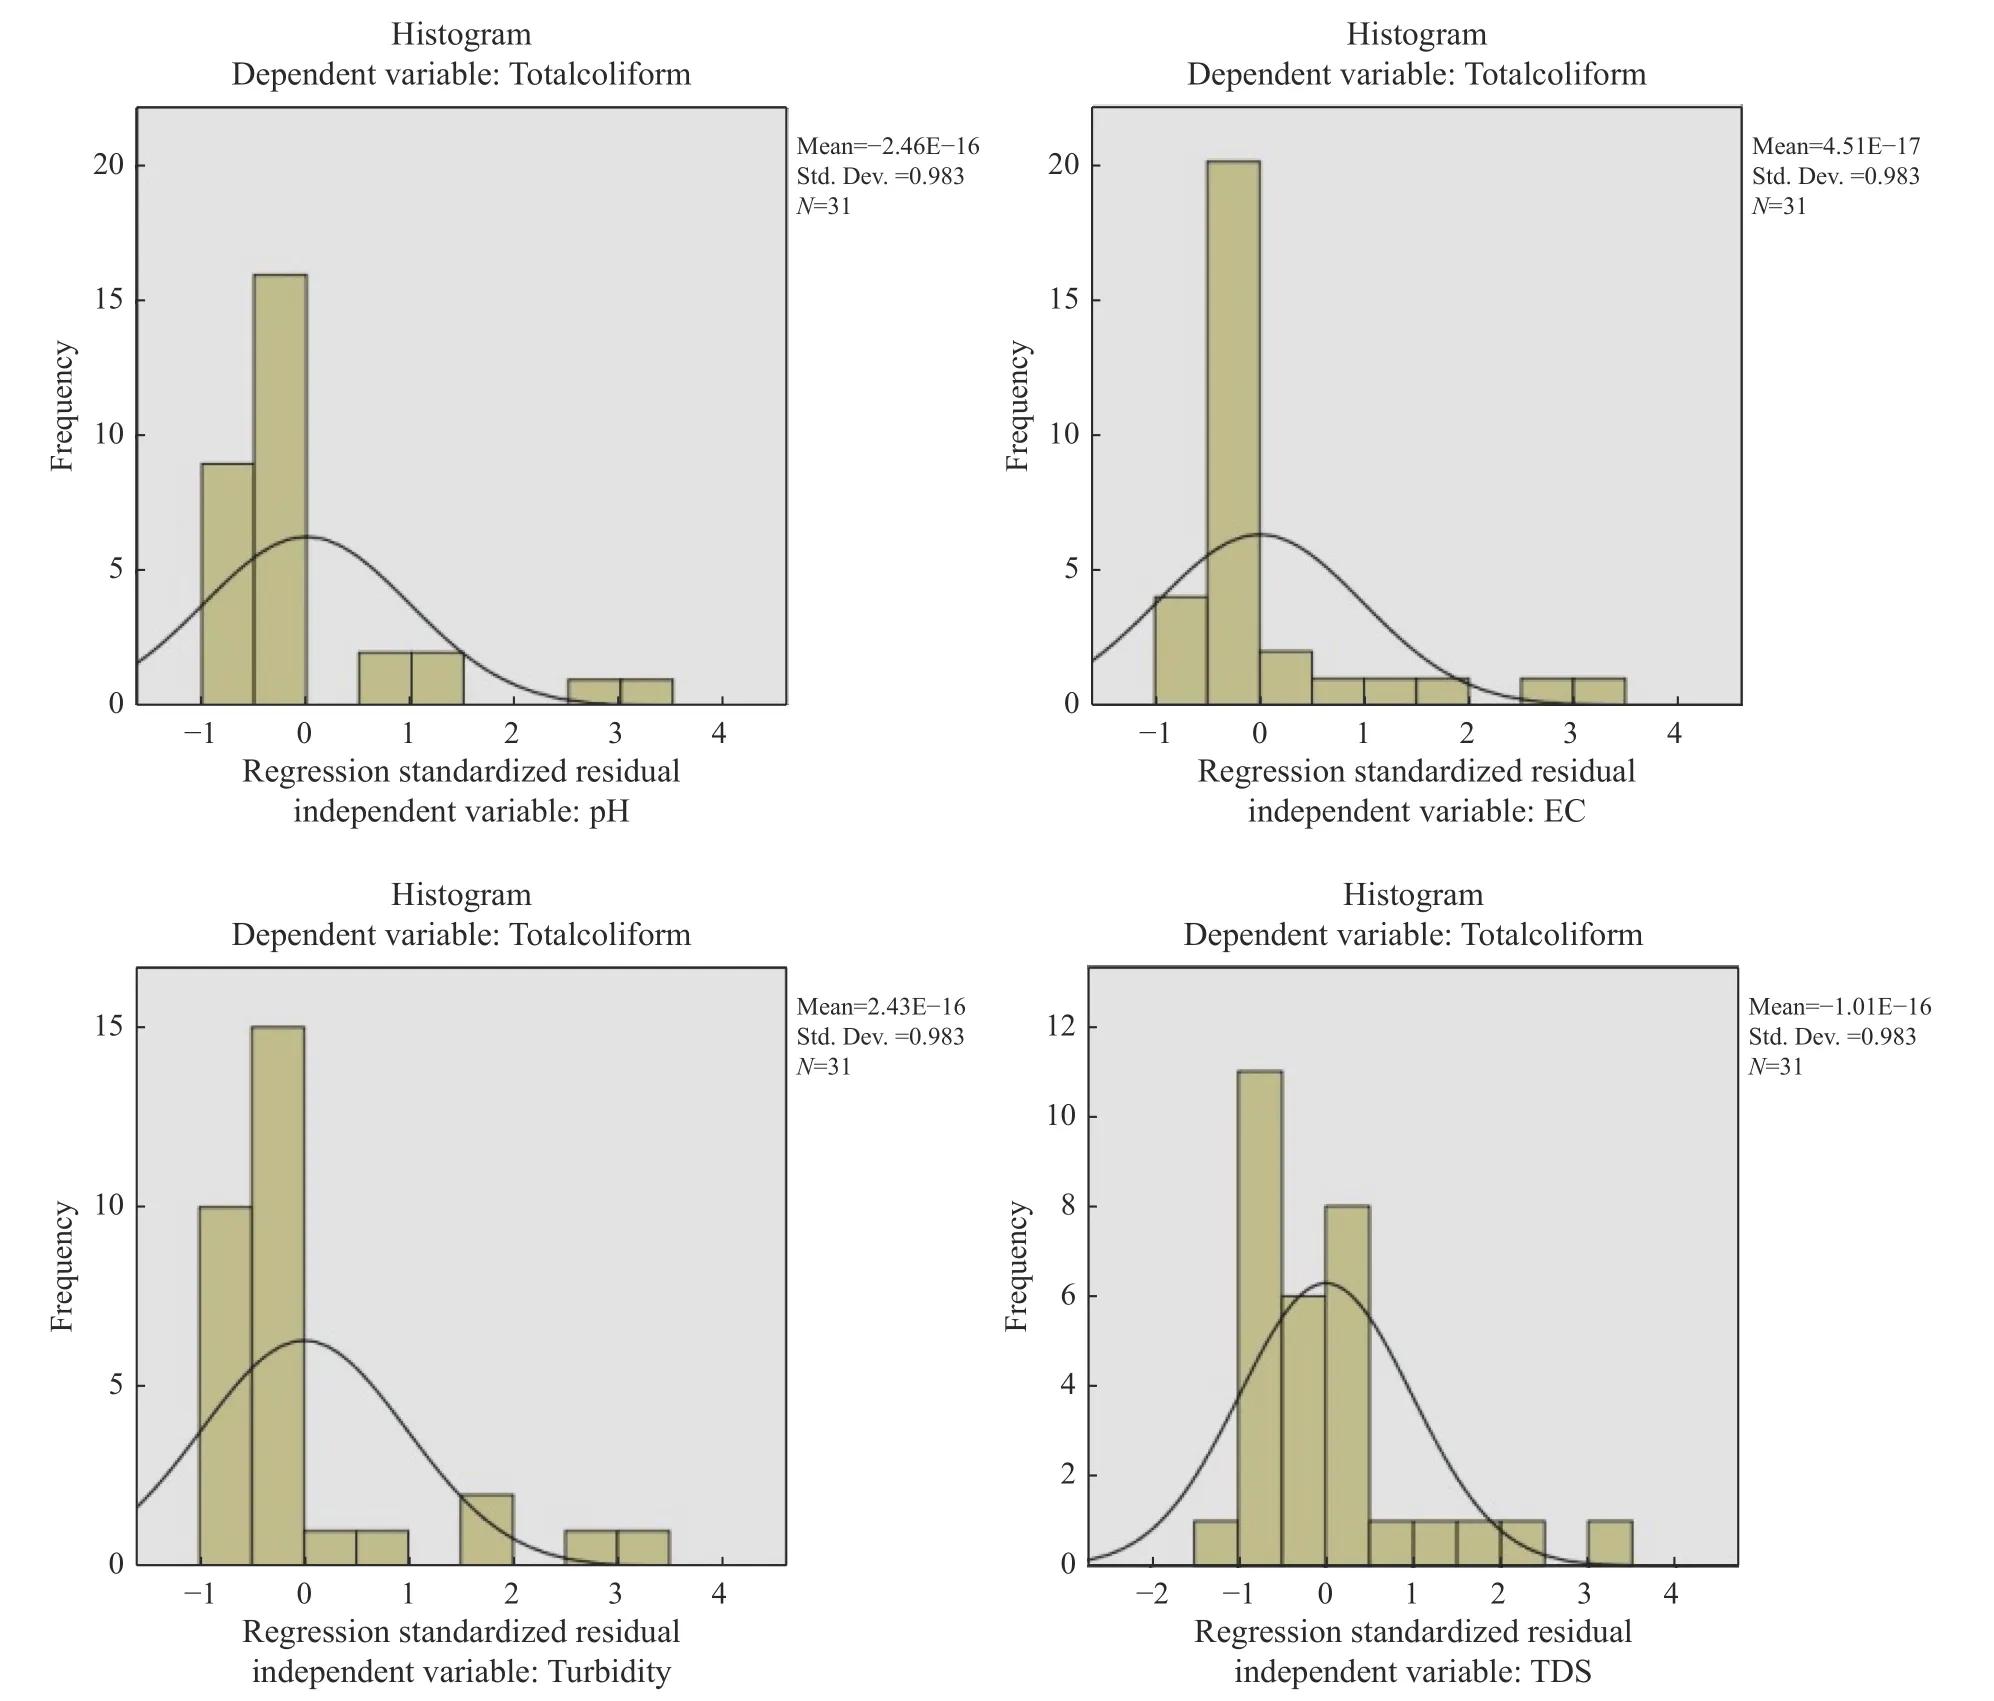
Fig. 6 Histogram of all the variable in GW

Fig. 7 Comparative analysis of Total Coliform contamination in TW and GW
According to WHO guidelines and publications on drinking water quality, it is very essential for people to have access to pure and safe drinking water. It is also a basic right of every human being to have access to safe drinking water according to United Nations (UN) (Ahmed et al. 2020). Globally, 1.8 million deaths occur as a result of water borne diseases annually, with 88% related to unsafe water supply, poor sanitation, and lack of personal hygiene (WHO, 1993). Our research findings reveal that the residents of Quetta city are among this global statistic of people who lack access to safe drinking water, as the Coliform and E.coli concentrations in TW exceeded the WHO drinking water standards. Increased bacterial contamination in TW in most of the towns of Quetta city can also be attributed to the dense population,leaked sewerage, and water distributary pipes.Whereas bacterial contamination of GW is probably due to ingress of contaminated surface water into borehole, entrance of contaminants due to poor construction or damage to the lining of the tubewells and the leaching of microbial contaminants directly into aquifer (WHO, 2008). Other potential factors causing prevalence of E.coli in tubewells in Quetta include improper or bad construction design of tubewell, and insufficient maintenance practices, mineralogy of the overlying sediment and chemical composition (Ferrer et al. 2020)and the spatial density of contamination sources(Knappett et al. 2012). The review paper explored that anthropogenic activities are the biggest contributor to the contamination of both groundwater and surface water in Balochistan (Akhtar et al.2021). According to the survey results, majority population of the Quetta city are suffering from diarrheal disease due to poor drinking water quality and this situation needs to be changed immediately.
3.4 Physiochemical parameters of water quality
3.4.1 pH
WHO has recommended maximum permissible limit of pH from 6.5 to 8.5. pH values in GW range between 7.39-7.81 and pH values in TW ranges between 7.50-8.20, both of which are within the WHO standards.
3.4.2 Turbidity
Turbidity level of drinking water should always be less than 5 NTU. The turbidity values of TW in Quetta main city are found to have the highest values of 5.6, 7.6 and 40.6 (NTU), 26.8 and 14.6(in Shahbaz town) and 8.9 (in Jinnah town),whereas turbidity values of GW are generally below standard value.
3.4.3 Electrical conductivity
EC value should not exceed 500 μS/cm according to the WHO standards. In this research the highest value of EC obtained in TW is 1 942 μS/cm (in Jinnah town), 1 343 μS/cm (in Brewery town) and 1 025 μS/cm (in Satallite town). Whereas the EC of GW is below 900 μS/cm in Chiltan, and a higher value of 1 178 μS/cm is found in Brewery town while the rest are below 700 μS/cm.
3.4.4 Total dissolved solids (TDS)
Water with total dissolved solids (TDS) level of less than about 600 mg/L is considered to be good and palatable. Generally drinking water becomes unpalatable with TDS levels greater than 1 000 mg/L. TDS values in TW from Brewery Town are 666 mg/L, 565 mg/L, 675 mg/L and 753 mg/L,most of which are above the recommended limit of 600 mg/L. TDS values in the TW from the rest of the towns are all below the recommended limit.TDS in GW from Jinnah Town is the highest,1 159 mg/L, while GW from all other towns have TDS below the recommended limit. Table 5 shows the water quality analysis result on physiochemical parameters both GW and TW conducted in laboratory.
3.5 Questionnaire results
Questionnaires results from 100 residents in Quetta city are shown in Fig. 8. It is concluded that 30%of the residents are depending upon WASA water network system for daily use, 29.7% are depending on water tanks, 26.7% have their own private wells, and only 12.9% are using mineral water for drinking purpose. About 52.9% of the people treat the water before drinking, and the most common water treatment method used among the population is filtering and then boiling, while the least used is letting the water stand and settle in the water tanks.26% of the residents have open sewage system in their towns and 31% have experienced leakage of sewage pipes. Nearly 54% of the residents proclaimed that the water distributary system of their town has been contaminated by the sewerage system and 41% have been suffering from the diarrheal disease due to poor water quality. A study conducted in Quetta city shows that the built-up area has increased over 13% in last decade (Dawood et al.2021) which has affected the groundwater quality.
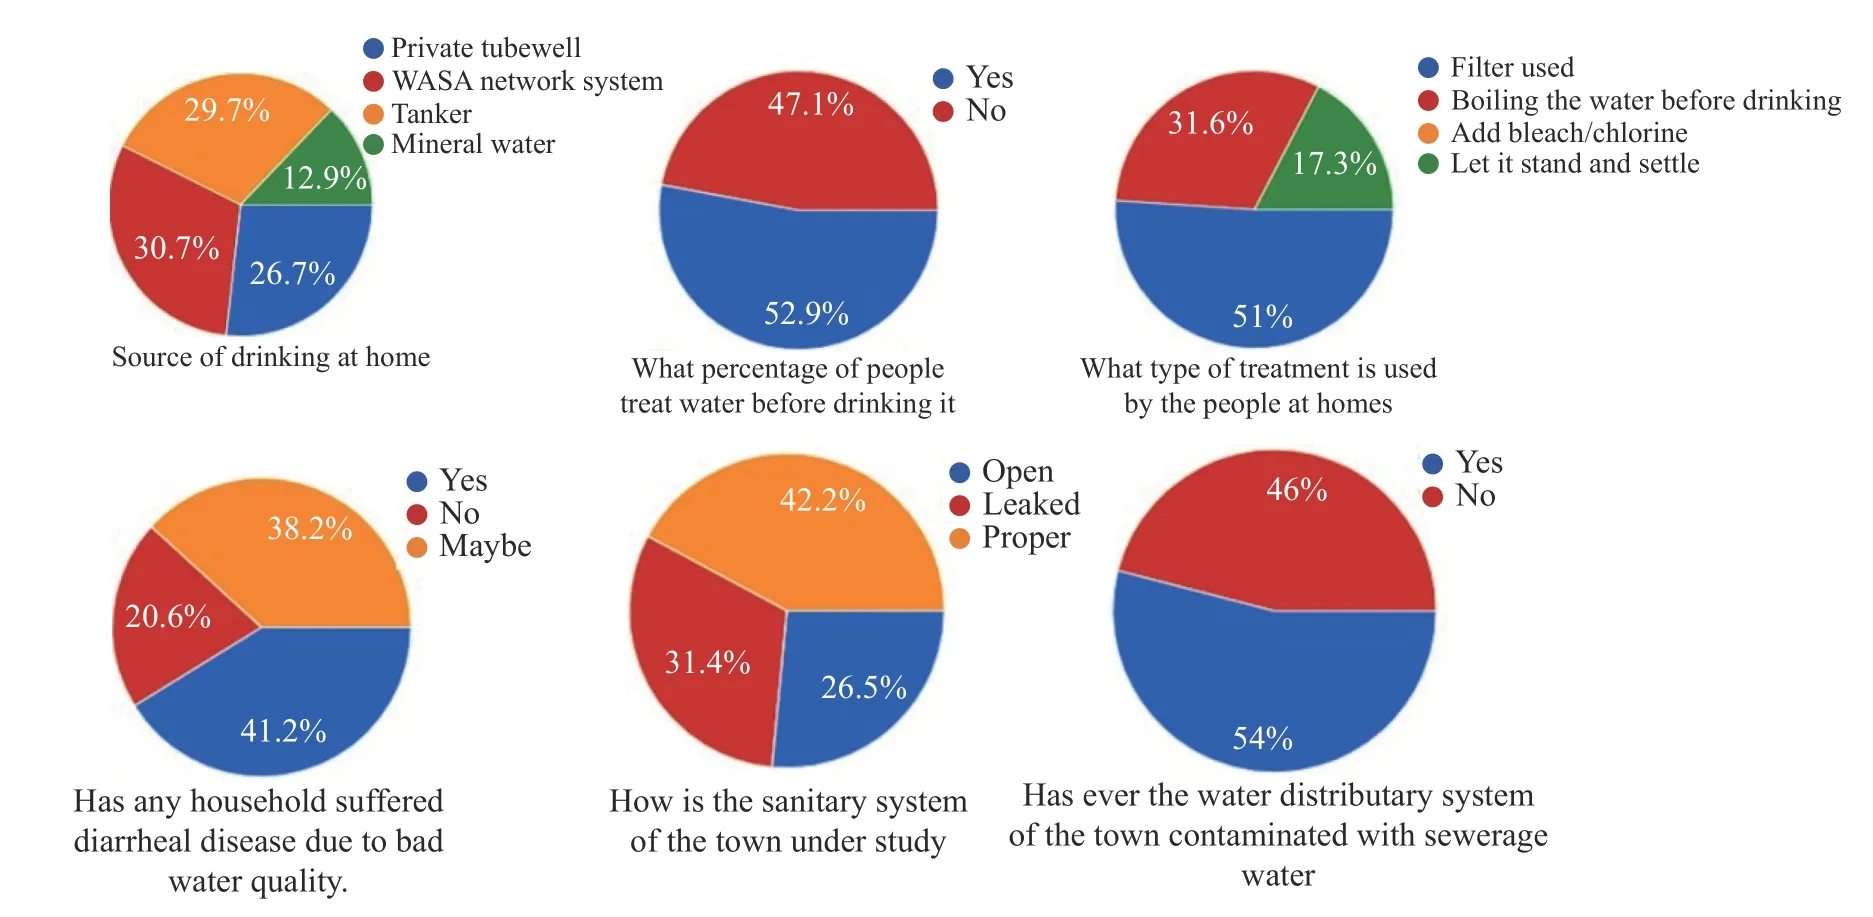
Fig. 8 Summary of questionnaires results
4 Conclusions and recommendations
Based on the results and findings of this research,it is found that drinking water from abstraction sites (GW) and point of use (TW) are both microbiologically contaminated and therefore presents significant health risks to consumers of such water.Some simple and convenient improvements can be made during well construction to prevent the contamination of drinking water with coliform and other pathogenic bacteria and to reduce the cases of diarrheal diseases caused by drinking untreated GW. TW is more contaminated than GW, indicating that water is getting contaminated within the distributary system. Results of the microbial assessment of TW showed bacteria contamination of total coliform in all the towns of the Quetta city except Chiltan town. E.coli is found in the TW of Jinnah town, Shahbaz town and Quetta main city,which needs special attention. According to the questionnaires, most people in the city are suffering from the contamination of sewage water within water distributary system and above 50% of the city residents are treating the water before drinking. The most common method of water treatment is by using filters available in the local market. Boiling is the method with second preference.
It is strongly recommended to cover the sewage networks completely and to construct better facilities sewage wastewater transportation and water treatment in Quetta city. Regular leakage tests on the PVC pipes of private wells should be carried out to understand the situation, and to understand the process of leaking well pipes causing the fecal contamination in the unsealed private wells. More reliable wastewater disposal network should be provided for commercial and small industries. Untreated municipal waste is largely used for irrigation in Quetta city as a source of contamination of groundwater, which needs to be banned immediately. To reduce the occurrence of water borne diseases, conventional household water treatment methods should be used before consuming the water.
General campaigns can be started to promote public awareness of water security at schools,colleges, and even universities. These campaigns should focus on the significance of clean and safe drinking water and how individuals of a community can contribute to it. Safety control methods can be taught to the rural communities for storing water in houses and simple drinking water disinfection technology can be adopted.
Acknowledgements
The authors would like to thank the Higher Education Commission of Pakistan, who has provided financial support for this research work through the project Evaluation of the groundwater and explore recharge zone of depleting aquifer in the Quetta valley (Project No: 9474/Punjab/NRPU/R&D/HEC/2017) .
杂志排行
地下水科学与工程(英文版)的其它文章
- Numerical simulation of operation performance on production and injection of a double well geothermal system in Kailu Basin, Inner Mongolia
- Spatial confirmation of termite mounds as Bio-geo indicator for groundwater occurrences using ground magnetic survey: A case study from Perambalur Region of Tamil Nadu, India
- Research on the characteristics and influencing factors of terrestrial heat flow in Guizhou Province
- Holistic approach of GIS based Multi-Criteria Decision Analysis (MCDA)and WetSpass models to evaluate groundwater potential in Gelana watershed of Ethiopia
- Genetic model and exploration target area of geothermal resources in Hongtang Area, Xiamen, China
- Assessment of water level threshold for groundwater restoration and overexploitation remediation the Beijing-Tianjin-Hebei Plain
