Holistic approach of GIS based Multi-Criteria Decision Analysis (MCDA)and WetSpass models to evaluate groundwater potential in Gelana watershed of Ethiopia
2022-06-27WondesenFikadeNiwayDagnachewDanielMollaTarunKumarLohani
Wondesen Fikade Niway, Dagnachew Daniel Molla, Tarun Kumar Lohani*
1 Faculty of Hydraulic and Water Resources Engineering, Arba Minch Water Technology Institute, Arba Minch University, Ethiopia.
2 Faculty of Meteorology and Hydrology, Arba Minch Water Technology Institute, Arba Minch University, Ethiopia.
Abstract: Appropriate quantification and identification of the groundwater distribution in a hydrological basin may provide necessary information for effective management, planning and development of groundwater resources. Groundwater potential assessment and delineation in a highly heterogeneous environment with limited Spatiotemporal data derived from Gelana watershed of Abaya Chamo lake basin is performed, using integrated multi-criteria decision analysis (MCDA), water and energy transfer between soil and plant and atmosphere under quasi-steady state (WetSpass) models. The outputs of the WetSpass model reveal a favorable structure of water balance in the basin studied, mainly using surface runoff. The simulated total flow and groundwater recharge are validated using river measurements and estimated baseflow at two gauging stations located in the study area, which yields a good agreement. The WetSpass model effectively integrates a water balance assessment in a geographical information system (GIS)environment. The WetSpass model is shown to be computationally reputable for such a remote complex setting as the African rift, with a correlation coefficient of 0.99 and 0.99 for total flow and baseflow at a significant level of p-value<0.05, respectively. The simulated annual water budget reveals that 77.22% of annual precipitation loses through evapotranspiration, of which 16.54% is lost via surface runoff while 6.24% is recharged to the groundwater. The calibrated groundwater recharge from the WetSpass model is then considered when determining the controlling factors of groundwater occurrence and formation,together with other multi-thematic layers such as lithology, geomorphology, lineament density and drainage density. The selected five thematic layers through MCDA are incorporated by employing the analytical hierarchy process (AHP) method to identify the relative dominance in groundwater potential zoning. The weighted factors in the AHP are procedurally aggregated, based on weighted linear combinations to provide the groundwater potential index. Based on the potential indexes, the area then is demarcated into low,moderate, and high groundwater potential zones (GWPZ). The identified GWPZs are finally examined using the existing groundwater inventory data (static water level and springs) in the region. About 70.7% of groundwater inventory points are coinciding with the delineated GWPZs. The weighting comparison shows that lithology, geomorphology, and groundwater recharge appear to be the dominant factors influence on the resources potential. The assessment of groundwater potential index values identify 45.88% as high,39.38% moderate, and 14.73% as low groundwater potential zones. WetSpass model analysis is more preferable in the area like Gelana watershed when the topography is rugged, inaccessible and having limited gauging stations.
Keywords: Groundwater potential; Gelana watershed; WetSpass; Thematic layers; Multi-Criteria decision analysis; Analytical hierarchy process
Introduction
About 34% of the entire population of Ethiopia depends on potable water supply, and 70% of the water supply in the towns and rural areas emanates from groundwater sources through developing springs, bore wells, and shallow wells (IAEA, 2013).The groundwater consumption of the country has been increasing from time to time (Andualem and Demeke, 2019). As part of a southern main Ethiopian rift valley, Gelana Watershed is characterized by the fact that the intermittent river tributaries and main/perennial river have limited amount of water resources in the dry season. Furthermore, there are many challenges including high spatial and temporal variability in rainfall, global climate change,deforestation, land degradation, and high population growth rate (Kidanewold et al. 2014). These challenges put immense pressure on groundwater resources. Hence, this forces the local communities to use subsurface water not only for drinking but also for domestic and in some cases for irrigation purposes. However, there is a big gap of studies done regarding groundwater potential in the area.Understanding the groundwater systems over Ethiopian main rift, including the study area under a complex physiographic setting, is difficult and a key issue for the sustainable management, planning and development of water resources in the area which has frequently experienced a water scarcity associated with its arid/semi-arid climate ( Molla et al. 2019, Molla and Tegaye, 2019; Yang et al.2019; Liu et al. 2020; Li et al. 2021). The key challenges in the lake basin stem from in-depth understanding of groundwater exploitation and distribution (Berahanu and Hatiye, 2020; Hu et al.2020; Cao et al. 2022) to support the region’s rapid population growth. The occurrence and distribution of groundwater depend on geophysical,hydrological, lithological, atmospheric, soil and topographic nature (Fanta et al. 2014; Andualem and Demeke, 2019).
Using rainfall distribution as the sole factor to map and estimate groundwater potential in the Ethiopian watersheds with complex topographic nature may result in misleading conclusions (Yifru et al. 2020). The common methods used to estimate groundwater recharge are chloride mass balance, empirical, soil water balance and water level fluctuation methods. These point estimate methods were used as a base extrapolation or regionalization over a large area whose outputs are not evident, whereas physically distributed approaches are more viable ones to improve spatial estimates(Batelaan and De Smedt, 2007; Wang et al. 2015).GIS-based MCDA and spatially distributed modeling approach necessitates evaluating the groundwater potential zones and estimating water balance components over the Gelana watershed as justified in previous studies (Molla et al. 2019; Batelaan and De Smedt, 2001 and 2007; Al Kuisi et al.2013). WetSpass model can be employed to simulate groundwater potential, using a seasonal or annual time step, which dramatically reduces the requirements for input data. This model shows a number of advantages for modelling the remote areas and it is capable for regional parameter modification, whereas groundwater potential zone(GWPZ) mapping using GIS techniques and MCDA has more advantages over the conventional processes, including the ability to define hydrological and hydrogeological features of a study area in a spatial context (Nair et al. 2017).
The selection of parameters for groundwater potential assessment using the MCDA approach generally incorporates site-specific slope values,land cover, geology, and aquifer characteristics(Machiwal et al. 2011). The choice of parameters is often decided by data availability, regional information and outcome objectives (Bera et al.2020). For instance, Gintamo (2015) used eight different groundwater controlling factor thematic maps (such as geology, soil, geomorphology,drainage density, lineament density, rainfall, slope and land use) to evaluate the groundwater potentiality of Bilate river catchment. In this study, five parameters such as lithology, geomorphology,lineament density, drainage density and groundwater recharge are used to delineate groundwater potential zones, of which groundwater recharge is simulated by WetSpass model as a function of slope angle, land-use, soil texture, groundwater depth and precipitation, potential evapotranspiration, temperature and wind speed.
There are several studies conducted across various watersheds in the world to evaluate the potential of groundwater, but the WetSpass and MCDA methods have hardly been adopted to calculate groundwater potential more proximately.The validity of the qualitative and quantitative analyses obtained from both GIS techniques and the WetSpass model are substantiated. The identified and organized groundwater potential maps and estimates of recharge may provide information for groundwater development, which involves productive water supply wells for domestic and other purposes.
1 Study area
Galena Watershed is located in the Abaya-Chamo sub-basin of the Rift Valley Lake basin. It is located at the eastern border of the Great Rift Valley and drains to Lake Abaya. The watershed area is defined by the geographic coordinates between 5°25′12′′N-6°13′48′′N and 37°49′48′′E-38°21′00′′E, having a catchment area of about 3 445 km2(Fig. 1). The topographic elevation of the study area ranges between 1 179 and 3 090 meter above mean sea level (m.a.s.l)with an average annual rainfall ranging from 857.15 mm to 1 418.46 mm with a mean rainfall of 1 066.35 mm. The mean monthly temperature is about 19.39℃ which varies between 18.10℃ and 21.18℃.
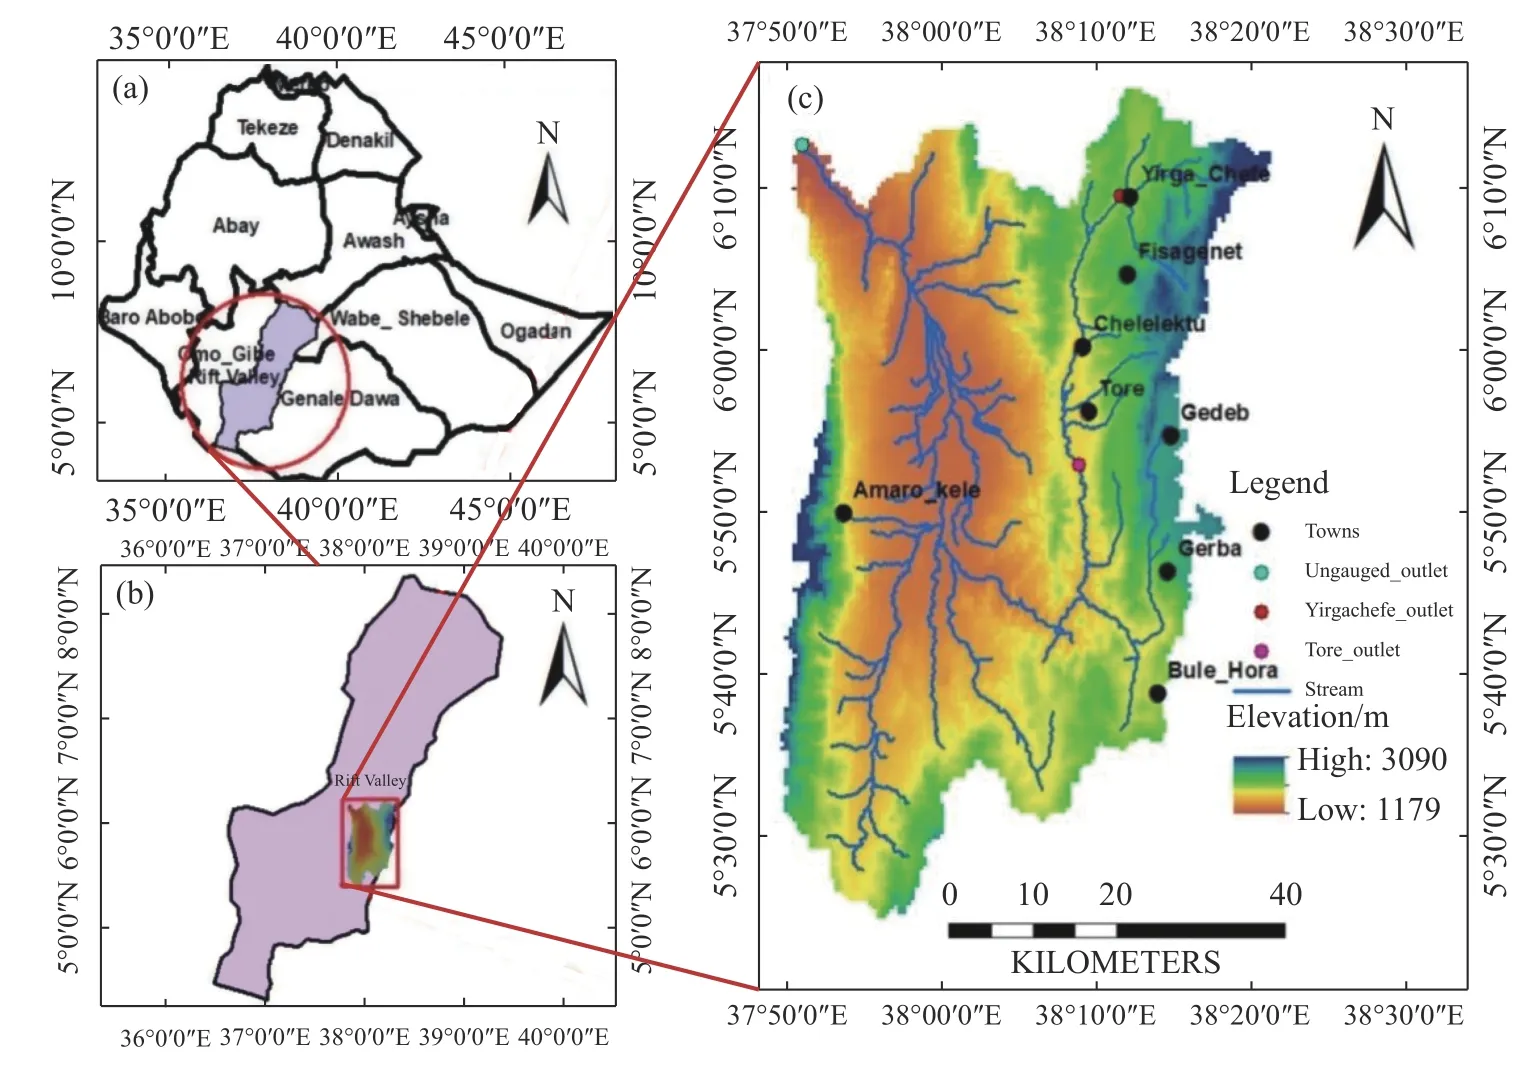
Fig. 1 Location map of the study area
The Gelana watershed is characterized by a complex rift zone associated with a spatiotemporal variation in hydrogeological, hydro-climatic features and high data limitation. Understanding the spatiotemporal distribution of the recharge and GWPZ enhances the understanding of the resources for sustainable management (Yifru et al. 2020).
The geology of the basin is highly complicated and extremely faulted, as described in many previous studies (Molla et al. 2019; Molla and Tegaye, 2019; Asrat, 2016). The study area is covered by high and low-grade metamorphic rocks of the Mozambican belt, pre-rift Tertiary volcanic succession and Late quaternary Pleistocene - Holocene fluvial - lacustrine sediments. The Precambrian is underlain by a succession of slightly weathered, variously colored, strongly folded and refolded, distinctly banded, medium to coarsegrained, high-low grade gneisses, and subordinate schists. Though the gneissic rocks are exposed as elongated ridges occupying large territories, they are generally slightly weathered where the bedrocks are exposed on the surface. Pre-rift Tertiary volcanic succession of the Oligocene -Miocene volcanic rocks in the Gelana area are represented by a succession of basaltic and trachytic-rhyolitic rocks with subordinate pyroclastic associations. These volcanic rocks are represented by a succession of transitional, mildly alkaline, and sub alkaline, aphyric to porphyritic basalts with minor rhyolites (TV1, Try, TV2, Ttr).The basaltic units (TV1) and the interlayered basaltic unit (TV2) generally have undergone moderate to high-intensity weathering, forming a relatively thick weathered material (regolith).Late quaternary Pleistocene - Holocene fluvial -lacustrine sediments cover the southeastern shores of Lake Abaya. These sediments are alternating silt, clay and diatomite layers with minor volcanoclastic sediments and tuffs (Ql). Holocene sediments are represented by a succession of alluvium,elluvium, and illuvium containing topsoil usually black cotton soil, fluvial, alluvial and elluvial silts,sand, and gravel, and some subordinate, reworked lacustrine clays and silts, as well as reddish clay(Qs). The recent sediments form alluvial and colluvial slopes, outwash sheets, seasonal swamps and marshes, and complexes of eroded residual landforms of low to moderate relief. The Qs are dominantly exposed in the Gelana graben where thick alluvial sediment overlies the volcanic sequence next to the geological unit of TV1. Qs covers 24.79% of the study area whereas TV1 covers 55.29% of the area. The main geologic structures characterizing the area (Fig.2) resulting from the MER system. The Gelana depression was separated by the N-S trending Amaro horst from the Gunjili graben in the west (EWWDSE, 2007;Asrat, 2016). The formation of the graben structure belongs to the Wonji fault belt. The Wonji fault belt is a Pleistocene - recent faulting system which trends NNE and consists of open fissures and normal faults, and is usually sinuous or curvilinear.

Fig. 2 Lithology & structures
As described by Molla et al. (2019), the rocks are representing numerous lithologic units that form alternating permeable and impermeable ranges with different ages. Different sets of faults and various degrees of weathering have resulted in present forms of differences in hydrogeological properties. Besides, the extensional rift tectonics strongly controls the movement and the occurrence of the deep groundwater system. Based on the distribution of hydrogeological properties of rocks and geological structures, the aquifers can be classified into porous and fractured rock aquifers.
2 Methods
2.1 Recharge estimation and groundwater potential zone mapping
The water balance component is simulated using a spatially distributed WetSpass model (Batelaan and De Smedt, 2001, 2007), and the GWPZ is mapped using GIS-MCDA. To map the GWPZ,five thematic layers such as lithology, geomorphology, lineament, drainage density, and recharge from the WetSpass output were employed. The methodological flow chart to map the groundwater potential is depicted in Fig. 3 (Saaty, 1987, 2008).Saaty’s parameter scaling method is based on logarithmic least squares that prioritize hierarchical structures since the statistical criteria are important in deciding the scaling method controversy. Logarithmic least squares are statistically optimal under a number of realistic and practical models.
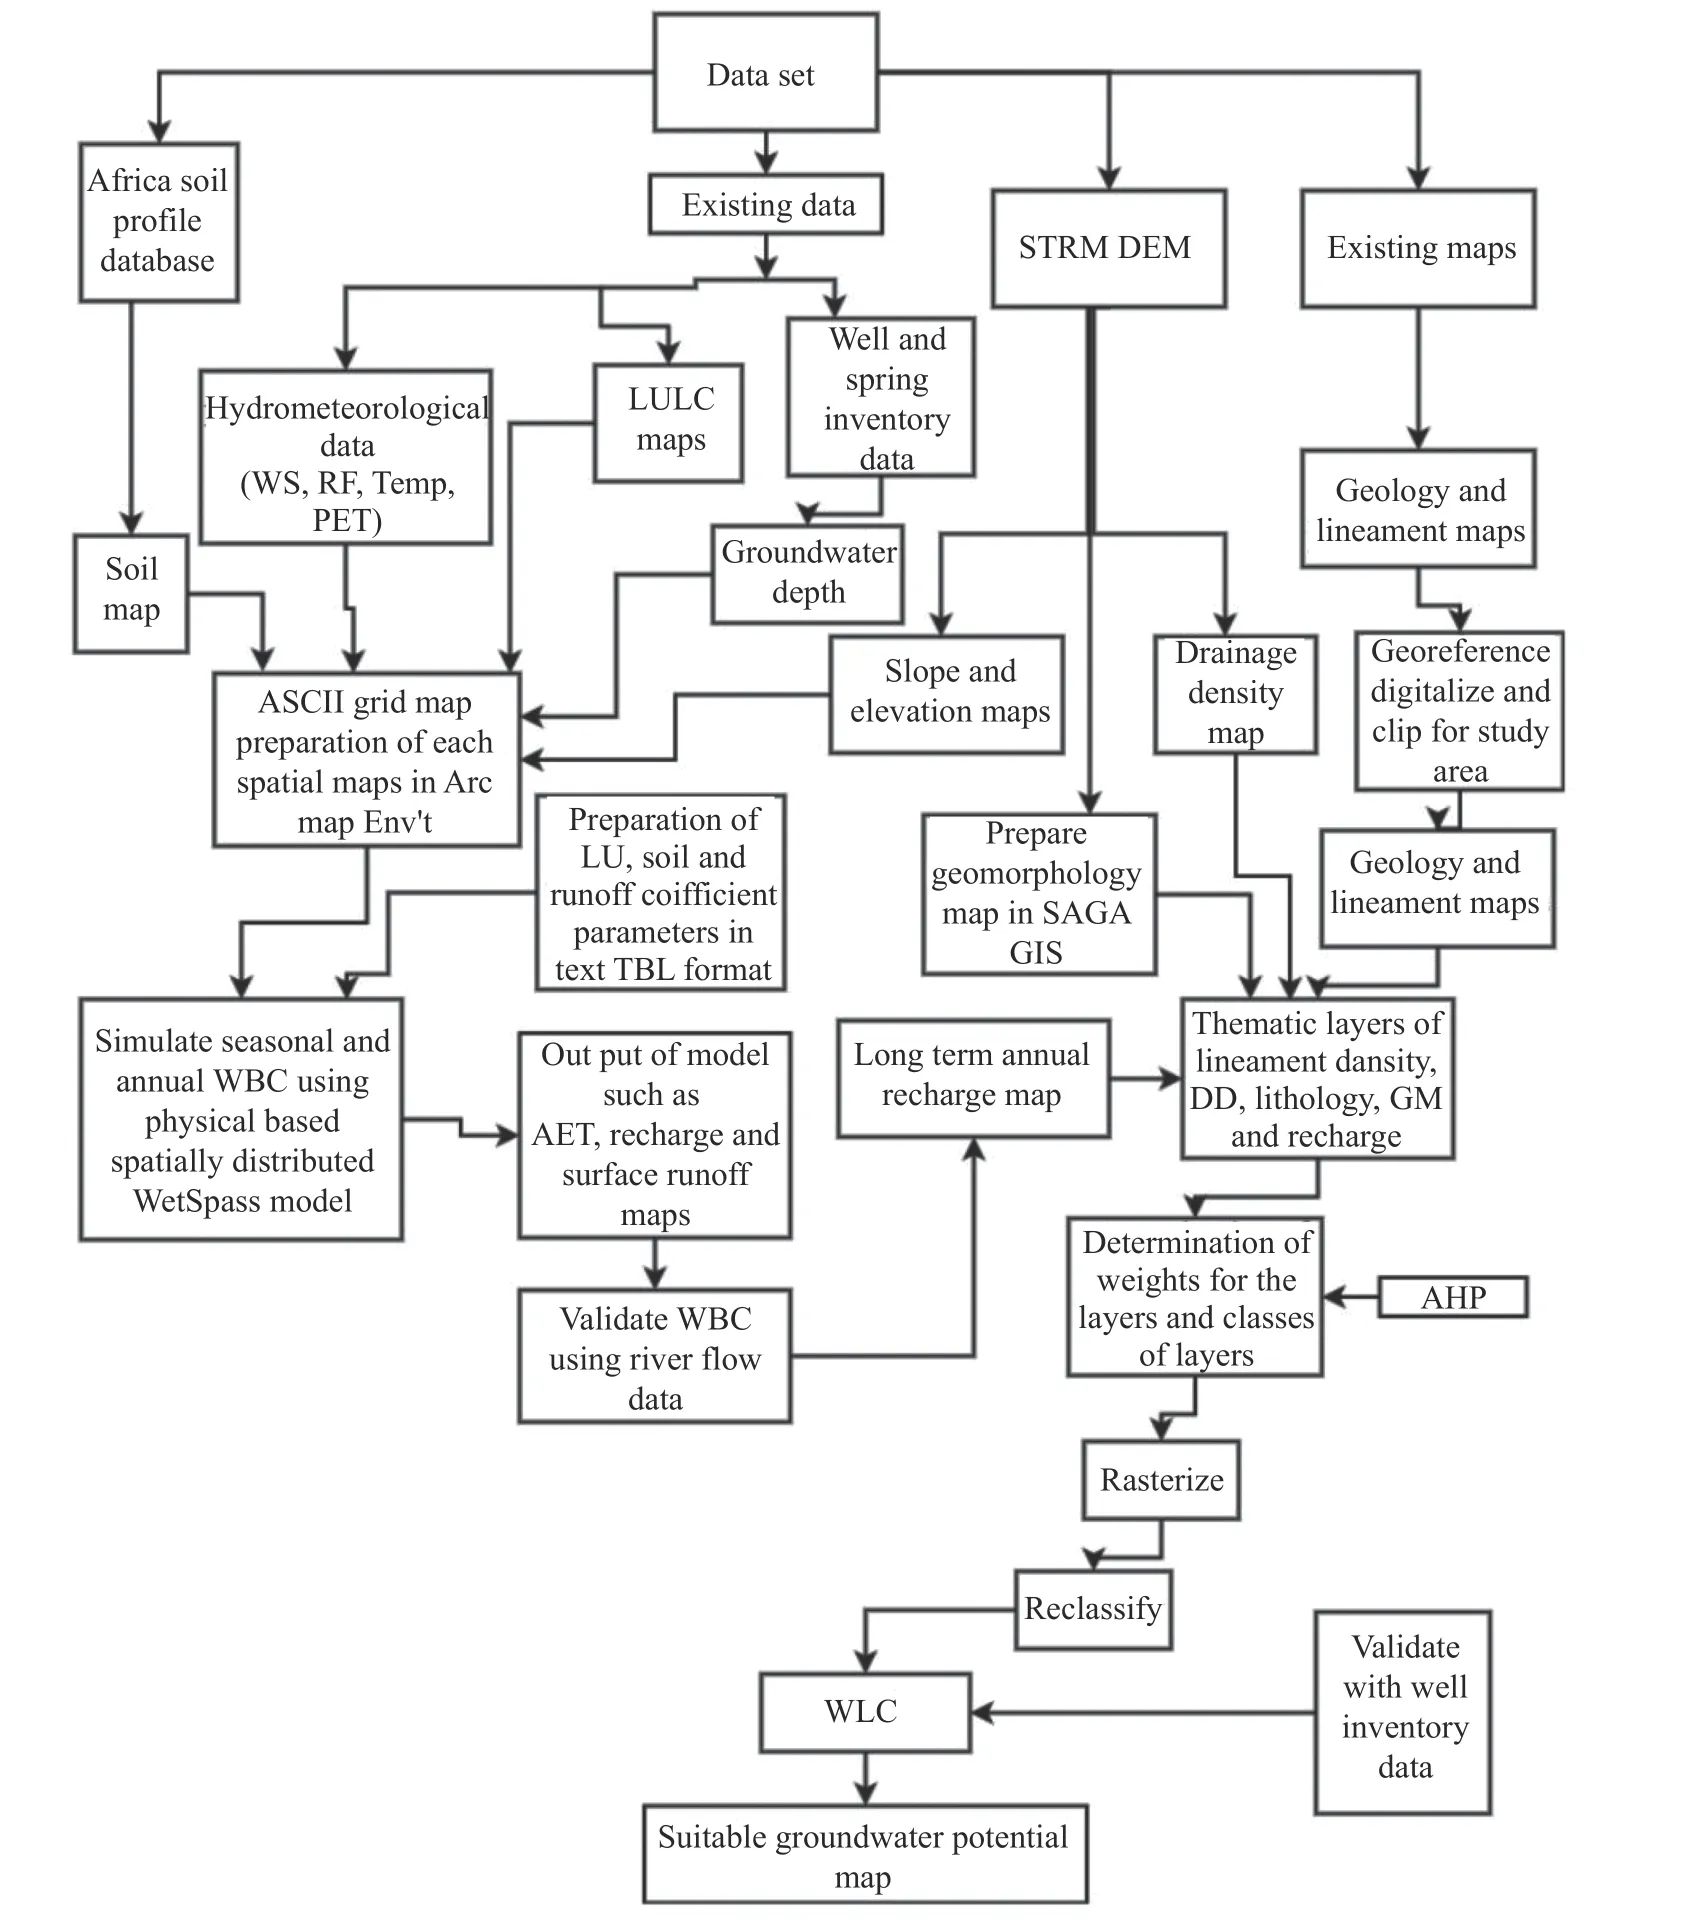
Fig. 3 Flow chart of the methodology
2.1.1 Recharge estimation
The water balance components of the basin depend on the average annual/seasonal precipitation (P),interception fraction (I), surface runoff (ROF),actual evapotranspiration (AET), and groundwater recharge (R), which is estimated from physical basin characteristic, groundwater depth and climatic variables (Equation 1).

2.1.2 Validation of WetSpass model
The WetSpass model simulation results were verified against river flow observations at gauging stations of Yirgachefe and Tore in the Gelana watershed. Model simulation results for mean total flows were compared to mean annual flows at the gauging stations, and the simulated groundwater recharge is compared against the estimated baseflow. Time Plot baseflow separation program approaches were used to separate baseflow (Smakhtin,2004). This method uses the Gabriel periodic filter algorithm (Equation 2) based on a recursive filter commonly used in signal analysis (Nathan and McMahon, 1990a; Lyne and Hollick, 1979).

Where:fk= filtered quick response at the kth sampling instant,yk= original streamflow, andα=filter parameter,yk-(yk-1) = filtered baseflow.
2.1.3 Multi-criteria decision-making analysis
In GWPZ mapping, the AHP method is used for both the class of the layers and thematic layers to identify their ranks and priority for the groundwater potential (Table 1 and Table 2). The ranking and weighting of the layers (Gintamo, 2015;Berhanu and Hatiye, 2020; Fanta et al. 2014;Andualem and Demeke, 2019; Yifru et al. 2020;Arnous et al. 2020; Zegu et al. 2020) are performed on the basis of expert experience and the acquaintance of the area. Once the assignment of weights is complete as given in Table 3, quantification of the criteria is conducted through pairwise comparison matrices within each hierarchal structure and then normalized. The λmaxvalues of the thematic layer and classes are computed from the largest eigenvalues to check the decision consistency of the pairwise comparison(Equation 3).

Table 1 Total weights of the thematic layers and normalized weights

Where:λmaxis the largest eigenvalues,TWiis the total weight andNWithe normalized weight of the thematic layers, and n is the number of thematic layers. Each matrix is checked for the consistency throughout the process by calculating the following consistency ratio from the consistency index(CI) and dividing it by the random index (RI)(Equation 4-5) (Saaty, 1980):


Where: n is the number of data considered andRIis the random index value (Saaty, 1980).
The weight map of the thematic layer feature classes is prepared using ArcGIS to compute the groundwater potential zones of the study area(Table 1). The normalized weights of the themes multiplied by the normalized weights of the class(Table 2) are applied to evaluate the groundwater potential index using the raster calculator inArcGIS 10.3 software (Equation 6) (Fanta et al.2014).
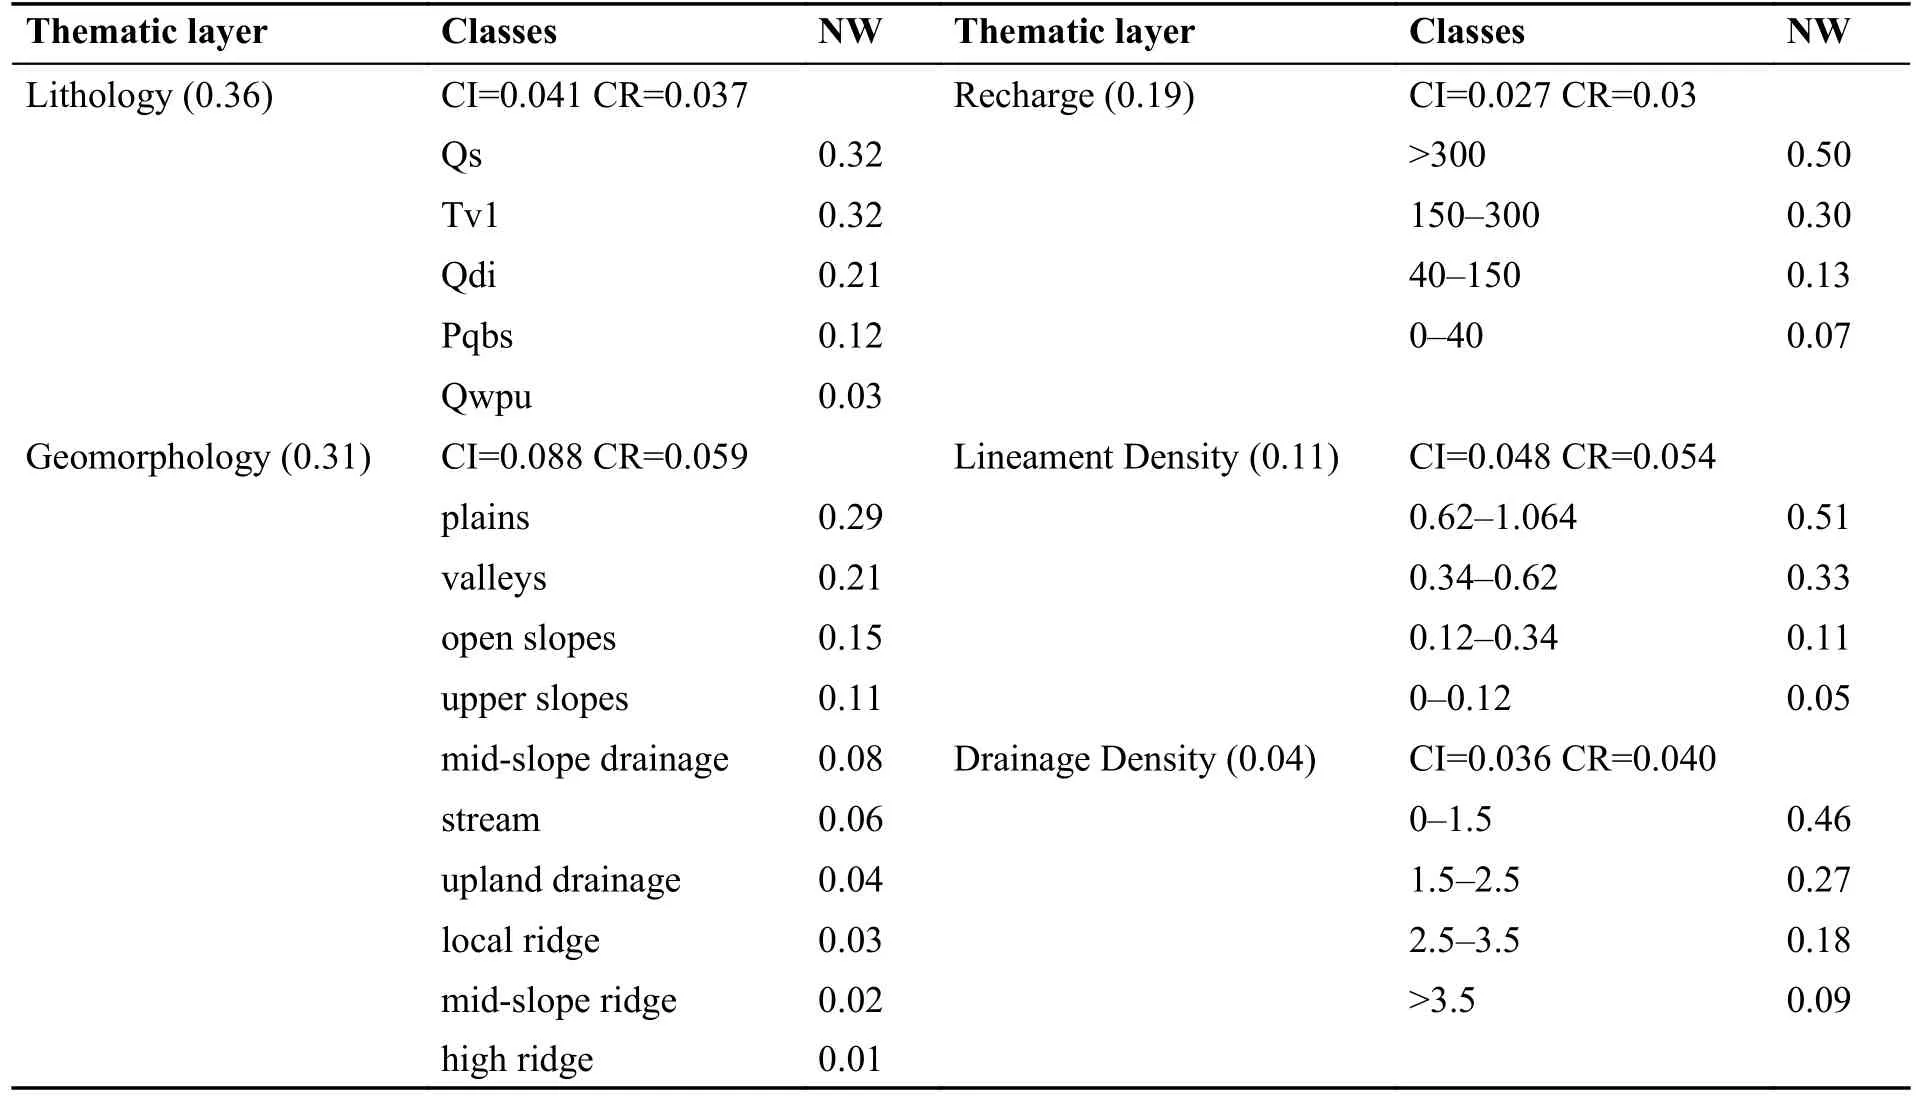
Table 2 Normalized weights (NW) of thematic layers and classes

Where:NWjis the normalized weight of thejthematic layer,NWiis the normalized weight of each class for theilayer, m is the total number of thematic layers and n is the total number of classes in each thematic layer.
2.2 Data source and processing
The WetSpass model needs temporal and spatial climate data including PET, rainfall, wind speed,temperature, geophysical data LULC, soil, groundwater depth, slope and topography elevation. Geomorphology and drainage density thematic map was processed from a 30 m resolution DEM collected from RVLBA in System for Automated Geoscientific Analyses (SAGA) and GIS environment.The lithological and lineament density maps were scanned, georeferenced, and digitized from existing collected data of ATA, 2016 in the GIS environment. All the maps were re-projected to Adindan/UTM zone 37N before being incorporated into the modeling and GWPZ mapping process.
2.2.1 WetSpass model input and setup process
Digital elevation model (DEM) of the study area with a cell size of 30 m is processed to prepare a topographic elevation map and slope percentage map (Fig. 1, Fig. 4a), respectively, using standard ArcGIS 10.3 tools, which shows that the elevation of the study area ranges from 1 179 m to 3 090 m and the slope percentage ranges from 0% to 51.8%with a mean of 8.2%. Spatially, the northeast part and the western highlands have the highest percent of slope. A land-use map of the basin was derived and prepared for model input from EGII (2013)raster data. Eight land-use classes were identified and the land-use map (Fig. 4b) of the watershed shows the following landuse composition: Mixed forest (43.09%), shrubland (19.68%), agriculture(19.42%), grassland (17.51%), build up (0.1%),marshland (0.09%), bare land (0.07%) and open water (0.04%). The soil textural map (Fig. 4c)shows four types of soil: Clay loam, sandy clay loam, sandy clay and clay, with the predominant soil as clay which covers about 64% of the watershed. About 29.4% of the area is clay loam observed in the western and eastern parts of the watershed. The other two soil categories are sandy clay loam (6.9%) and sandy clay (1.3%). Groundwater depth data was derived from the elevation of static water level measurements in boreholes and springs. Overall, 170 static water level measurements which were mostly concentrated in the valley area were used for interpolation to produce the groundwater level grid map (Fig. 4d).
Each station’s data was analyzed for the calculation of seasonal and annual meteorological values. It can be seen from Fig. 5 that the seasonal pattern of rainfall is strongly bimodal, with two distinct wet seasons controlled by the migration of Inter-Tropical Convergence Zone (ITCZ) from March to May (MAM) (locally known as Belg)and from September to November (SON) (locally known as Kiremt) (Molla et al. 2019). The dry season (locally known as Bega) runs from December to February (DJF) and from June to August (JJA) (Also locally known as Kiremt).

Fig. 4 Geospatial grid maps of (a) Slope (b) Land use (c) Soil (d) Groundwater Level
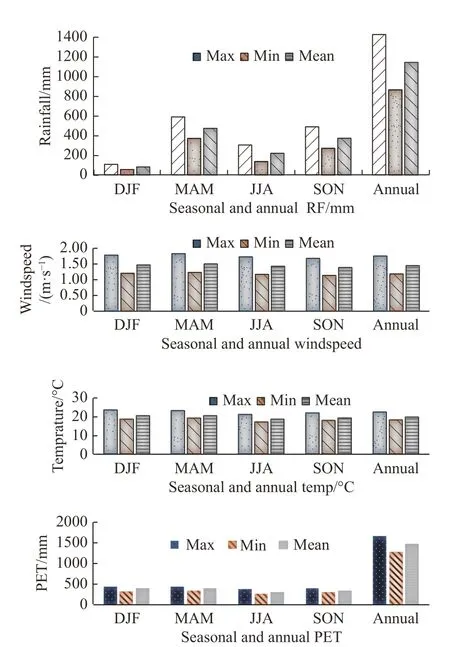
Fig. 5 Meteorological data
The parameters for land use, soil type, and runoff are specified in four lookup tables required to run the WetSpass model. The attribute tables involve parameters related to the land-use type and soil type. The former table contains parameters such as rooting depth, leaf area index and vegetation height (Batelaan and De Smedt, 2007) which were calibrated for temperate conditions (Al-Kuisi and El-Naqa, 2013). The application of this model(Kahsay et al. 2018) requires parameter modifications in the lookup tables for other regions with different climatic features (semi-arid and arid areas). In the Ethiopia, some parameters are necessary to be adjusted on the basis of leaf area index,root depth and land bareness, particularly in the Geba basin (Gebreyohannes et al. 2013). In addition, for the Abaya Chamo lake basin (Molla et al.2019), modifications of seasonal land use lookup table parameters, such as the decrease of the LAI,substantial decrease in the depth of root and a 20%increase of the land bareness were made. Based on the above modification and professional suggestions, modification of land use parameters is hence completed.
2.2.2 Generation of thematic maps
Geomorphology maps were derived from the digital elevation model using SAGA software, while drainage density and lineament density maps were derived from drainage and lineament maps, respectively. All the required thematic maps were developed from the collected datasets using ArcGIS 10.3.1 software (Fig. 6a-Fig. 6d).
3 Results and discussions
3.1 WetSpass model simulation
3.1.1 Calibration and validation
Fig. 7 and Fig. 8 show a hydrograph of the base flow of the river that was deduced from daily river flow time series using time plot baseflow separation techniques. The model was simulated for calibration and validation during the period from 1981 to 2006 and 1991 to 2013 with certain constraints.Model simulation results for mean total flows were compared to mean annual flows at the gauging stations, and also the simulated groundwater recharge is compared against estimated baseflow (Fig. 9 and Fig. 10). During the analysis period, the observed average annual total river flows lie between 4.25 m3/s and 4.72 m3/s for the existing gauging stations, while the estimated average annual baseflow is between 1.74 m3/s and 2.22 m3/s.
3.1.2 Simulated hydrological components
The results of the WetSpass model consisted of digital images of the spatial distribution of annual and seasonal long-term average values of actual evapotranspiration, surface runoff and groundwater recharge.
3.1.3 Actual Evapotranspiration
The WetSpass simulated mean annual evapotranspiration of the watershed was 823.48 mm constituting about 77.22% of the annual average precipitation of the area. This indicated that evapotranspiration was the main cause of water loss due to a rainfed area dominantly covered by mixed forest,whereas the seasonal values show significant temporal differences in the watershed.
During the wet season, 30.46% and 24.2% of evapotranspiration took place in MAM and in SON,respectively, while the remaining 6.26% and 16.30%took place during the dry season from December to February and June to August. The seasonal variation is caused by the uneven distribution of precipitation and changes in vegetation cover during the dry period. The annual evapotranspiration map(Fig. 11) showed a high annual rate at the northeastern part of the study area which is attributed to the relatively excess precipitation and dominant forest cover and the favorable combination of land usesoil type.
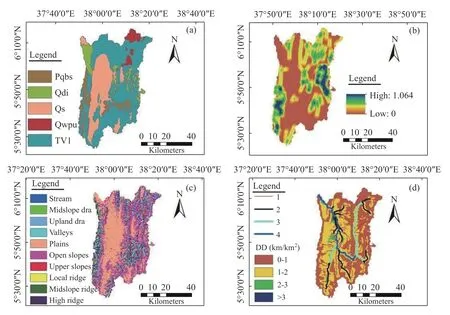
Fig. 6 Thematic maps (a) lithology (b) lineament density (c) geomorphology (d) drainage density
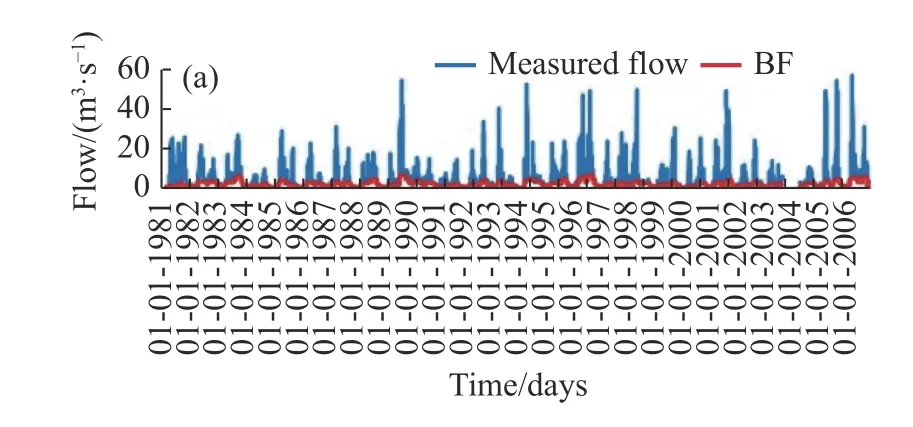
Fig. 7 Hydrograph of the base flow of a river at Yirgachefe
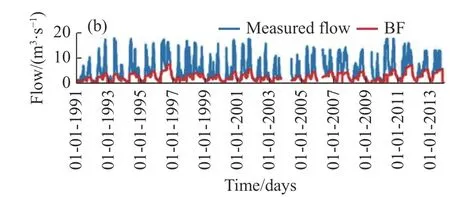
Fig. 8 Hydrograph of the base flow of a river at Tore
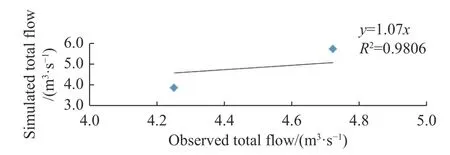
Fig. 9 Comparison of observed total annual average flow with simulated value (surface runoff + recharge)at 2 gauging stations

Fig. 10 Comparison of estimated baseflow with a simulated recharge at 2 gauging stations
3.1.4 Surface runoff
The mean temporal variation of surface runoff values are shown in Fig. 12. The annual surface runoff ranges from 0 mm/a to 549.7 mm/a with an average of 176.31 mm/a constituting about 16.54%of the annual average precipitation of the area.During the wet season (MAM and SON) about 7.46% and 5.76% of the surface runoff occur,respectively, while the remaining 0.92% and 2.39%occur during the dry season (December to February and June to August), respectively (Fig. 13).

Fig. 11 Spatial map of annual average evapotranspiration
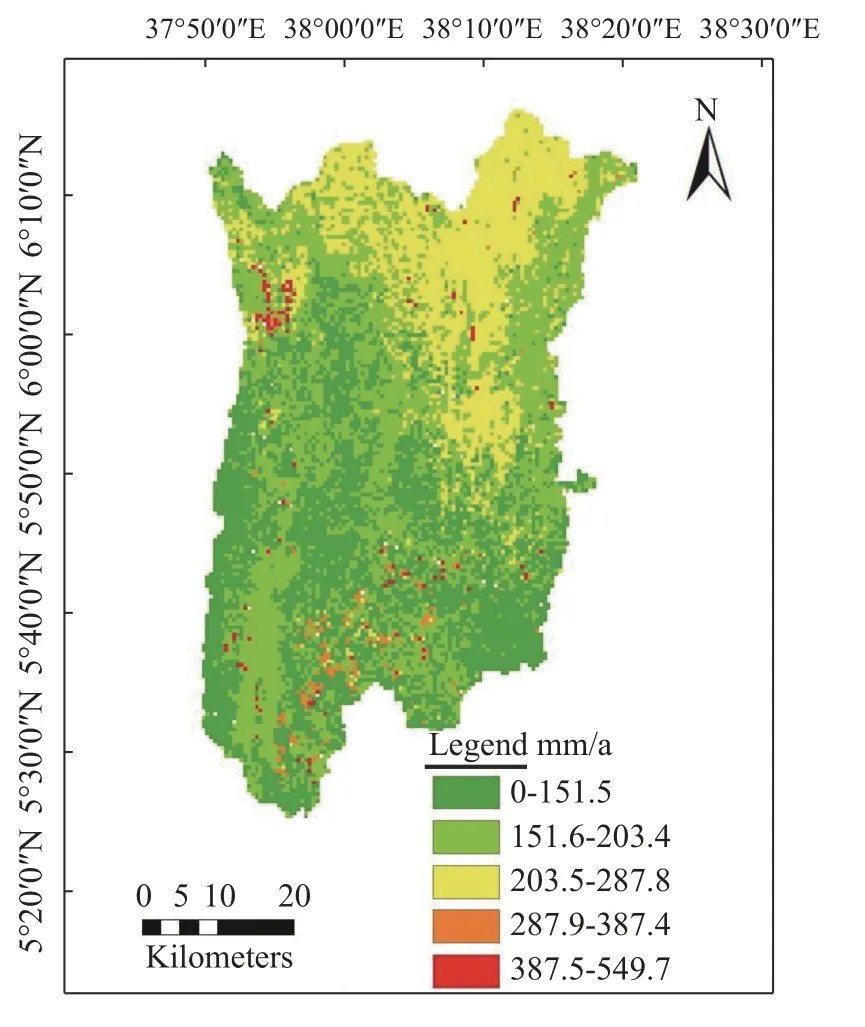
Fig. 12 Spatial map of annual average surface runoff
3.1.5 Groundwater recharge
The simulation results using a spatially distributed model indicate that the north-eastern highland of the watershed holds a higher groundwater recharge than those in the central watershed floor and the western part of the watershed. This is due to high precipitation, permeable soils, gentle topography and land use cover. The annual groundwater recharge in the Gelana watershed ranges from 0 mm/a to 366.55 mm/a with an average value of 66.56 mm/a (Fig. 14-Fig. 15). It constitutes about 6.24%of the annual average precipitation in the area. The seasonal variation indicates about 3.86% and 2.23% of the recharge occurs during the rainy seasons (March to May, and September to November respectively), while the remaining 0.15%occurs during the dry season (December to February and June to August).
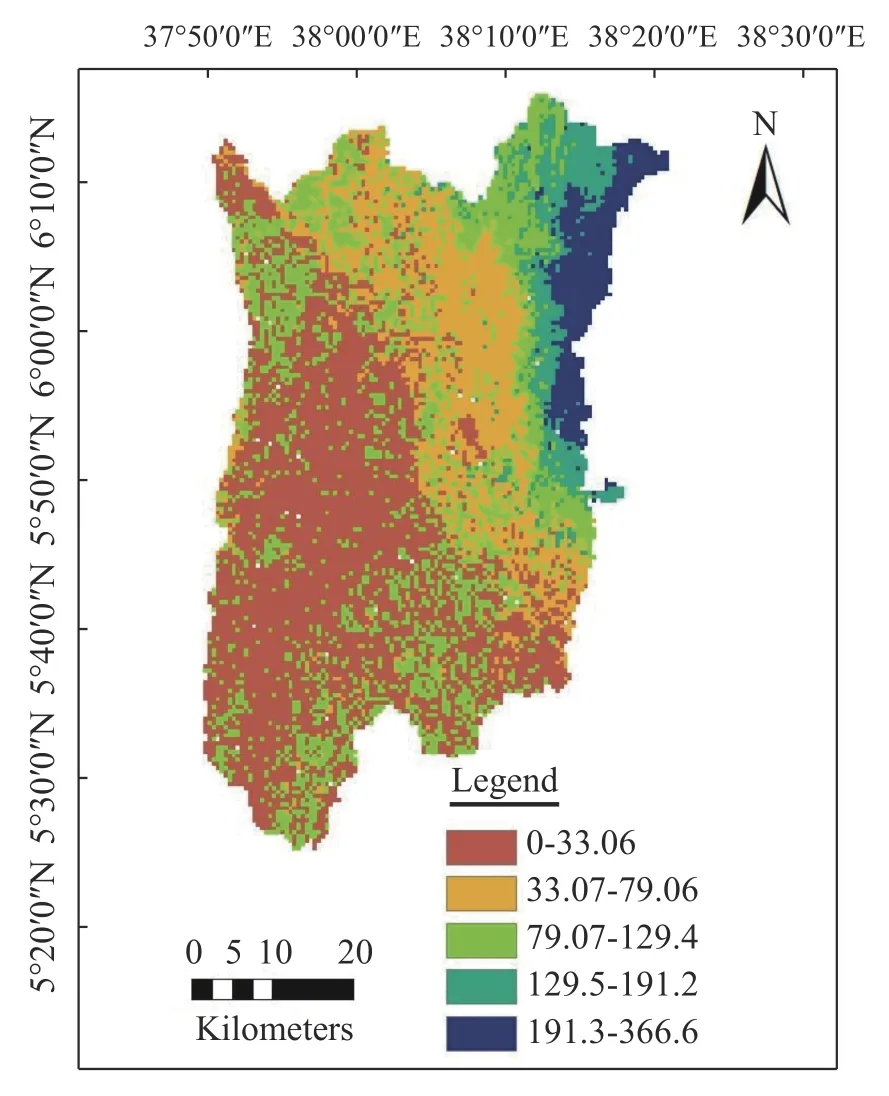
Fig. 13 Spatial map of annual average recharge
3.1.6 Water balance of Gelana watershed
The simulation of the WetSpass model is presented using a long-term average annual condition (Table 4). The water balance structure is dominated by evapotranspiration, which constitutes 77.22% of the precipitation and about 16.54% of the annual precipitation in the Gelana watershed that accounts for the surface runoff value and the remaining 6.24% as groundwater recharge.

Table 3 Annual water balance of Gelana watershed (mm/a)
3.2 Thematic layer preparation
3.2.1 Lithology
The major aquifers in the rift system are fractured interlayered basalts and ignimbrites. As depicted in Fig. 14a, the watershed is characterized by five major lithological groups and summarized as follows:
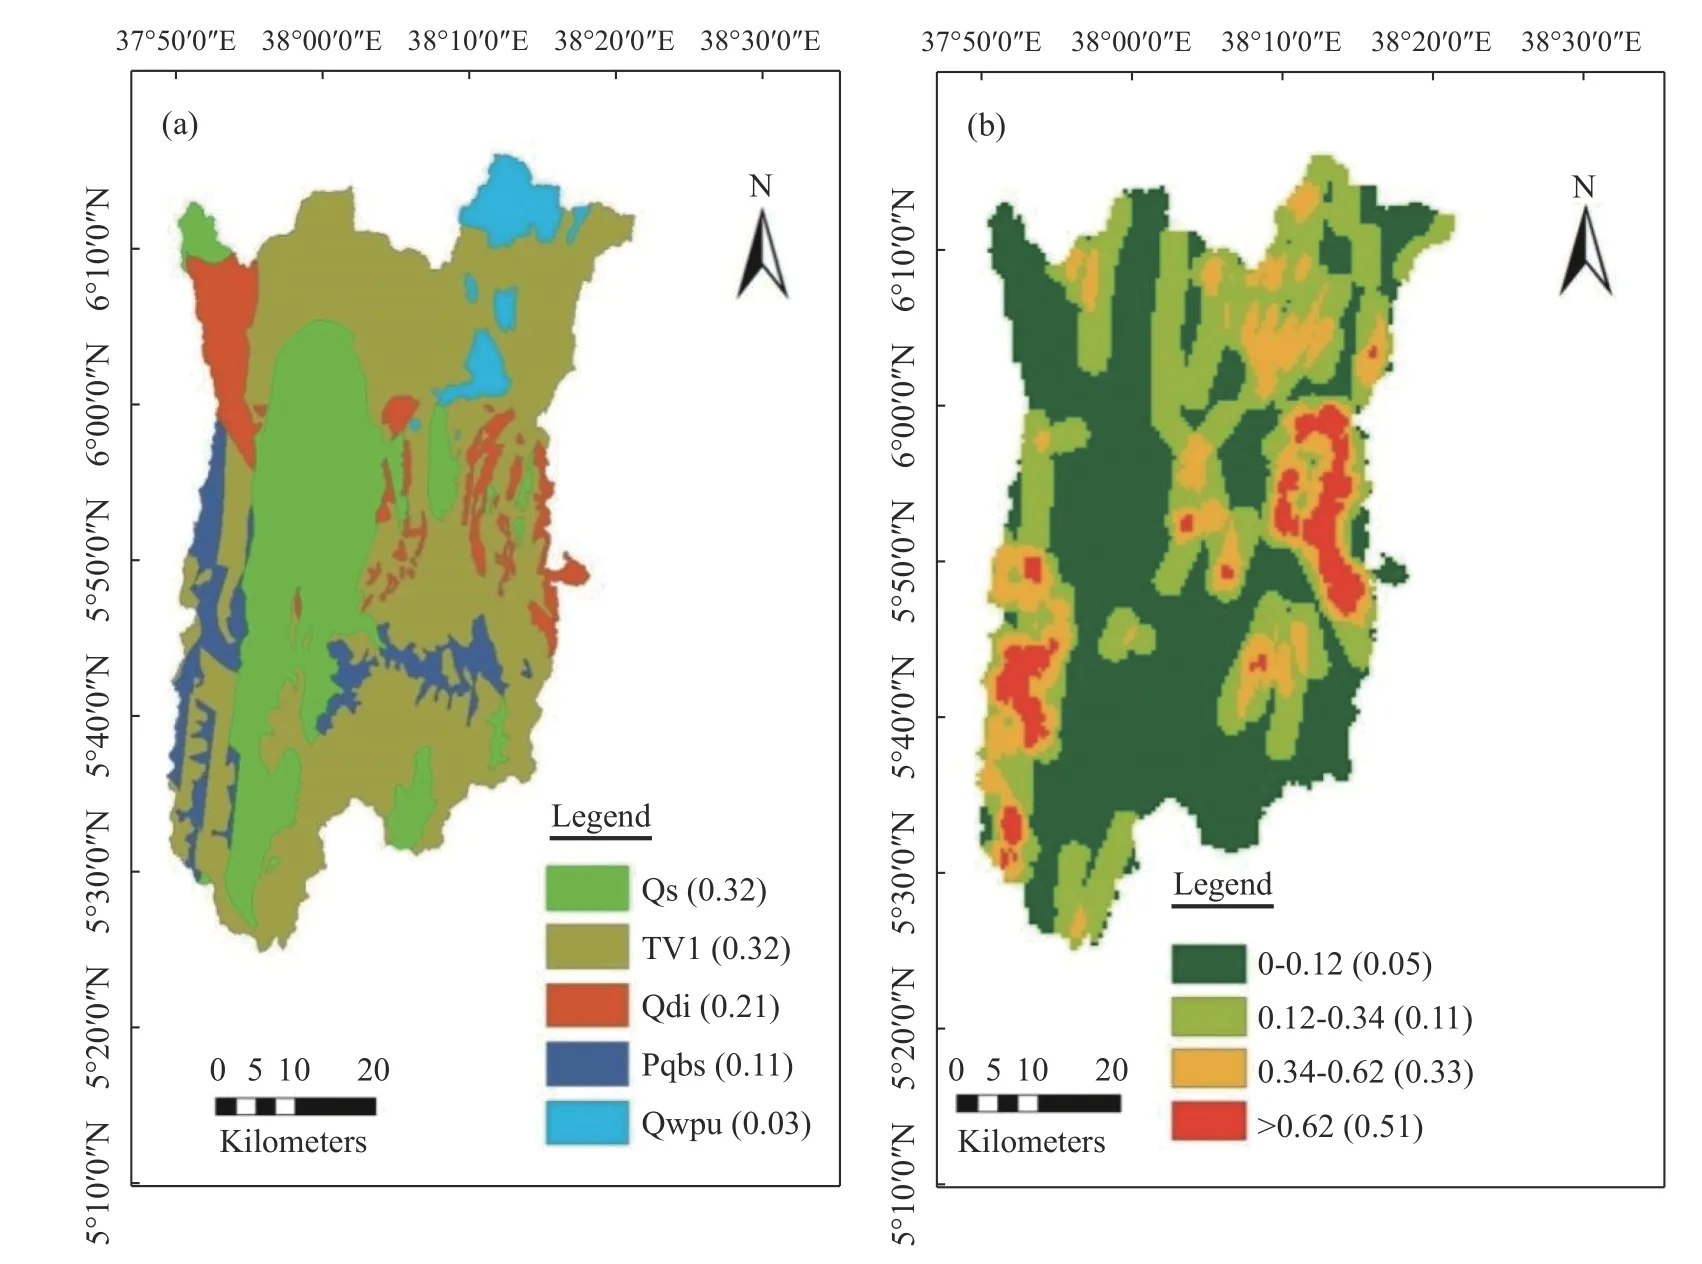
Fig. 14 a) Lithological unit map b) Lineament density map
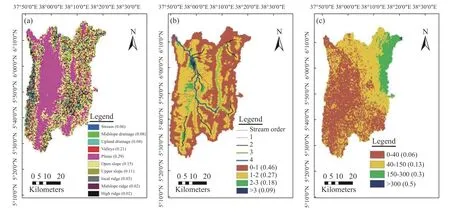
Fig. 15 a) Geomorphological map b) Drainage density map c) Recharge map
1. Qs = Quaternary alluvial, delluvial and elluvial sediment, polygenetic infill depressions, and volcano-sedimentary rocks, silts, sands, gravel;
2. Qdi = Ignimbrites, tuffs, pyroclastic, occasional lacustrine beds;
3. TV1 = Transitional mildly alkaline and sub alkaline basalts and rhyolites undifferentiated;
4. Qwpu = Pumice and unwelded tuffs;
5. Pqbs = Quartzo feldspathic schist, fels and gneiss (high and low-grade metamorphic rocks).
3.2.2 Lineament density
The primary geological structures developed in the area are considered to be fractured, resulting from the MER system (Fig. 14b). The structural features are associated with faulting systems. The formation of the graben structure belongs to the Wonji fault belt. The Wonji fault belt is a Pleistocene-Recent faulting trend NNE consisting of open fissures and normal faults usually sinuous or curvilinear. The episode of faulting created horsts and graben within broad fault zones. Quaternary basaltic volcanism is concentrated mainly along this axial zone of the rift and is controlled by extensional structures, with chains of scoria cones and phreatic/phreatomagmatic explosions craters, developed along normal faults and fractures. Both orientations of faulting of North-South and NNE-SSW are observed in the area which can serve as conduits for groundwater recharge and thus contribute to the occurrence of groundwater (EWWDSE, 2007).
3.2.3 Geomorphology
Accordingly, the area is classified into plain, valley, open slope, upper slope, mid-slope drainage,stream, upland drainage, local ridge, mid-slope ridge and high ridge (Fig. 15a). The graben is dominated by plain and valley landforms and the Holocene sediments (Qs) dominantly expose in the graben where thick alluvial sediment overlies the volcanic rocks. In the area, the landforms in the western, northeastern and eastern parts include all classes that indicate a rugged and rough topography where lower basalt (TV1) is the dominant underlying unit.
3.2.4 Drainage density
In the present study, the hydrological parameters such as flow direction, flow accumulation, stream raster, and stream order were extracted from spatial analyst tools of the ArcGIS environment to prepare the layers for drainage density. The drainage density of the study area ranges from 0 km/km2to 3.89 km/km2(Fig. 15b).
3.2.5 Groundwater recharge
The annual groundwater recharge map obtained from the WetSpass model was reclassified into four and normalized weight is given as shown in Fig. 15c as per the suitability of groundwater potential.
3.3 Groundwater potential zones and validation
The groundwater potential zone map was classified as high (GWPI=22.07-33.66), moderate (GWPI=16.33-22.07) and low (GWPI=6.55-16.33). The resulting groundwater potential map of the study area (Fig. 16a) indicates that the high groundwater potential zone is situated mostly in the central part of Gelana watershed in the plain area of Gelana graven (kebele such as Shamole Shida, Shamole Oda, Bore, etc.). This high groundwater potential zone corresponds to alluvial plains, high waterbearing alluvio-lacustrine sediments with a gentle slope. Some eastern parts of the study area are also situated in a high groundwater potential zone due to high lineament density, high diffuse recharge amount, gentle to moderately steep landform with tertiary volcanic lower basalt (thick basalt regolith), and alluvio-lacustrine sediments formation.The high groundwater potential zone covers a relatively higher area of 1 580.69 km2(45.88% of the total area of the Gelana watershed).

Fig. 16 a) Groundwater potential zone map b) GWPZ map and Well yield data
The groundwater potential zone designated as moderate is mostly found in the central axis from the southeast towards the northern part of the Gelana watershed. The moderate groundwater potential zone distributes along the areas where there is tertiary volcanic lower basalt (thick basalt regolith) with gentle to moderate rolling topographic features and reasonable diffuse recharge that enhance the productivity of thick basalt regolith. A few part of the moderate groundwater potential zones are also scattered along the western direction where very high lineament density with tertiary volcanic lower basalt (thick basalt regolith)is situated, together with moderate diffuse recharge accompanied with mixed porous and fissured aquifers. Those aquifers consist of ignimbrites,tuffs, pyroclastics and occasional lacustrine beds.The moderate groundwater potential zone covers an area of 1 356.8 km2(39.38% of the total area of the Gelana watershed). Low groundwater potential areas are found along the western part and scattered on the central to southeastern area exhibiting high distribution of mountainous geomorphology and relatively less water-bearing lithological formations (Quartzo feldspathic schist, feldspar and gneiss). On the other hand, this groundwater potential zone is found on some portion of northeast situated on pumice and unwedded tuff formation.The low groundwater potential zone covers nearly 507.51 km2or 14.73% of the study area.
The groundwater potential map of the study area is validated with the existing groundwater borehole and spring yields. Plotting the inventory data over the groundwater potential map was also conducted(Fig. 16b). A total of 150 groundwater inventory points have the recorded yield data. The highest yield among the collected groundwater data was 32 L/s with a 151 m well at Chelelektu town. The least yield was observed from the springs having a yield of 0.01 L/s. The discharge in high groundwater potential zone ranges from 0.09 L/s to 32 L/s with an average value of 7.15 L/s, whereas in moderate and low groundwater potential zones it ranges from 0.07 L/s to 17 L/s and from 0.01L/s to 6.5 L/s with an average value of 2.3 L/s and 0.66 L/s, respectively. There is no general consensus for the classification scheme of well yields but can be grouped into some classification schemes considering site-specific conditions. GSE(2014) on Dilla hydrogeological map sheet and EATA (2016) on south Ethiopia hydrogeological map classified the aquifer yields as 0.051-0.5 L/s for low productive aquifers and 0.51-5 L/s for high productive aquifers. Yifru et al. (2020) studied groundwater potential mapping in RVLB,Katar watershed (Eastern Lake Ziway) and classified the GWPZ into three sections based on the well and spring productivity rates ranging from 2.6 m3/d to 100 m3/d, 100 m3/d to 600 m3/d, and 600 m3/d to 1 036 m3/d as low, moderate, and high GWPZs, respectively. Since the Gelana watershed falls in the RVLB and Dilla map sheets, the classification of GSE (2014), EATA (2016) and Yifruet al. (2020) was adopted with some modifications. Areas where well/spring yield was less than 1 L/s were categorized as low, while well/springyield between 1 and 5L/s as moderate and more than 5 L/s were classified as high groundwater potential regions. Based on this classification, out of the 18 schemes having yields over 5 L/s, 14 boreholes (77.78%) have higher yield values (range between 6.7 L/s and 32 L/s) fall in the high GWPZ. Out of the 45 schemes (1-5 L/s) yield data, 28 (62.22%) of them fall in the moderate GWPZ, whereas out of the 87 low yields (<1 L/s)schemes data, and 64 (73.56%) are classified as low (Fig. 16).
The cross-validation analysis revealed that 70.67% of the groundwater inventory data (boreholes, shallow wells, hand-dug wells and springs)agree to the corresponding groundwater potential zone classifications from qualitative analysis(Table 4). This confirms that there is a good agree). This confirms that there is a good agreement between the groundwater inventory data and groundwater potential zones delineated by using GIS-based MCDA and spatially distributed model approach techniques.

Table 4 The qualitative agreement between the groundwater inventory points and the identified GWPZ
4 Conclusions
The focus of this study is to explore the variations prevalent in hydro-geophysical features in the identification and estimation of groundwater potential,using GIS-based MCDA and WetSpass model in a data-scarce region of the Main Ethiopian Rift valley.The estimated recharge shows a pronounced spatiotemporal variation. The average annual groundwater recharge in the Gelana watershed ranges at 66.56 mm per year. With respect to seasonal variation, about 3.86% and 2.23% of the recharge occurs during the bimodal rainy seasons, while only 0.15%occurs in dry season. The long-term average recharge rate in the area is 6.24% of annual precipitation. Factors that affect groundwater potential include lithology, lineament density, geomorphology,drainage density and groundwater recharge. Among them, the lithology, geomorphology and groundwater recharge are the dominant factors which influence on the determination of factor weight of thematic layers during the groundwater potential assessment. Most of the high potential areas are represented by alluvial plains, high water-bearing alluvio-lacustrine sediments with low slope Moreover, and some the high potential areas are also represented by high lineament density, high recharge rate, gentle to moderate steep landforms with tertiary volcanic rock (thick basalt regolith) and alluvio-lacustrine sediments. On the contrary, the zones with low groundwater potential lie in areas with mountainous geomorphology and are relatively less water-bearing soil and rock formations.Ranking and weighting of the thematic layer analyses indicate that all parameters significantly affect the GWPZ but lithology and geomorphology appear to be the most dominant factors. Diffuse recharge, lineament density, and drainage density moderately influence on groundwater potential zoning. About 45.88%, 39.38% and 14.73% of the watershed are identified as high, moderate and low ground potential zones, respectively. The identified GWPZ assessment results are further cross validated with existing pumping well and spring data available in the study area.
Acknowledgements
The authors acknowledge the Ministry of Water,Irrigation and Energy of Ethiopia, Ethiopia Agri-cultural Transformation Agency, Geological survey of Ethiopia and National Meteorological Agency of Ethiopia for their cooperation in providing relevant data.
杂志排行
地下水科学与工程(英文版)的其它文章
- Numerical simulation of operation performance on production and injection of a double well geothermal system in Kailu Basin, Inner Mongolia
- Spatial confirmation of termite mounds as Bio-geo indicator for groundwater occurrences using ground magnetic survey: A case study from Perambalur Region of Tamil Nadu, India
- Research on the characteristics and influencing factors of terrestrial heat flow in Guizhou Province
- Comparative analysis of bacterial contamination in tap and groundwater: A case study on water quality of Quetta City, an arid zone in Pakistan
- Genetic model and exploration target area of geothermal resources in Hongtang Area, Xiamen, China
- Assessment of water level threshold for groundwater restoration and overexploitation remediation the Beijing-Tianjin-Hebei Plain
