Spatial confirmation of termite mounds as Bio-geo indicator for groundwater occurrences using ground magnetic survey: A case study from Perambalur Region of Tamil Nadu, India
2022-06-27MuthamilselvanPreethi
A Muthamilselvan, B Preethi
1 Department of Remote Sensing, Bharathidasan University, Trichy-23, Tamil Nadu, India.
Abstract: Termite mounds are conventionally surmised as one of the best bio-geological indicator for groundwater occurrence in places where they inhibit. Ground magnetic survey was carried out to prove the assumption about termite mounds as an important indicator for groundwater exploration. Occurrences of 18 Termite mounds were mapped using handheld GPS to identify the suitable trend for magnetic survey. After considering all the criteria such as power lines, fences and fracture system, termite mound 2, 12 and 18 were selected in the NNE-SSW trend, and the ground magnetic survey was conducted in ESE-WNW direction which is perpendicular to the trend of the termite mounds using Proton Precession Magnetometer.Totally, 99 samples were collected with 5 m sampling interval and 50 m profile interval over an area of 22 500 sq.m. The magnetic values varied from -7 363 nT to 898 nT with the mean of -331 nT. Processed map of reduction to Equator indicates the presence of NNE-SSW and WNW-ESE magnetic breaks.Analytical signal map designated the presence of magnetic low in the WNW-ESE direction which coincides spatially with the magnetic breaks. The magnetic profile lines have also brought to light the structurally weak zones. Causative body depth range was estimated using power spectrum and Euler method which are from 120 m to 40 m and <20 m to >100 m, respectively. The present study appreciably brings out the spatial relationship between the termite mounds and the hydro-fractures. This confirms the assertion with regard to termite mounds as an effective tool for groundwater exploration.
Keywords: Termite mound; Bio-geological indicator; Groundwater exploration; Magnetic survey Received: 02 Nov 2021/ Accepted: 05 Apr 2022
Introduction
Geo-botanical or biological indicators are considered as one of most valuable tools for groundwater exploration (Liu et al. 2021). Termites are regarded as one of the excellent bio-geological indicators for groundwater exploration. Termites are amongst the most sensitive and important soil organism in tropical regions. They build their mounds by collecting soil from the surrounding as well as from the sub-surface. Groundwater potential zones could be indicated by the occurrence of striking soil mounds constructed by termites, also referred to as “ecosystem engineers” or “soil engineers” (Dangerfield et al. 1998; Bottinelli et al.2016a; Jouquet et al. 2016a). Many species of termite build their nests inside mounds because a mound has direct and positive feedback effects on the temite colonies through the maintenance of humidity and protection of the population (Abe et al. 2009). The concentration of termite activities in particular area increases the heterogeneity of environment, and the nest area provide fertile land for plant and tree growth (Jouquet et al. 2005;Bonachela et al. 2015), reflecting improvement in soil characteristics including water content. The hydrogeologist whose concern is to locate groundwater with appreciable quantity and quality should also be featured in this interest listed. It has been observed in various parts of Africa that termite mound locations are traditionally used to exploit for locating groundwater sources mainly in the form of hand-dug wells with high success rates(Adagunodo et al. 1992; Ahmed et al. 2019;Endubu et al. 1992; Jamilu and Biswajeet, 2019).However, the scientific rationale behind the use of mounds as prospective sites for locating groundwater structures has not been thoroughly investigated. For example, in the North-Central part of Nigeria, largely covered by basement complex rocks of Eburnean-Pan African age, some villagers rely on epigeal termite mounds for locating groundwater sources. A similar observation has been made in Cameroon (Van Ranst) and Ghana (Dowuona et al. 2012). Termite mount also used to study the defluoridation of groundwater (Fufa et al. 2013).Termite provides a first step towards understanding the potential effects of termite nest soils on C and N cycles in the context of global change(Hu et al. 2017).
Traditionally termite mounds are presumed to be good indicators of groundwater in the places they inhibit. Even in the texts of ancient Indian astrologer Varahamihira (AD 505-587) pointed out the importance of termite mounds as a bio-indicator for groundwater occurrence. Groundwater exploration is a unique exercise (Zhang et al. 2020; Liu et al. 2021). As it is a hidden resource, various indirect methods are used for groundwater identification such as geophysical methods. Water movement in two termite mounds has been investigated by injecting equal quantities of a radioactive tracer,chromium-51 complexed with versenate, and to their adjacent soils. In both cases the radioisotope within the termite mounds spread both upwards and downwards during the wet season whilst in soils adjacent to the termite mounds the radioactive tracer moved predominantly downward. The study concluded that termite mounds are subjected to less leaching than the surrounding soils (Watson,1969). The magnetic method is one of the widely used geophysical methods for groundwater potential analysis which enables detecting the magnetic fields of the earth which can be measured and mapped. Magnetometers are the equipment used to measure the magnetic fields and variations. Because magnetic contrasts are seldom associated with groundwater occurrence, the method has good relevance for exploring groundwater (Balasubramanian, 2007). Magnetic method is also used to delineate magnetic field intensity in an area underlain by different lithologies with varying magnetic mineral contents (Dransfield et al. 1994). Magnetic method also gives information about depth to the basement rocks (Umeanoh et al. 2018). Magnetic survey is also used to locate groundwater potential zone (Sultan et al. 2015; Muthamilselvan,2021), mineral exploration zone (Adagunodo et al.2015; Ahmed et al. 2019; Endubu et al. 1992) and spatial confirmation of existing fault/lineaments(Muthamilselvan, 2017). Analytical signal and reduction to pole interpretation technique were used to minimise the magnetisation direction and to convert from dipole to mono pole anomaly,respectively. It is easy to infer the dip direction from reduction map to pole one while it is easier to infer the source position from analytic signal maps.(Subasinghe et al. 2014; Nebere, 2015; MacLeod et al. 1993).
Depth estimation of causative body has been carried out, based on spectrum and Euler’s deconvolution methods. The thickness of sedimentary rock in parts of Anambra basin which falls in the lower Benue trough was evaluated by Onwuemesi(1997) who stated that depth ranged from 0.9 m to 5.6 m. Spectral depth analysis was performed by Igwesi Iand Umego (2013) to determine the depth of causative magnetic sources in some parts of the lower Benue Trough. It was observed that deeper magnetic source ranged from 1.16 km to 6.13 km with an average of 3.03 km, while shallower magnetic source ranged from 0.016 km to 0.37 km with an average of 0.22 km in the region. Geophysical techniques were not only used for the direct detection of groundwater occurrences but also helped to estimate the aquifer parameters,groundwater quality and movement, saline water intrusions and buried valleys (UNESCO, 1998).
Present study is conducted to confirm the assertion that termite mounds will be an important indicator for the groundwater exploration and can also be used for locating various sites for installing groundwater wells in the agricultural area. For the confirmation purpose, the magnetic method was used as a tool to investigate groundwater over the termite mound locations and along the trend of the termite mounds. The area lies in the south part of Senjeri village, and western part of Perambalur District (11°13′43.6′′N and 78°49′30.4′′E) was chosen as the case study area. The study area covers over an area of about 0.5 sq km,which belongs to hard rock terrain composed of hornblende biotite gneiss of the Archaean age.However, the agricultural area falls in the study area is totally covered by granites/weathered granites, together with some outcrops of amphibolites.
1 Methods
The observed magnetic readings obtained from a magnetic survey reflect the earth’s total magnetic field including the earth’s main field, diurnal variations and crustal magnetization sources. The instrument used in this study to collect the field data is Proton Precession Magnetometer-600. Based on the principle of Earth’s Field Nuclear Magnetic Resonance (EFNMR), it measures very small variations of magnetic field in the Earth, allowing ferrous objects on land and at sea to be detected.The principle of the instrument is that a direct current flowing in a solenoid creates a strong magnetic field around a hydrogen-rich fluid (kerosene and water are popular fluid), causing some of the protons to align themselves with that field. The current is then interrupted, and as protons realign themselves with the ambient magnetic field, they process at a frequency that is directly proportional to the magnetic field. This produces a weak rotating magnetic field that is picked up by an inductor which is further amplified electronically, and fed to a digital frequency counter whose output is typically scaled and displayed directly as field strength or output as digital data.
Spatial relationship between termite mounds and the hydro-fractures has been confirmed in this study with the aid of Magnetometer near the Senjeri village. Total of 18 Termite mounds were mapped along with the High tension line passage route in the study area using Handheld GPS (Fig. 1). During the survey, it was found that the Termite mounds 2, 12 and 18 in the NNE-SSW direction is akin to the fractures observed in the open well sections and they also lack any kind of deviation from High Tension Power Lines (Fig. 1). Magnetic data were collected in a perpendicular direction to the trend of termite mounds over an area of 22 500 m2. Totally, 99 magnetic data were collected along nine profile lines with a sampling interval of 5 m and a profile interval of 50 m. The flow chat of methodology for present study is shown in Fig. 2.
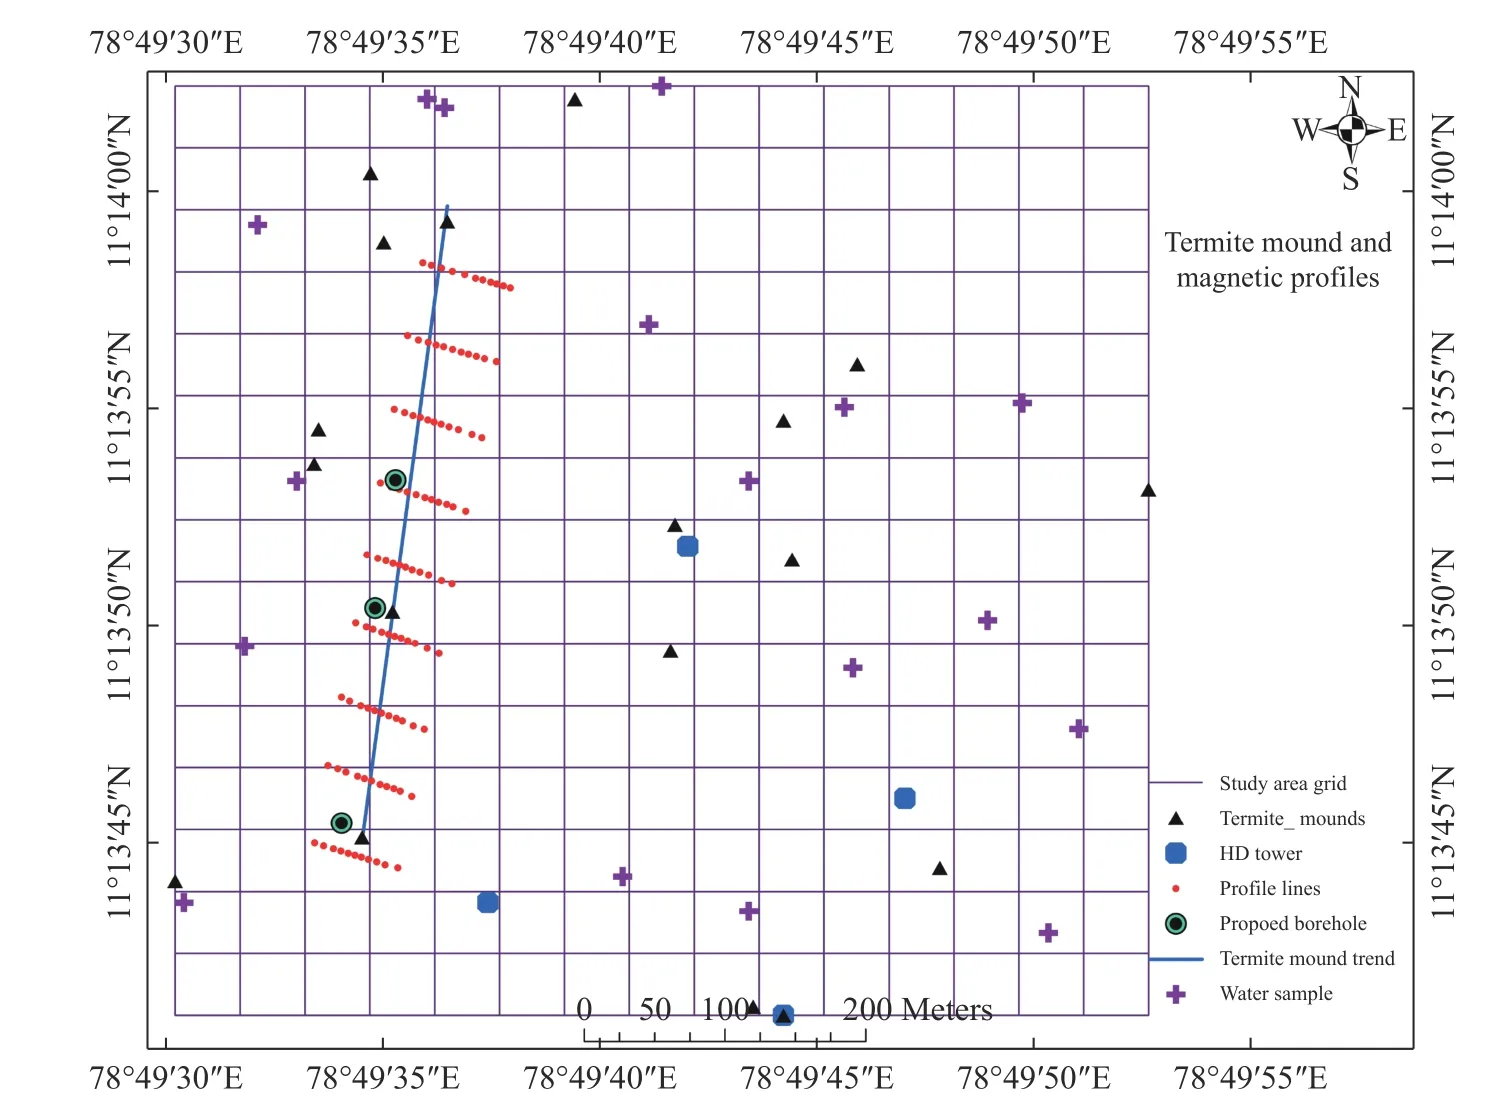
Fig. 1 Termite mound trend and magnetic survey profiles

Fig. 2 Methodology for the present study
Magnetic data requires few corrections for the observed magnetic data. Elevation corrections are not required as the vertical gradient of the earth’s magnetic field is less than 0.03 gammas/m. According to Sharma (1997), terrain effects are generally small and neglected unless the topography is caused by steep slopes consisting of a high magnetic susceptibility material greater than 0.01 SI. The most common processing technique is to remove the diurnal variations using the data collected at a base station. The base station data are plotted versus time. The first reading at the base station is regarded as the base value and any variations from this value at the base station for later times is subtracted or added to the field data. The other processing technique that may be applied is to remove the earth’s main magnetic field (DGRF). This is usually performed on the surveys covering many kilometres and is not performed for small-scale engineering and environmental surveys because the earth’s main magnetic changes 0-2 gammas/km in east west and 2-5 gammas/km in north-south directions. In the study area, diurnal changes were done by taking the readings once one hour at the base station and the correction was applied to the field magnetic values by subtracting the base station one.
After removing the diurnal variation from the field data, the magnetic data was contoured and then they were processed into total magnetic intensity map, reduction to equator, regional, residual,analytical signal and directional cosine filter maps.All these maps were produced on WGS84 ellipsoidal datum with geographic Lat/Lon projection.Interpretations were made from these maps to identify the subsurface structural elements traversing in the study area and is spatial correlation with the termite mounds. Finally, suitable sites for open and bore wells has been suggested.
2 Results
2.1 Total magnetic intensity map
Total magnetic intensity (TMI) data measures variations in the intensity of the Earth magnetic field caused by the contrasting content of rock-forming minerals in the Earth crust. Magnetic anomalies can be either positive where the magnetic field stronger than normal or negative when it’s magnetic field weaker. It is depending on the susceptibility of the rock. The total magnetic intensity map ranges from -7 363 nT to 898 nT in the Senjeri area indicates that the basement rocks covering the floor are diverse granite to amphibolites types and also reveals the presence of systems of faulting(NNE-SSW and E-W) which cause changes in the basement level (Fig. 3). Shifting of causative body is also noticed in the southern part of the surveyed area. Due to the presence of inclination and declination of the Earth’s ambient magnetic field, the subsurface geological structures produced indistinct magnetic field. This feature of the Earth makes it a complex task to estimate the correct size, shape and location of the causative bodies. To overcome this issue, a reduction to magnetic equator (RTE) filter was applied which is a modified version of reduction to pole (Grant and Dodds, 1972; Onwuemesi,2017). The reduction to equator has an amplitude component (sin(I) ) and a phase component ( i cos(I)cos(D-θ) ). When reducing to the equator, features normal to the declination direction can blow up due to the strong amplitude correction that is applied. A strong discontinuity occurs in the direction normal to the declination D. By specifying a higher latitude for the amplitude correction alone,this problem can be reduced. This is however at the expense of under-correcting the amplitudes of features along the declination direction.
During this process, the anomalies are shifted horizontally because of the effect of magnetic inclination. It also retains geological strike and dip information while removing the effect of magnetisation direction. In the RTE map, there is a significant shift in the causative bodies in southern and northern region and also change in the anomaly pattern from circular to elongation in the central region (Fig. 3). Magnetic low noticed in the elongated nature indicates the presence of hydro fractures which emphasizes the subsurface structural feature trending in WNW-ESE direction of study area.
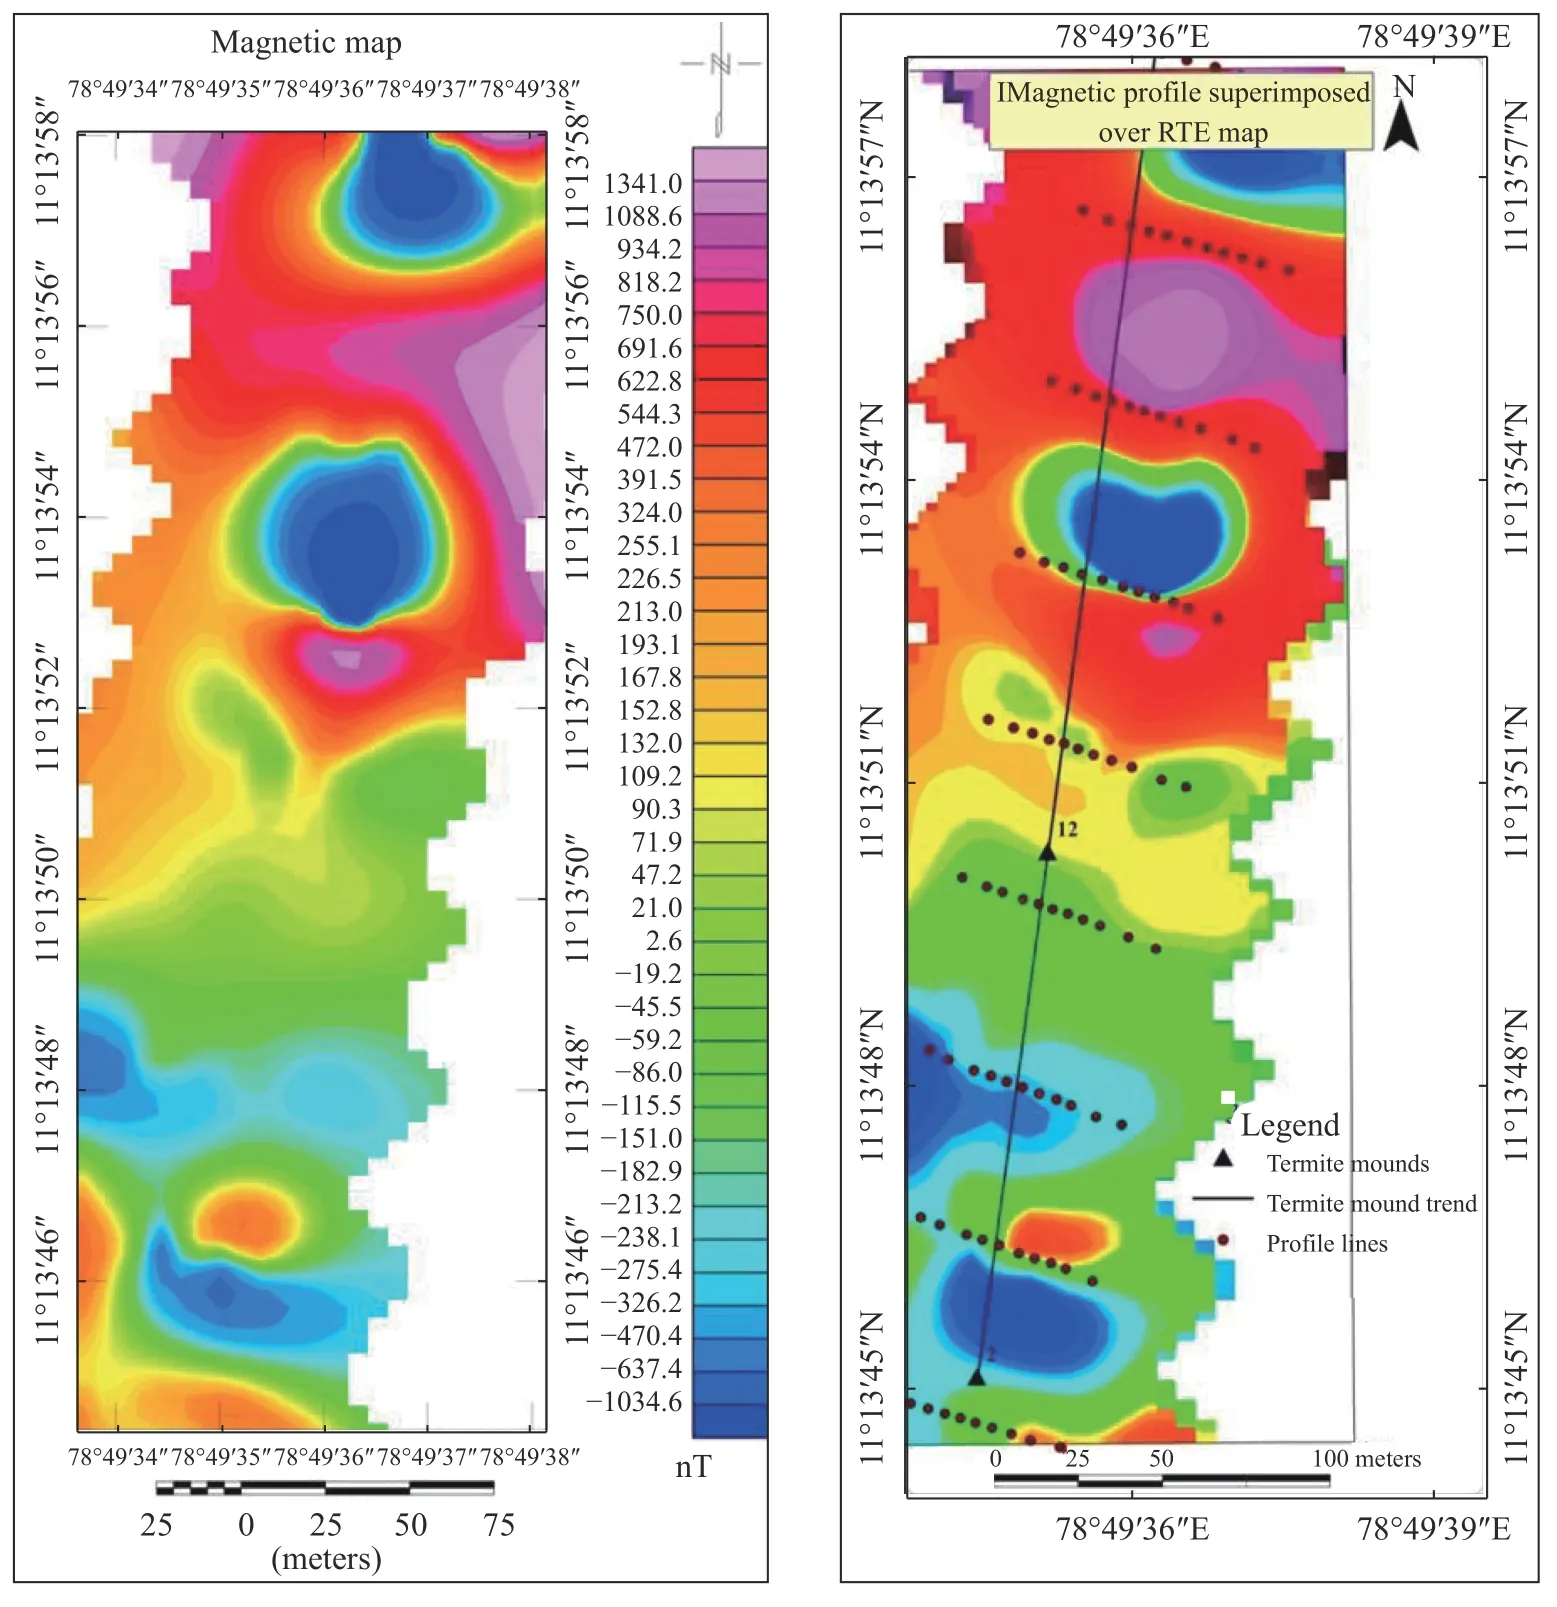
Fig. 3 Total magnetic intensity and RTE map with profiles
2.2 Analytical signal map
The analytic signal map can be prepared without any knowledge about ambient magnetic field or any assumption about the magnetisation of individual anomaly. The RTP/RTE transform requires prior knowledge about the geomagnetic inclination, declination and amplitude correction inclination (20° generally) of the study area. The resultant magnetisation direction can vary over a surveyed region because of either a constant remnant direction or different remnant directions acquired during a complex geologic history (Subasinghe et al. 2014).The TMI and RTE preserves magnetisation, strike and dip information but this information is lost while preparing the analytic signal map. The analytic signal anomaly is symmetrical, making the identification of source boundary easy but removing all dip information (Rajagopalan, 2003; Muthamilselvan et al. 2020; Muthamilselvan et al. 2021).Therefore it is easy to infer the dip direction from the RTP maps while it is much easier to infer the source position from the analytic signal maps. The amplitude of the analytical signals can easily be derived from the three orthogonal gradients of the total magnetic field using the following expression, where A is the observed magnetic field.

Nabighian (1972) introduced the concept of the analytic signal for magnetic interpretation and showed that its amplitude yielded a bell-shaped function over each corner of a 2D body. Further, the analytical signal of total magnetic intensity (Macleod et al. 2000) is vertically independent of the magnetic inclination of magnetization. The analytic signal has significant advantage over the simple derivatives and this application was utilized to map the changes in basement structure, fabric and distribution. This map shows a similar trend observed in the total magnetic intensity map and indicates that the causative source occurs at shallow depth. Low magnetic anomaly in the trend of E-W direction indicates the presence of hydrofracture in that direction and the E-W direction(Fig. 4).
2.3 Directional cosine filter map
The directional cosine filter is used to remove or isolate signal in the specified azimuth direction.The rejection (or pass) notch can be narrowed or widened by setting the degree of the cosine function so that highly directional features can be isolated more narrowly using the given formula.

Where:αis the pass direction. It is a spectral domain grid filter which rejects or retains the components of the observed data oriented along the user specified azimuth. As compared to conventional directional filters, the directional cosine filter (DCF) creates a smooth curve in the roll of range to prevent shorter wave length . The DCF was applied to the reduction to equator map to enhance the structural elements trending in the NESW direction. An azimuth of 45° was used with a 2 degree cosine function for extracting linear features trending in the NE-SW direction. The linear low magnetic values were observed in the northern and north-eastern regions also in the SW corner of the image which provides information about the trend of fractures (Fig. 4). These zones are considered as favourable loci for groundwater exploration.
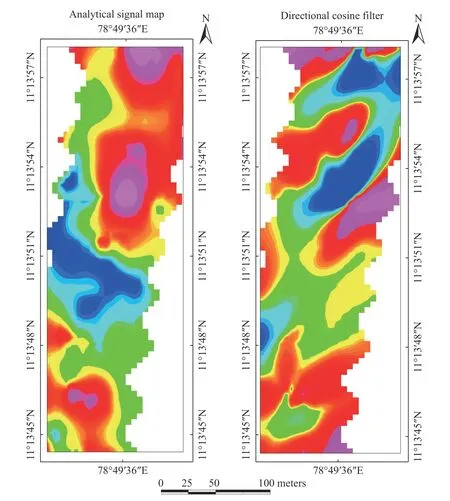
Fig. 4 Analytical signal and cosine directional filter
2.4 Regional and residual anomaly map
The TMI and RTE are the steps needed to determine the location of buried magnetic objects. However, to delineate the depth and geometry of these causative sources, one must perform a regional and residual anomaly separation. The regional and residual trends of the total intensity can be calculated using a number of techniques, including running averages, polynomials, low-pass, high pass filters,or upward and downward continuation techniques.All these techniques are described in detail in Telford et al. (1990), Hinze (1990) and Roberts et al. (1990). In this study, regional and residual anomaly maps were generated using Gaussian regional/residual filters under the Geosoft environment. It is used to delineate shallow and deep causative bodies located in the study area. Deep magnetized bodies cause magnetic anomalies with a long spatial wavelength and shallow magnetized bodies cause magnetic anomalies with a short spatial wavelength which is often called regional and residual trends respectively. A cutoff wavelength of 10 000 m-1was used to create the regional and residual anomaly maps. In the regional anomaly map the magnetic low regions are present in the southern and south western region of the map (Fig. 5), which indicates the depth of the structural elements trending in the NNE-SSW direction. The residual anomaly map shows the magnetic value distribution along the near surface region. In the study area, there is a trend of magnetic low regions observed in the NNE-SSW direction which coincides with the magnetic lows recorded in the RTE map. Shifting of residual bodies in the southern part significantly brings to light the subsurface structural elements trending in the NNE-SSW direction.
2.5 Radially averaged power spectrum
The radially averaged power spectrum (RAPS) is the direction-independent mean spectrum, i.e. the average of all possible directional power spectra.The radially averaged power spectrum provides a convenient means to view and compare the information contained in 1-D and 2-D spectra. This function computes and plots the RAPS of an input matrix. The power spectrum shows the anomalies occur at the depth of around 40 m (shallow source)for the residuals and around 120 m (deep sources)for the regional values, as shown in Fig. 6 , where the profile shows only three slopes from which the above depth has been estimated.
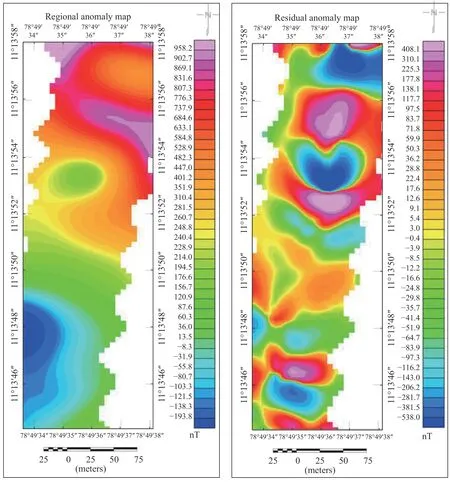
Fig. 5 Regional and residual anomaly map
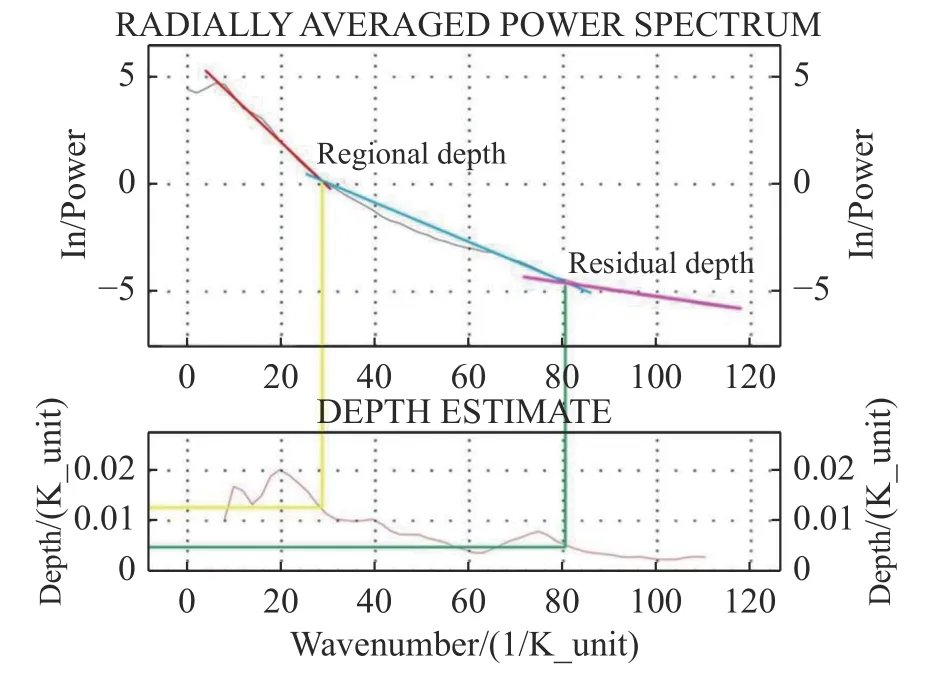
Fig. 6 Depth estimation using radially averaged power spectrum
2.6 Euler method
The Euler deconvolution depth technique is basically based on the Euler's homogeneity equation technique. It is used to delineate the location, depth and nature of any source present (Reid et al. 1990 and Thompson, 1982).

Where: (x0, y0, z0) is the position of a source whose total field T is detected at any point (x, y, z),B is the background value of the total field, N is the degree of homogeneity, physically interpreted as the attenuation rate with distance. The magnetic field and its gradient is related to the location of the source of an anomaly, with the degree of homogeneity expressed as structural index. The structural index (SI) entails the degree of fall off of the field with distance from the causative source. The Euler deconvolution depth technique is applied at each solution/location. The metan appropriate SI value 0, 1, 2 and 3. The structural index and depth range using by Euler’s method are shown in Table 1. For this study, the Euler depth of Structural Index-1 (window size 10) is used since it indicated the presence of linear or 2D bodies in the subsurface like shear/fault. The termite Mound 2 falls between the depth range of <20 m to >80 m and the termite mound 12 falls between the depth range of <50 m to >90 m (h range of <50 m to >90 m(Fig. 7).

Table 1 Structural index and depth range using Euler’s method
3 Discussion
3.1 Magnetic Breaks
Magnetic breaks have been marked with the help of TMI, RTE and AS maps. two sets of main breaks were delineated in this area which are NNE-SSW and WNW-ESE trending fractures (Fig. 8). These magnetic breaks represent the subsurface faulting/shearing structures. The NNE-SSW trending break is prominently seen in RTE map as well as in the AS map and can be observed along the trend of termite mounds 2, 12 and 18. Present concept regarding the hydro-fractures extracted based on the magnetic breaks and its spatial correlation with the NNE-SSW trending termite mounds is confirmed. It also appears that the intersection points of these fractures are the most favourable zone for groundwater exploration. Termite mounds are also noticed where the NNE-SSW and WNW-ESE trending fracture intersections occur. The intersection region of these magnetic breaks is demarcated as suitable zones for groundwater exploration because of the high structural porosity and permeability.
3.2 Interpretation of magnetic profiles
The magnetic profile lines indicate magnetic values distributed across the study area. The magnetic profile line 1 is in the northern region and profile line 4 in the southern region of the study area. The profile line 1 has a low value at 43 m (1 156 nT)where the fault zone is interpreted in the NNESSW direction. Similarly, all the profile lines with magnetic lows were intercepted near the fault zone.In the magnetic profile 2, the magnetic low value is recorded at 32 m (512 nT), followed by a magnetic low at 25 m (120 nT) on the magnetic profile line 3 shows low magnetic value towards. In profile line 4 the magnetic low values occur at 13 m (-100 nT). By connecting all the magnetic low values from the magnetic profile lines, a trend is formed in the NNE-SSW direction which exactly matches with the trend of termite mounds in the study area (Fig. 9).
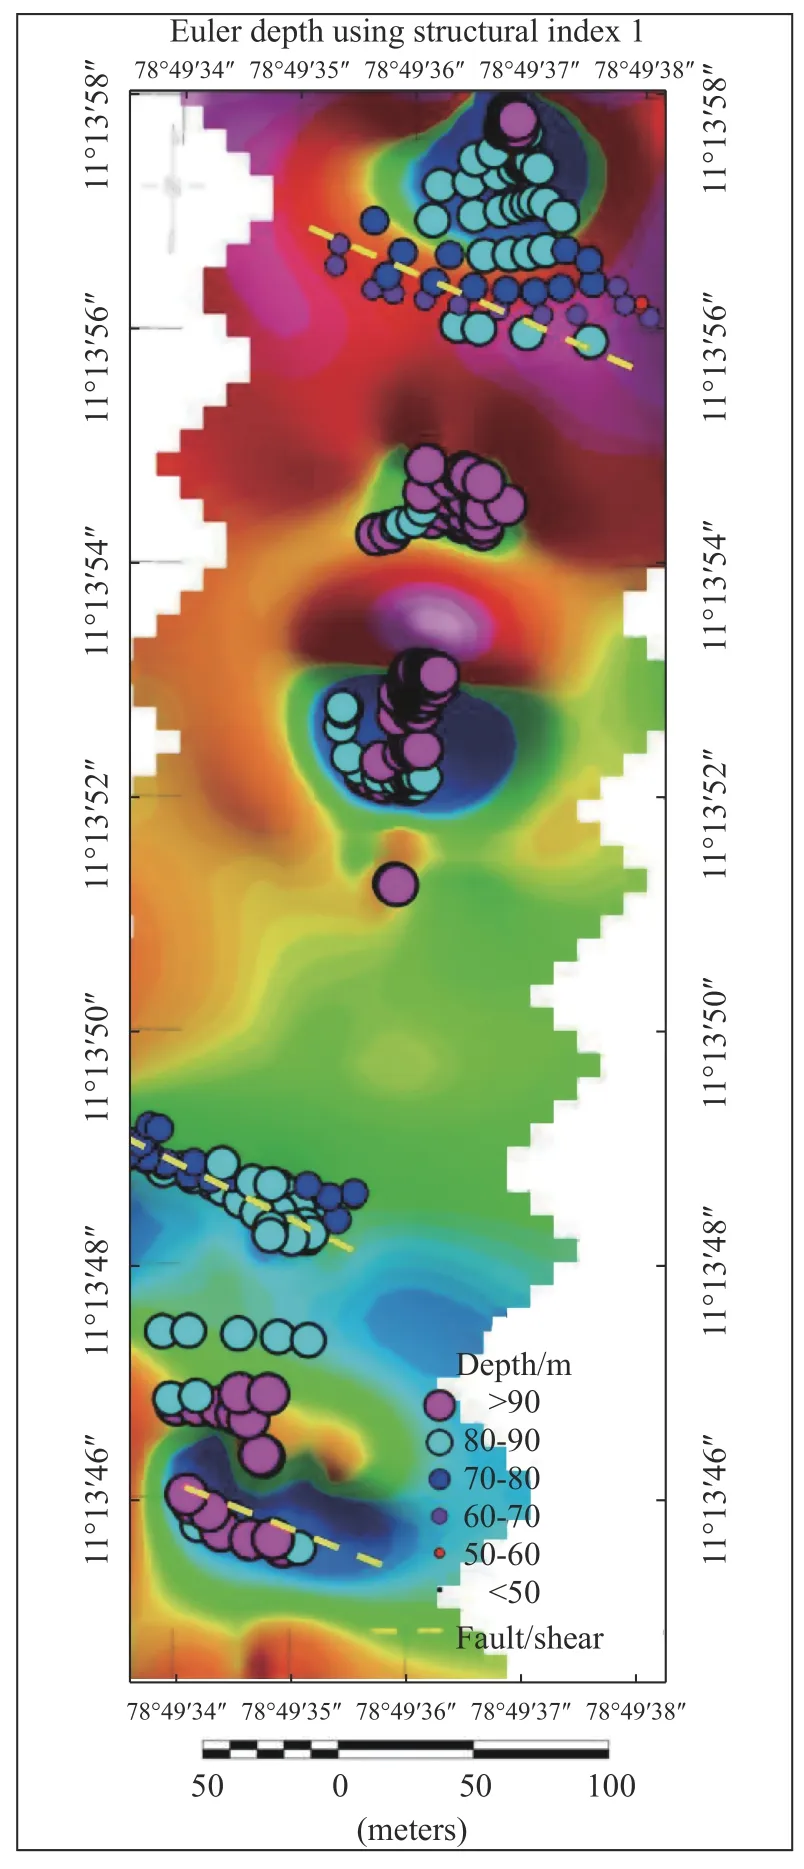
Fig. 7 Euler depth estimation using SI 1
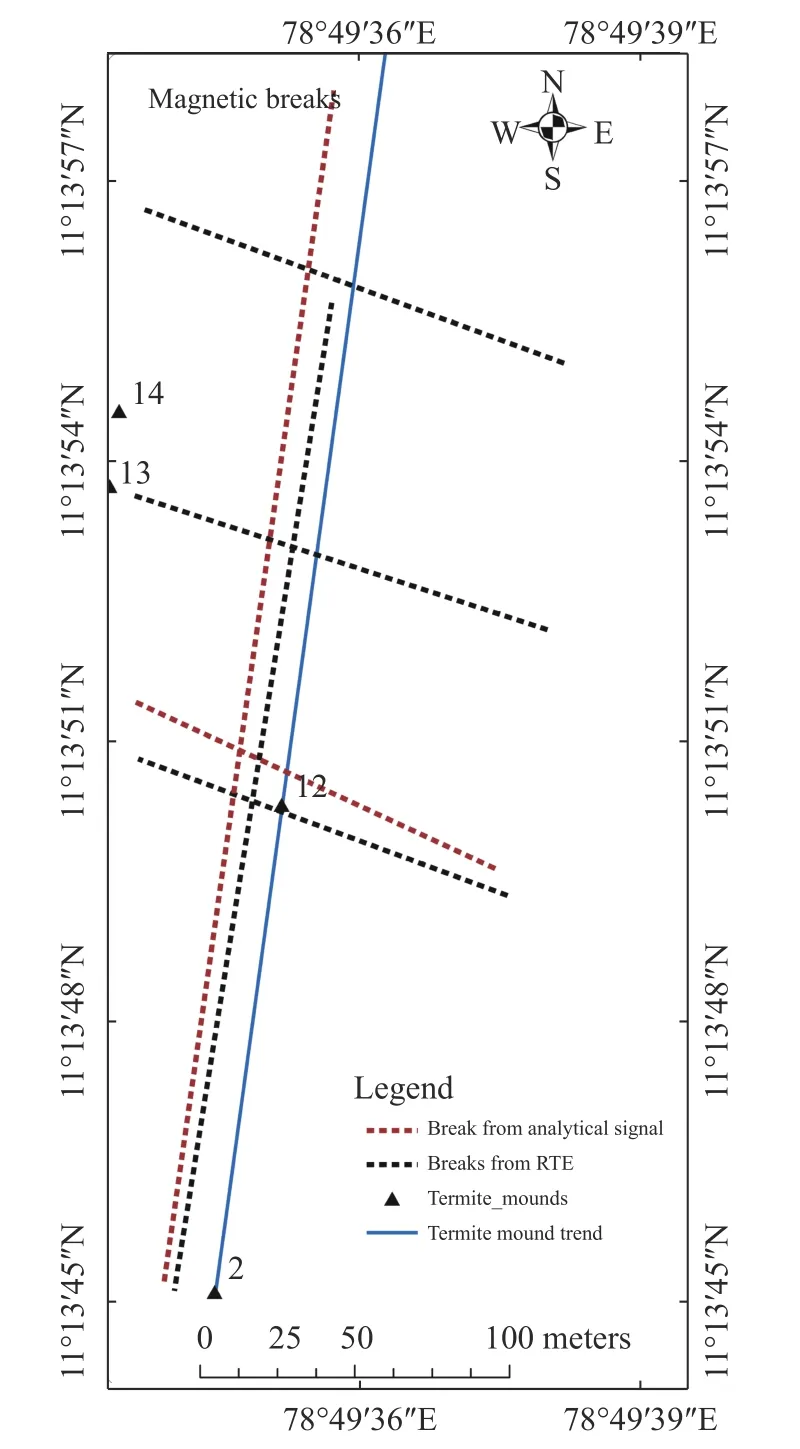
Fig. 8 Magnetic Breaks derived from RTE and AS maps
3.3 Proposed borehole locations
A number of borehole (BH) sites were proposed,based on the intersections of subsurface fractures obtained from the reduction to equator and analytical signal maps. A prominent NNE-SSW fracture is noticed in the RTE map spatially coincides with the fracture recorded from the AS map. Similarly the WNW-ESE trending fracture observed from the AS map also shows spatial correlation with the fracture recorded in the central portion of the RTE map. Exploration areas for groundwater have been demarcated based on the intersection of the above said subsurface fractures. Preliminary BHs were suggested to place in the loci where the maximum intersections occur near the termite mound 12 and the north of termite mound 12. Also a borehole has been suggested in the southern side of the NNESSW trending fracture near termite mound 2.These locations have been suggested to the farm owner and it will be validated once they drill the area of interest (Fig. 10).
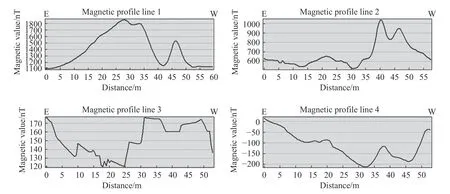
Fig. 9 Magnetic profiles
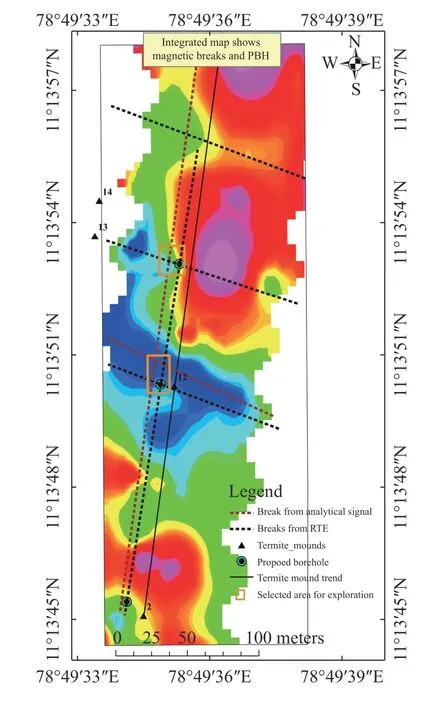
Fig. 10 Favourable and proposed borehole locations
4 Conclusions
The results obtained from this study indicate that there is a significant spatial correlation of the distribution of termite mound with the subsurface fractures obtained from ground magnetic survey.The study result confirms that the termite mound is a important bio-geological indicator for groundwater exploration in the agricultural field. The result is also significantly helpful for locating the possible borehole/open wells in the study area to solve the water demands of the famers. On this basis, three borehole locations were hence proposed by integrating magnetic breaks, trend of the termite mounds and fracture pattern noticed on the existing well sections. The depth of hydro-fractures estimated in the study area is ranging from<20 m to >100 m, so the farmers are advised to drill at least 60ft to reach the potentially conductive fracture zones. Based on the study, it is concluded that the termite mounds can be used as a biogeological indicator for the groundwater exploration; and this technique might be extrapolated the adjacent areas.
Acknowledgements
The author would like to acknowledge Department of Remote Sensing, Bharathidasan University for the provision of Magnetometer and constant engorgement towards research activities.
杂志排行
地下水科学与工程(英文版)的其它文章
- Numerical simulation of operation performance on production and injection of a double well geothermal system in Kailu Basin, Inner Mongolia
- Research on the characteristics and influencing factors of terrestrial heat flow in Guizhou Province
- Comparative analysis of bacterial contamination in tap and groundwater: A case study on water quality of Quetta City, an arid zone in Pakistan
- Holistic approach of GIS based Multi-Criteria Decision Analysis (MCDA)and WetSpass models to evaluate groundwater potential in Gelana watershed of Ethiopia
- Genetic model and exploration target area of geothermal resources in Hongtang Area, Xiamen, China
- Assessment of water level threshold for groundwater restoration and overexploitation remediation the Beijing-Tianjin-Hebei Plain
