Preparation and Identification of Reference Materials of Isorhamnetin and Rutin in Seabuckthorn Fruit Powder
2022-05-21YANGXiaoYANGJingyingPANMingfeiSONGYangWANGShuo
YANG Xiao,YANG Jing-ying,PAN Ming-fei*,SONG Yang,WANG Shuo*
(1.State Key Laboratory of Food Nutrition and Safety,Tianjin University of Science&Technology,Tianjin 300457,China;2.Tianjin Key Laboratory of Food Quality and Health,Tianjin University of Science and Technology,Tianjin 300457,China;3.College of Life Sciences,Tianjin Normal University,Tianjin 300387,China)
Abstract:Isorhamnetin(IS)and rutin(RU),two flavonoid compounds present in seabuckthorn,have very strong antioxidant activities for effective removal of free radicals in human body.In this paper,IS and RU of high-purity were prepared by a high-pressure liquid phase preparation method with ethanol dissolution,then their chemical structures were identified by Fourier transform infrared spectroscopy(FT-IR),ultraviolet(UV)spectroscopy,mass spectrometry(MS)and H/C-nuclear magnetic resonance(H/C-NMR).Furthermore,a typical HPLC method was used to evaluate the obtained IS and RU products in terms of homogeneity(inter and intra-bottles)and stability(long-term:6 months,-20 ℃;short-term:1 week,4 ℃and -20 ℃),both of them were confirmed excellent by statistical data.Finally,the purities of the prepared IS and RU reference materials were jointly determined by multiple laboratories(n = 8)to be 99.16% and 99.22%,with their extended uncertainties of 0.14% and 0.13%,respectively.The IS and RU reference materials obtained in the study could be used as reliable references in drug analysis or quality evaluation on seabuckthorn products.This study provided an effective method for the preparation and identification of IS and RU reference materials in seabuckthorn,which could be applied to the preparation of other reference materials.
Key words:reference materials;seabuckthorn;isorhamnetin;rutin;preparation and identification
Seabuckthorn,also known asHippophae rhamnoides L.,is a perennial small shrub or tree which is mainly distributed in Eurasia[1].The fruits and leaves of seabuckthorn are rich in nutrients and biologically active ingredients, such as vitamins, proteins, organic acids polysaccharides, flavonoids, phenolic compounds and sterols[2-3].Seabuckthorn is considered to be a good source of natural antioxidants,which can effectively eliminate free radicals in organisms,and is widely used in the production of various health foods and beverages and in the treatment of a wide range of diseases[4-5].These natural antioxidants can inhibit the oxidation of fats and proteins in the body,which is conducive to human health and physique[6].In 1977,Sea buckthorn was defined as a medicinal and edible homologous plant[7].Modern pharmacological studies have shown that the efficacy of the products of seabuckthorn is closely related to itscomponent flavonoids[8].As the main functional ingredients of seabuckthorn,flavonoids are one type of polyphenol metabolite with good antioxidant activity,which have proven to have anti-cancer[9],anti-inflammatory[10],anti-allergic[11]and antioxidant effects[12].Therefore, flavonoids can help protect the brain, heart and liver while inhibiting obesity[13-15].Isorhamnetin(IS)and rutin(RU)are two typical flavonoid functional ingredients that have been found in seabuckthorn,both of which have important pharmacological effects[16-17].
Reference materials(RMs)refer to materials or substances that have one or more sufficiently uniform and well-defined characteristic values[18-19].RMs are a measurement standard for calibrating systems of measurement including facilities and methods[20-21].RMs can effectively guarantee the metrological traceability of measurement results and ensure the accuracy and comparability of obtained results over time and space[22].RMs with good uniformity and reliable stability have a positive impact on the accuracy of inspection and measurement by improving the quality of measurement,which is critical to measurement and inspection[23].With the rapid development of modern science and technology and the quick replacement by new instrument,analytical testing technologies have come to underlie important decisions affecting science,economy,and industrial production,thus making the development and use of RMs more demanding and fruitful.
IS and RU flavonoids have a relatively low content(about 0.01%-0.03%)in seabuckthorn raw materials(fruits or leaves,etc.)and are easily oxidized[24-25].Other compounds in the raw materials such as myricetin and quercetin have similar physical and chemical properties to IS and RU,making separation and purification difficult[26].Therefore,it is not easy to obtain high-standard RMs of IS and RU from seabuckthorn raw materials for quality control of seabuckthorn-derived products including foods and pharmaceuticals.This also restricts the research on IS and RU in antioxidants.Therefore,the preparation of uniform,stable and reliable RMs of IS and RU can not only promote the research on seabuckthorn related products,but play a pivotal role in basic and application research on IS and RU.
In this study,the RMs of flavonoid antioxidants-IS and RU were prepared using seabuckthorn fruit powder as the raw material by combining alcohol dissolution with high-pressure preparation liquid phase separation.Structural identification and evaluationof homogeneity,stability,purity and uncertainty have proved that the obtained IS and RU products are uniform and stable with high purity(Fig.1).The proposed IS and RU products can be used as the RMs for quality inspection and supervision of seabuckthorn food and drugproducts.This study is possibly of high referential value for the development of RMs in natural products and the future development and utilization of natural antioxidants.
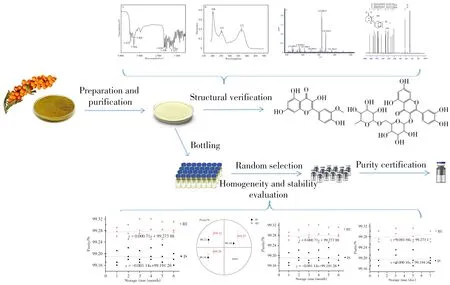
Fig.1 Schematic diagram of the preparation and identification of IS and RU RMs
1 Experimental
1.1 Reagents and instruments
The raw powder of seabuckthorn fruit was provided by Nanjing Puyi Biological Technology Co.,Ltd.(Nanjing,China)and stored in a closed and cool environment.Pure standards of IS and RU for result verification were purchased from Sigma-Aldrich(St.Louis,MO,USA).Deuterated methanol(CD3OD)and dimethyl sulfoxide(DMSO-D6)for nuclear magnetic resonance(NMR)analysis and KBr at high-purity for the fourier transform infrared spectrometer(FT-IR)were obtained from Merck(Darmstadt,Germany).Otherreagents including methanol, acetonitrile and trifluoroacetic acid were purchased from Tianjin Chemical Reagent Factory(Tianjin,China)and at least of analytical grade.Doubly deionized water(resistivity:18.2 MΩ·cm)used in the research was produced by a Water Pro water system(Labconco,Kansas City,MO,USA)and filtered with a 0.22 μm polyamide filter.The individual stock solutions of IS and RU were prepared by dissolving the IS and RU standards into methanol of HPLC-grade at the concentration of 1.0 mg/mL and stored at 4 ℃prior to use.The standard working solution at various concentrations was obtained daily by appropriate dilution of the stock solutions using methanol.
The high-pressure preparation liquid phase system(PREP150)was obtained from Tianpu Analytical Instrument Co.,Ltd.(Shanghai,China)using the high-pressure preparative column(ODS-2,30 mm × 250 mm,5 μm,100 Å)from Tianjin Bonna-Agela Technologies(Tianjin,China)for separation and enrichment of extracts from the raw materials.The HPLC system equipped with an auto-injector,binary pumpand ultraviolet detector(UV)from Shimadzu(Kyoto,Japan)was used to analyze the contents of IS and RU products.A LC separation column(ODS C18,4.6 mm×250 mm,5 μm)(Bonna-Agela,Tianjin,China)was used for effective separation between targets and interferences.A high resolution mass spectrometer(Aglient 6400)(Agilent,USA)was used for molecular weight analysis of the obtained products.The1H,13C-NMR and FT-IR(4 000-500 cm-1)spectra of the obtained products were analyzed on a 400 MHz NMR spectrometer and a Vector 22 spectrometer(Bruker,Germany).
1.2 Extraction and purification of IS and RU
The raw powder of seabuckthorn fruit was placed in a blast drying oven and air-dried at 40 ℃for 24 h.After being filtered using a 100-mesh sieve,the solid powder of seabuckthorn was collected and stored tightly at 4 ℃.4.0 g of the dried raw seabuckthorn powder was placed into a 50 mL glass flask and mixed with 30.0 mL of petroleum ether(60-90 ℃).The mixture was refluxed at 50 ℃for 2 h.After being re-circulated twice using petroleum ether,the filtered solid residues were collected,evaporated and dried.Then,4.0 g of degreased seabuckthorn powder was mixed with 120.0 mL of ethanol solution(60%)in a 250 mL glass flask.The mixture was heated to reflux in water bath at 50 ℃for 2 h and centrifuged at a low speed(3 000 r/min)for 10 min.The supernatant was collected and concentrated to approximate 10 mL in a 50℃water bath before being loaded onto the system of high-pressure liquid chromatography for separation.The effluent that ranged from 22.0 to 24.3 min(IS)and from 14.7 to 15.8 min(RU)was collected and freeze-dried to obtain the solid products,respectively.The solid products collected in multiple batches were combined and uploaded a second time to improve the purity.Finally,the collected IS and RU products were stored in dark at 4 ℃for further research.The separation by high-pressure preparation liquid chromatography was performed using the mixture of water(containing 0.1% trifluoroacetic acid)(A)and acetonitrile(B)as the mobile phase.The conditions ofgradient elution were as follows:0-25 min:the ratio of phase B was increased from 5%to 20%;26-50 min:the ratio of phase B was increased from 20%to 50%;51-65 min:the ratio of phase B was maintained at 50%.
1.3 Structural verification of the obtained IS and RU products
In this study,the chemical structure of the obtained IS and RU products was analyzed using FT-IR,UV adsorption spectra,mass spectrometry(MS)and NMR spectroscopy,as required by ISO guide 34[27].The experimental processes were as follows:
FT-IR:Approximately 150.0 mg of pre-dried KBr powder mixed with 1.0 mg of IS or RU products were fully ground in an agate mortar and pressed into tablets.The prepared KBr tablets were carefully immobilized on the sample holder for infrared spectrum analysis(Wavenumber:4 000-500 cm-1).
UV adsorption spectra:1.0 mg of IS or RU products was accurately weighed and dissolved into 1.0 mL of ethanol to achieve a concentration of 1.0 mg/mL for UV absorption spectral analysis with the scanning wavelength ranging from 200 nm to 500 nm.
Years passed, till Vasilissa grew up and became of an age when it is good to marry. All the young men in the village, high and low, rich and poor, asked for her hand, while not one of them stopped even to look at the stepmother s two daughters, so ill-favored were they. This angered their mother still more against Vasilissa; she answered every gallant9 who came with the same words: Never shall the younger be wed4 before the older ones! and each time, when she had let a suitor out of the door, she would soothe10 her anger and hatred11 by beating her stepdaughter. So while Vasilissa grew each day more lovely and graceful12, she was often miserable13, and but for the little doll in her pocket, would have longed to leave the white world.
MS:The standard working solution of IS and RU at the concentration of 10 μg/mL was prepared by diluting 10 μL of the standard stock solution(1.0 mg/mL)to 1.0 mL using methanol before being injected into the LC-MS system to be scanned by an electrospray ion source(ESI)in the negative ion mode.The experimental conditions were set as follows:the flow rate of the LC mobile phase(methanol):0.2 mL/min;gas flow rate:9 L/min;the injection volume:10 mL;gas temperature:350 ℃;the spray pressure:40 psi;the capillary voltage:4 000 V;the detection range of molecular weight:100-700 m/z.
1H and13C NMR:25.0 mg of IS or RU products was accurately weighed and dissolved in CD3OD(DMSO-D6).The solution was transferred into an NMR tube and loaded onto the NMR analysis system.The NMR analysis procedure was performed with a proton frequency of 400 MHz and at a temperature of 25 ℃.
1.4 Evaluation of the obtained IS and RU products
The purity of the obtained IS and RU products was evaluated by the typical HPLC method with great accuracy and stability.The mobile phase of the HPLC system consisted of methanol(A)and water containing 0.5% formic acid(B)under gradient elution conditions(0-10 min:A was increased from 10% to 20%;10-25 min:A was increased from 20%to 28%;25-30 min:A was increased from 28%to 40%).The separation was carried out on a reversed phase LC column(ODS C18,4.6 mm×250 mm,5 μm)at a flow rate of 1.0 mL/min and at 35 ℃.The detection wavelength was 360 nm for IS and 260 nm for RU,respectively.
1.4.1 HomogeneityGood homogeneity is typical of RMs and needs to be evaluated.In this study,the inter and intra-homogeneity of the prepared IS and RU products was investigated in depth.Fifteen samples for the inter-homogeneity test were randomly selected from 100 bottles of uniformly packed products,which were dissolved into methanol at a concentration of 1.0 mg/mL for the analysis of IS or RU contents by HPLC.The intrahomogeneity test sample was randomly selected one bottle,which was divided into four parts and three of them were measured(the other one was spare).Each sample was repeatedly measured at least three times,and the resulting purity data was used for variance analysis.
1.4.2 StabilityIn this study,the long-term(six months,-20 ℃)and short-term(one week,-20 ℃,and 4 ℃)stabilities of the obtained IS and RU products were evaluated.In the long-term stability test,the subsamples(5.0 mg/unit)from one randomly selected bottle were stored at -20 ℃for six months.Each month,the purity of IS(or RU)of one unit was evaluated.In the short-term stability test,the sub-samples were stored at-20 ℃and 4 ℃for one week,and further analyzed using HPLC(n=3).
1.4.3 Purity verification and uncertainty evaluationAccording to the requirement on RMs[28],the purity of the prepared IS and RU products was verified by analyzing one sample in multiple laboratories(n= 8)using a typical HPLC method.Each laboratory was required to measure the sample at least three times,and the resulting data was collected for the analysis of purity.The uncertainties of IS and RU purity were mainly brought by the homogeneity(inter and intra),the stability(long and short-term)and the purity verification process.The equations used for uncertainty evaluation were listed as follows(Table 1).
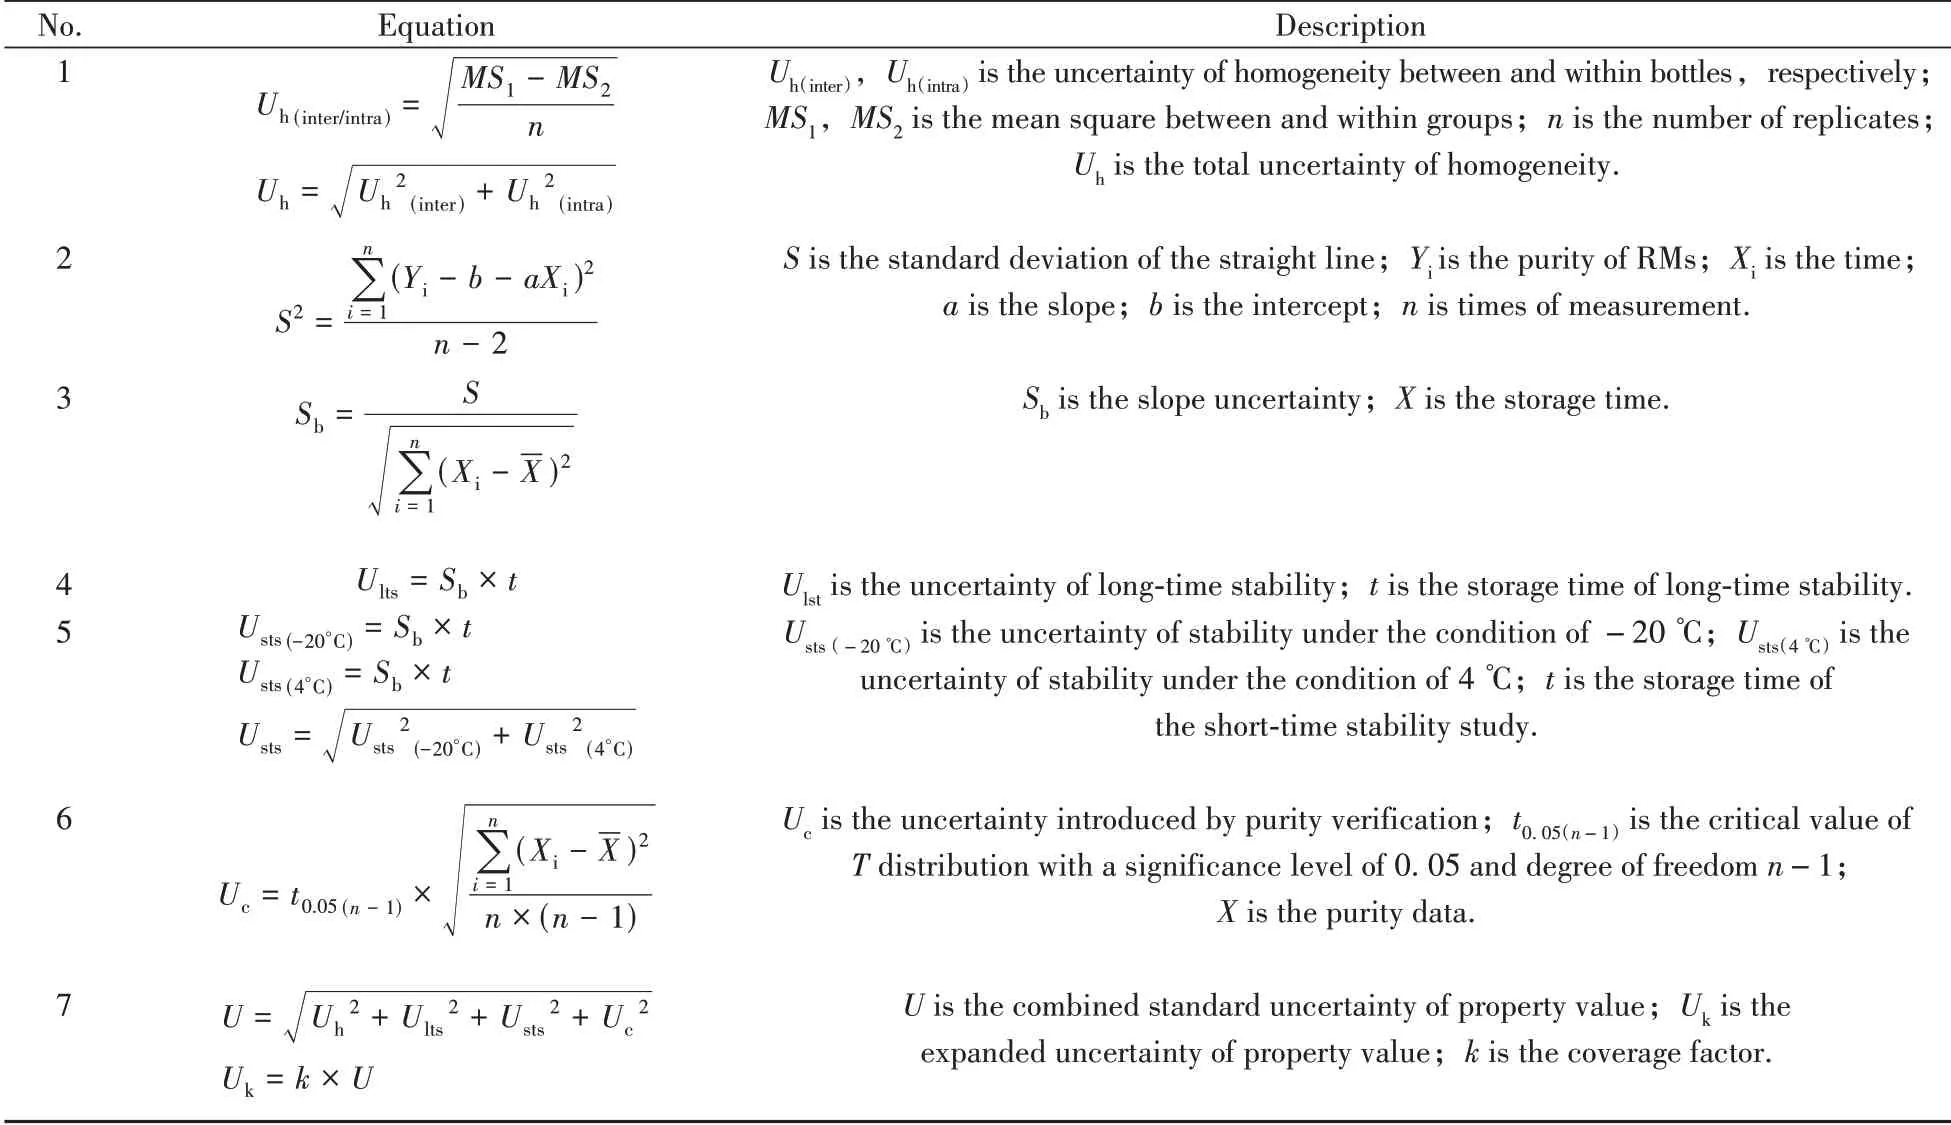
Table 1 Equations in uncertainty evaluation of IS and RU
2 Results and discussions
2.1 Preparation of IS and RU using high-pressure liquid chromatography
Due to the low content of the two targets in seabuckthorn, the raw fruit powder was preliminarily degreased,concentrated and refined.As a result of the low solubility of flavonoids in water,the extraction rate of the targets was low and impurities were likely to occur when water was used as the solvent.A relatively high extraction temperature can increase the solubility of the target extract in the extraction solvent,which facilitates the mass transfer of the target to the liquid phase,but other ingredients are likely to enter the raw materials to dissolve in water,seriously affecting the purity of the obtained product.The ethanol solution(60%)has a good ability to dissolve IS and RU and reduce impurities in the products.As a result,60% of ethanol solution was selected to extract the target IS and RU at 70 ℃and a liquid-solid ratio of 30∶1(m/m)from the raw materials in the study.
Fig.2 shows the LC chromatograms of IS and RU obtained in the high-pressure preparation process.Time interval of collecting the product was 22.0-24.3 min(IS)and 14.7-15.8 min(RU),respectively.From Fig.2A,2C,the IS and RU in the extract were found to have good adsorption and desorption on the selected LC enrichment column of high-pressure.The product purified by repeating the sample loading was collected,lyophilized and re-dissolved for purity verification using the HPLC method.The chromatograms of the obtained IS and RU products are shown in Fig.2B,2D.The results showed that the use of high-pressure liquid phase separation to prepare RMs of small molecular substances from raw materials was feasible and applicable to the preparation of other standard substances.
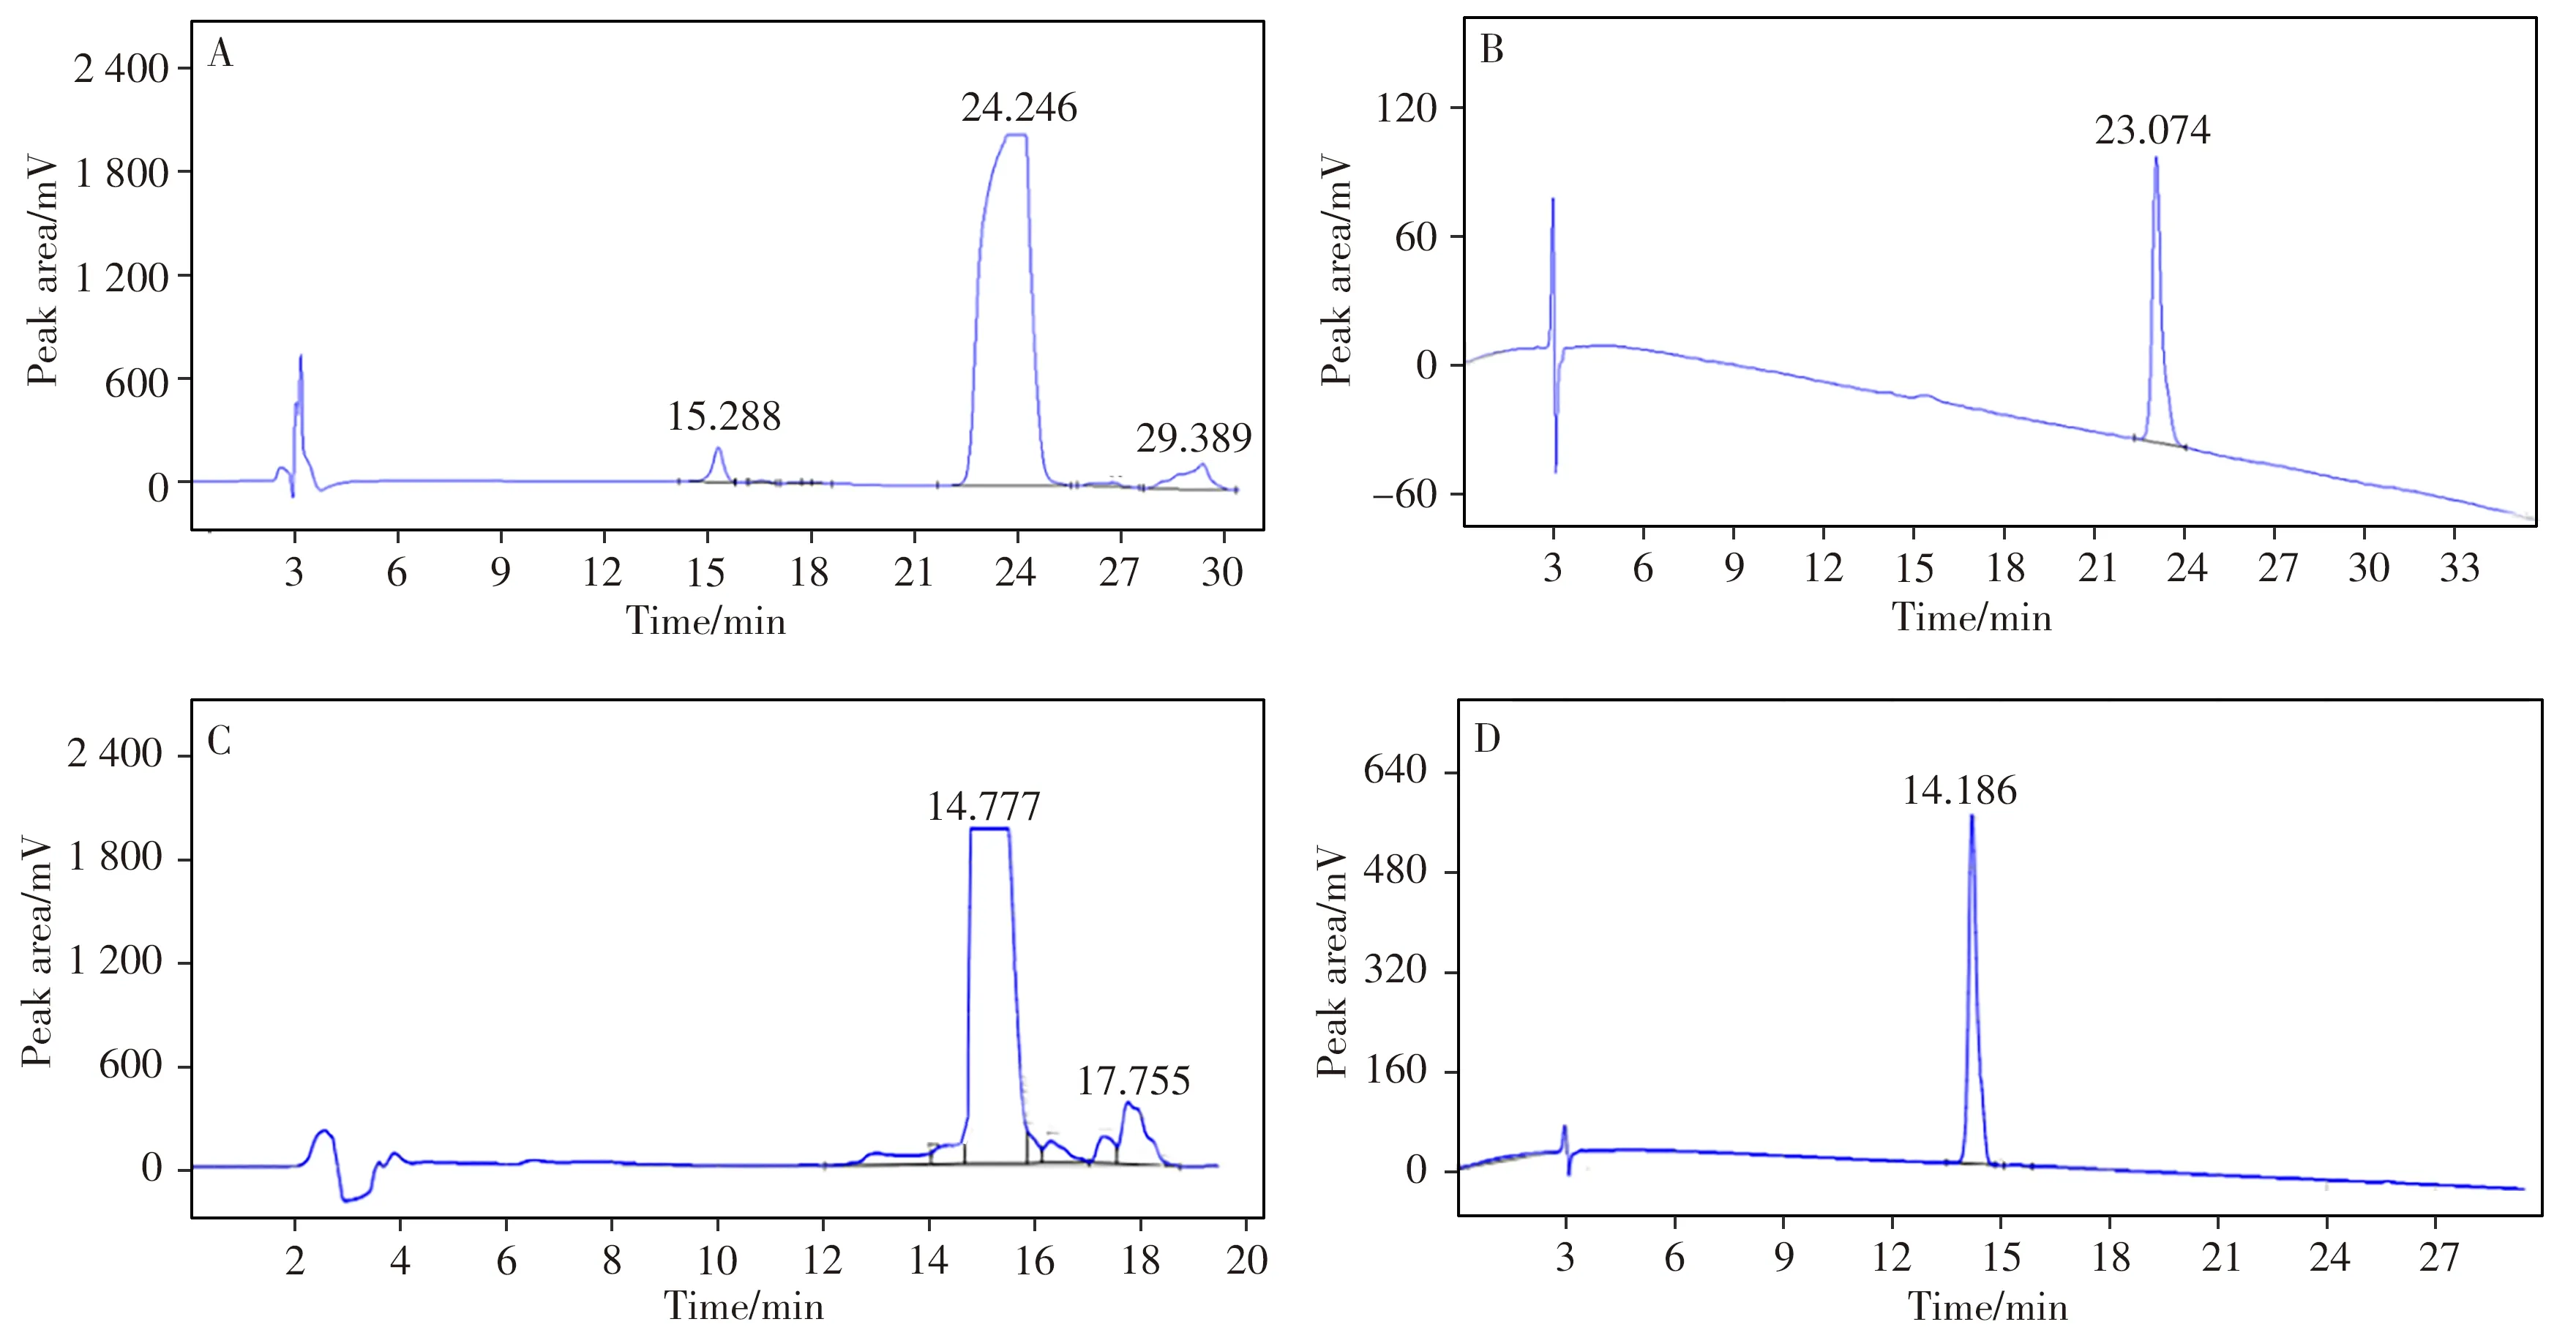
Fig.2 High-pressure preparation liquid phase diagrams of IS(A)and RU(C),and chromatograms of IS(B)and RU(D)products
2.2 Spectral analysis results
2.2.1 FT-IR and UV absorption spectraFig.3(A-D)shows the obtained FT-IR and UV absorption spectra of IS and RU products.In the FT-IR spectrum of IS(Fig.3A),the strong and narrow absorption peak at 3 304 cm-1indicates the stretching vibration of O—H,while the absorption at 1 654 cm-1can represent the in-plane bending of carbonyl C==O.The absorption peaks of 1 599,1 377 and 1 161 cm-1refer to the stretching vibration of the benzene ring skeleton,the out-of-plane bending of the phenol structure and the stretching vibration of the C—O structure of the phenolphenol,respectively,which indicate that the tested substance has a clear aromatic ring structure.Fig.3B shows the FT-IR spectra of the product RU,which is analyzed as fol-lows:The strong absorption peak of 3 415 cm-1corresponds to the stretching vibration of O—H.The absorption peak of C==O shifts to 1 655 cm-1,which is due to the conjugation of the beneze ring and the double bond in the Ru structure.The absorption peak at 1 600 cm-1corresponds to the benzene ring skeleton,while the peak at 1 487 cm-1corresponds to the shear vibration of the methylene group in the RU structure.The absorption peak at 1 361 cm-1corresponds to the in-plane bending vibration of the methine group in RU structure.Its high-frequency direction shift is due to the induction of the adjacent O—H.The peak at 1 300 cm-1represents the antisymmetric absorption of aromatic ether,and the absorption peaks at 1 233-1 011 cm-1correspond to the stretching vibration of C—O in ether and alcohol,respectively.
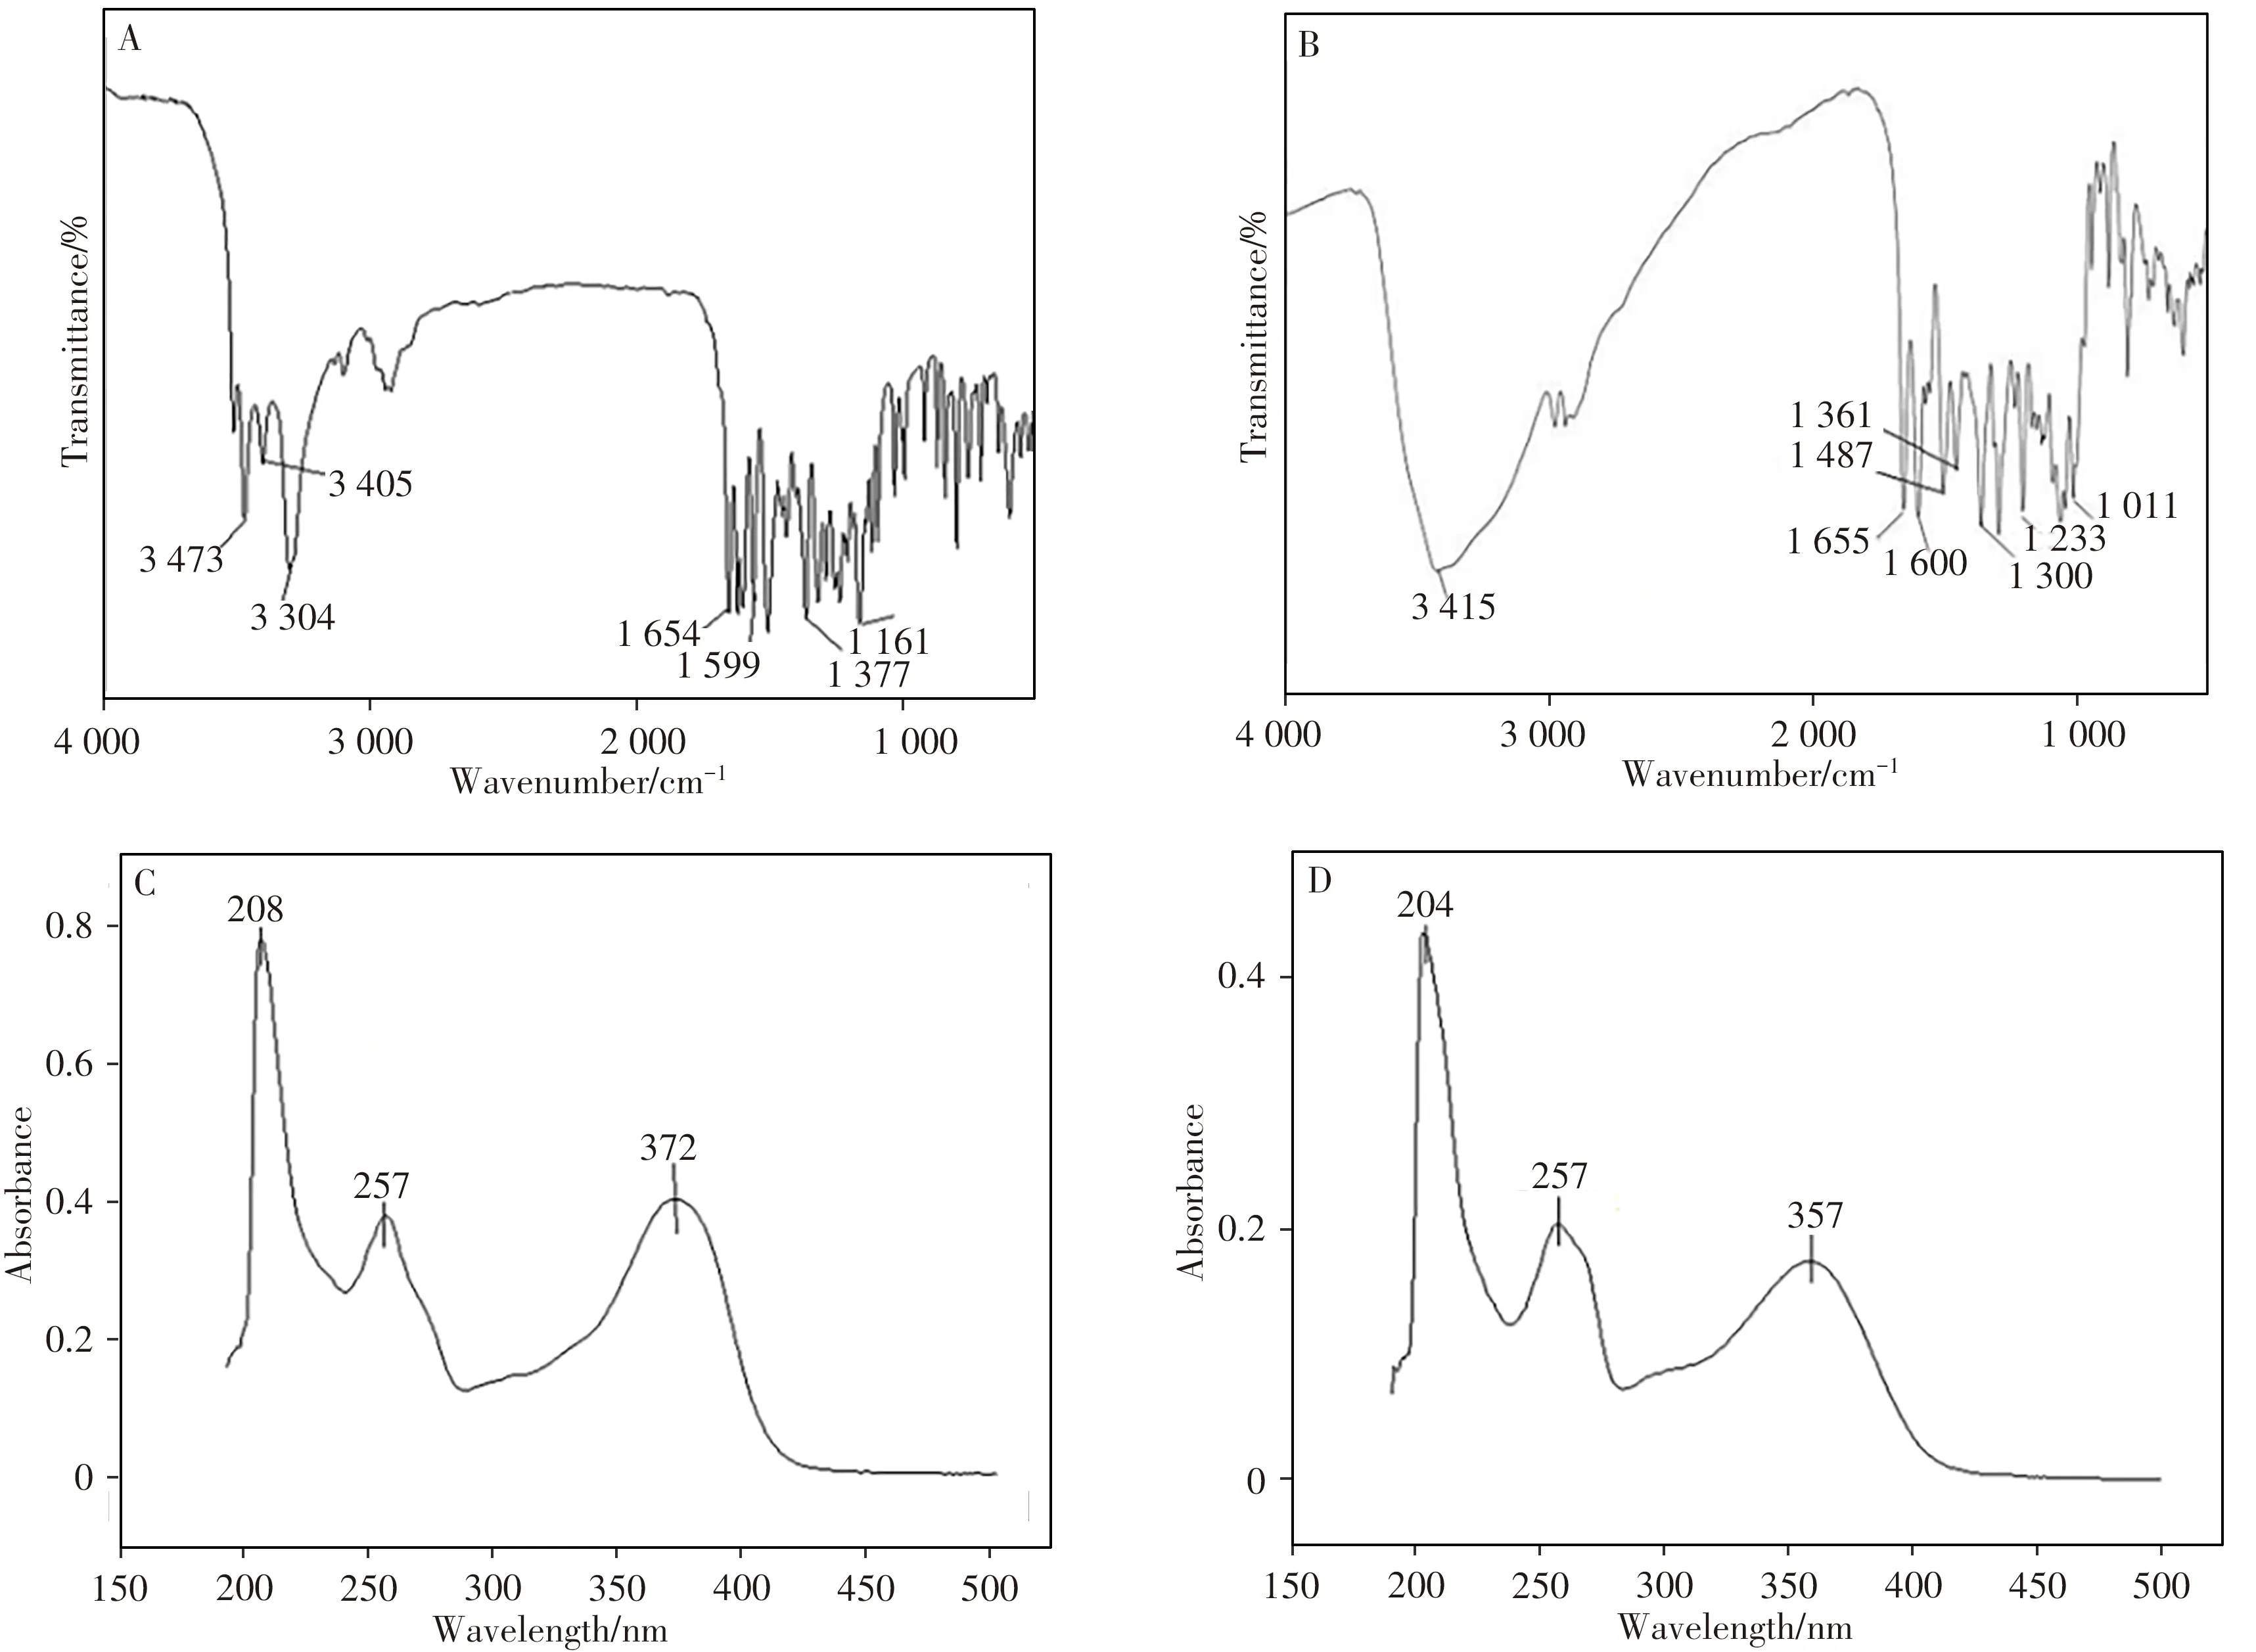
Fig.3 FT-IR spectra of IS(A)and RU(B),UV spectra of IS(C)and RU(D)
There is a conjugated system composed of cinnamoyl and benzoyl in the structure of flavonoids.Therefore,in methanol solution,flavonoids have two main ultraviolet absorption bands in the 200-400 nm region,which are peak band I(300-400 nm)and peak band II(220-280 nm).Since the characteristic absorption band I of flavonols with 3-position free-OH is 350-385 nm,and the band II is between 250-280 nm,it can be concluded that the obtained product was a flavonoid containing 3-free-OH alcohol compounds.It could be seen from Fig.3C,3D that the obtained IS and RU products exhibited characteristic band I at 372 nm and 357 nm,and characteristic band II at 257 nm.The FT-IR and UV absorption spectra of the obtained IS and RU products were consistent with those of the purchased IS and RU reference products[29].
2.2.2 MS analysisThe MS analysis results of IS and RU are shown in Fig.4.Fig.4A and A’ are the full scan ion mass spectrum of the obtained IS and RU products,respectively.The ions withm/zof 315.00 and 609.00 were the precursor ions of IS and RU.According to the fracture mode analysis(B and B’),the ions withm/zof 299.90 and 300.02 were the characteristic ion of IS and RU(C and C’).These results demonstrated that the prepared IS and RU products had high purity and could be used as RMs in other research.
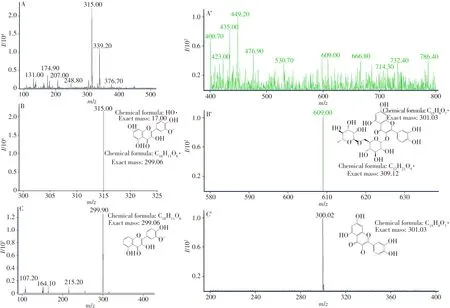
Fig.4 Results of MS analysis of the prepared IS(A-C)and R(A’-C’)products A and A’:full scan ions;B and B’:parent ions;C and C’:daughter ions
2.2.31H and13C NMR analysisThe1H and13C-NMR data of products are consistent with the chemical structure of IS and RU.For IS product:1H-NMR(400 MHz,CD3OD)δ(ppm):3.84(3H,s,16-CH3),6.19(1H,s,2-H),6.47(1H,s,4-H),6.93(1H,d,11-H),7.68(1H,d,14-H),7.75(1H,s,15-H),9.42(1H,br s,13-OH),9.73(1H,br s,3-OH),10.75(1H,br s,7-OH),12.46(1H,s,1-OH).13C-NMR(100.0 MHz,DMSO-D6)δ(ppm):175.88(C-p),163.92(C-o),160.69(C-n),156.16(C-m),148.81(C-l),147.36(C-k),146.62(C-j),135.83(C-i),121.97(C-h),121.72(C-g),111.70(C-e),115.54(C-f),103.03(C-d),98.21(C-c),93.60(C-b),55.76(C-a).For RU product:1H-NMR(400 MHz,CD3OD)δ(ppm):1.11(3H,d,27-CH3),3.22-3.57(8H,m,3,4,5,21,24,25,26-H),3.60-3.65(1H,1,23-H),3.77-3.84(1H,m,2-H),4.52(1H,s,22-H),5.10(1H,d,1-H),6.21(1H,d,10-H),6.39(1H,d,12-H),6.86(1H,d,16-H),7.62(1H,d,19-H),7.69(1H,d,20-H).13C-NMR(100.0 MHz,DMSO-D6)δ(ppm):178.00(C-ɑ),164.59(C-z),161.57(C-y),157.92(C-x),157.09(C-w),148.39(C-v),144.43(C-u),134.22(Ct),122.14(C-s),121.71(C-r),116.28(C-q),114.64(C-p), 104.23 (C-o), 103.31 (C-n),101.01(C-m),98.53(C-l),93.45(C-k),76.78(C-j),75.82(C-i),74.32(C-h),72.53(C-g),70.83(C-e),70.69(C-f),69.99(C-d),68.30(Cc),67.14(C-b),16.48(C-a).
2.3 Evaluation of IS and RU products
Homogeneity, stability, purity and uncertainty are important characteristics of RMs,which underwent extensive study here.
2.3.1 Homogeneity evaluationThe homogeneity of the resulting product involved inter and intra-homogeneity,which means the homogeneity between bottles and within bottles,respectively.For inter-homogeneity,the IS or RU purity of 15 bottles randomly selected from 100 prepared IS and RU products was tested using HPLC method.The intra-homogeneity test samples came from one randomly selected IS or RU product,which was divided into four parts and three of them were determined.The obtained results are shown in Fig.5,and the results of variance analysis are shown in Table 2.
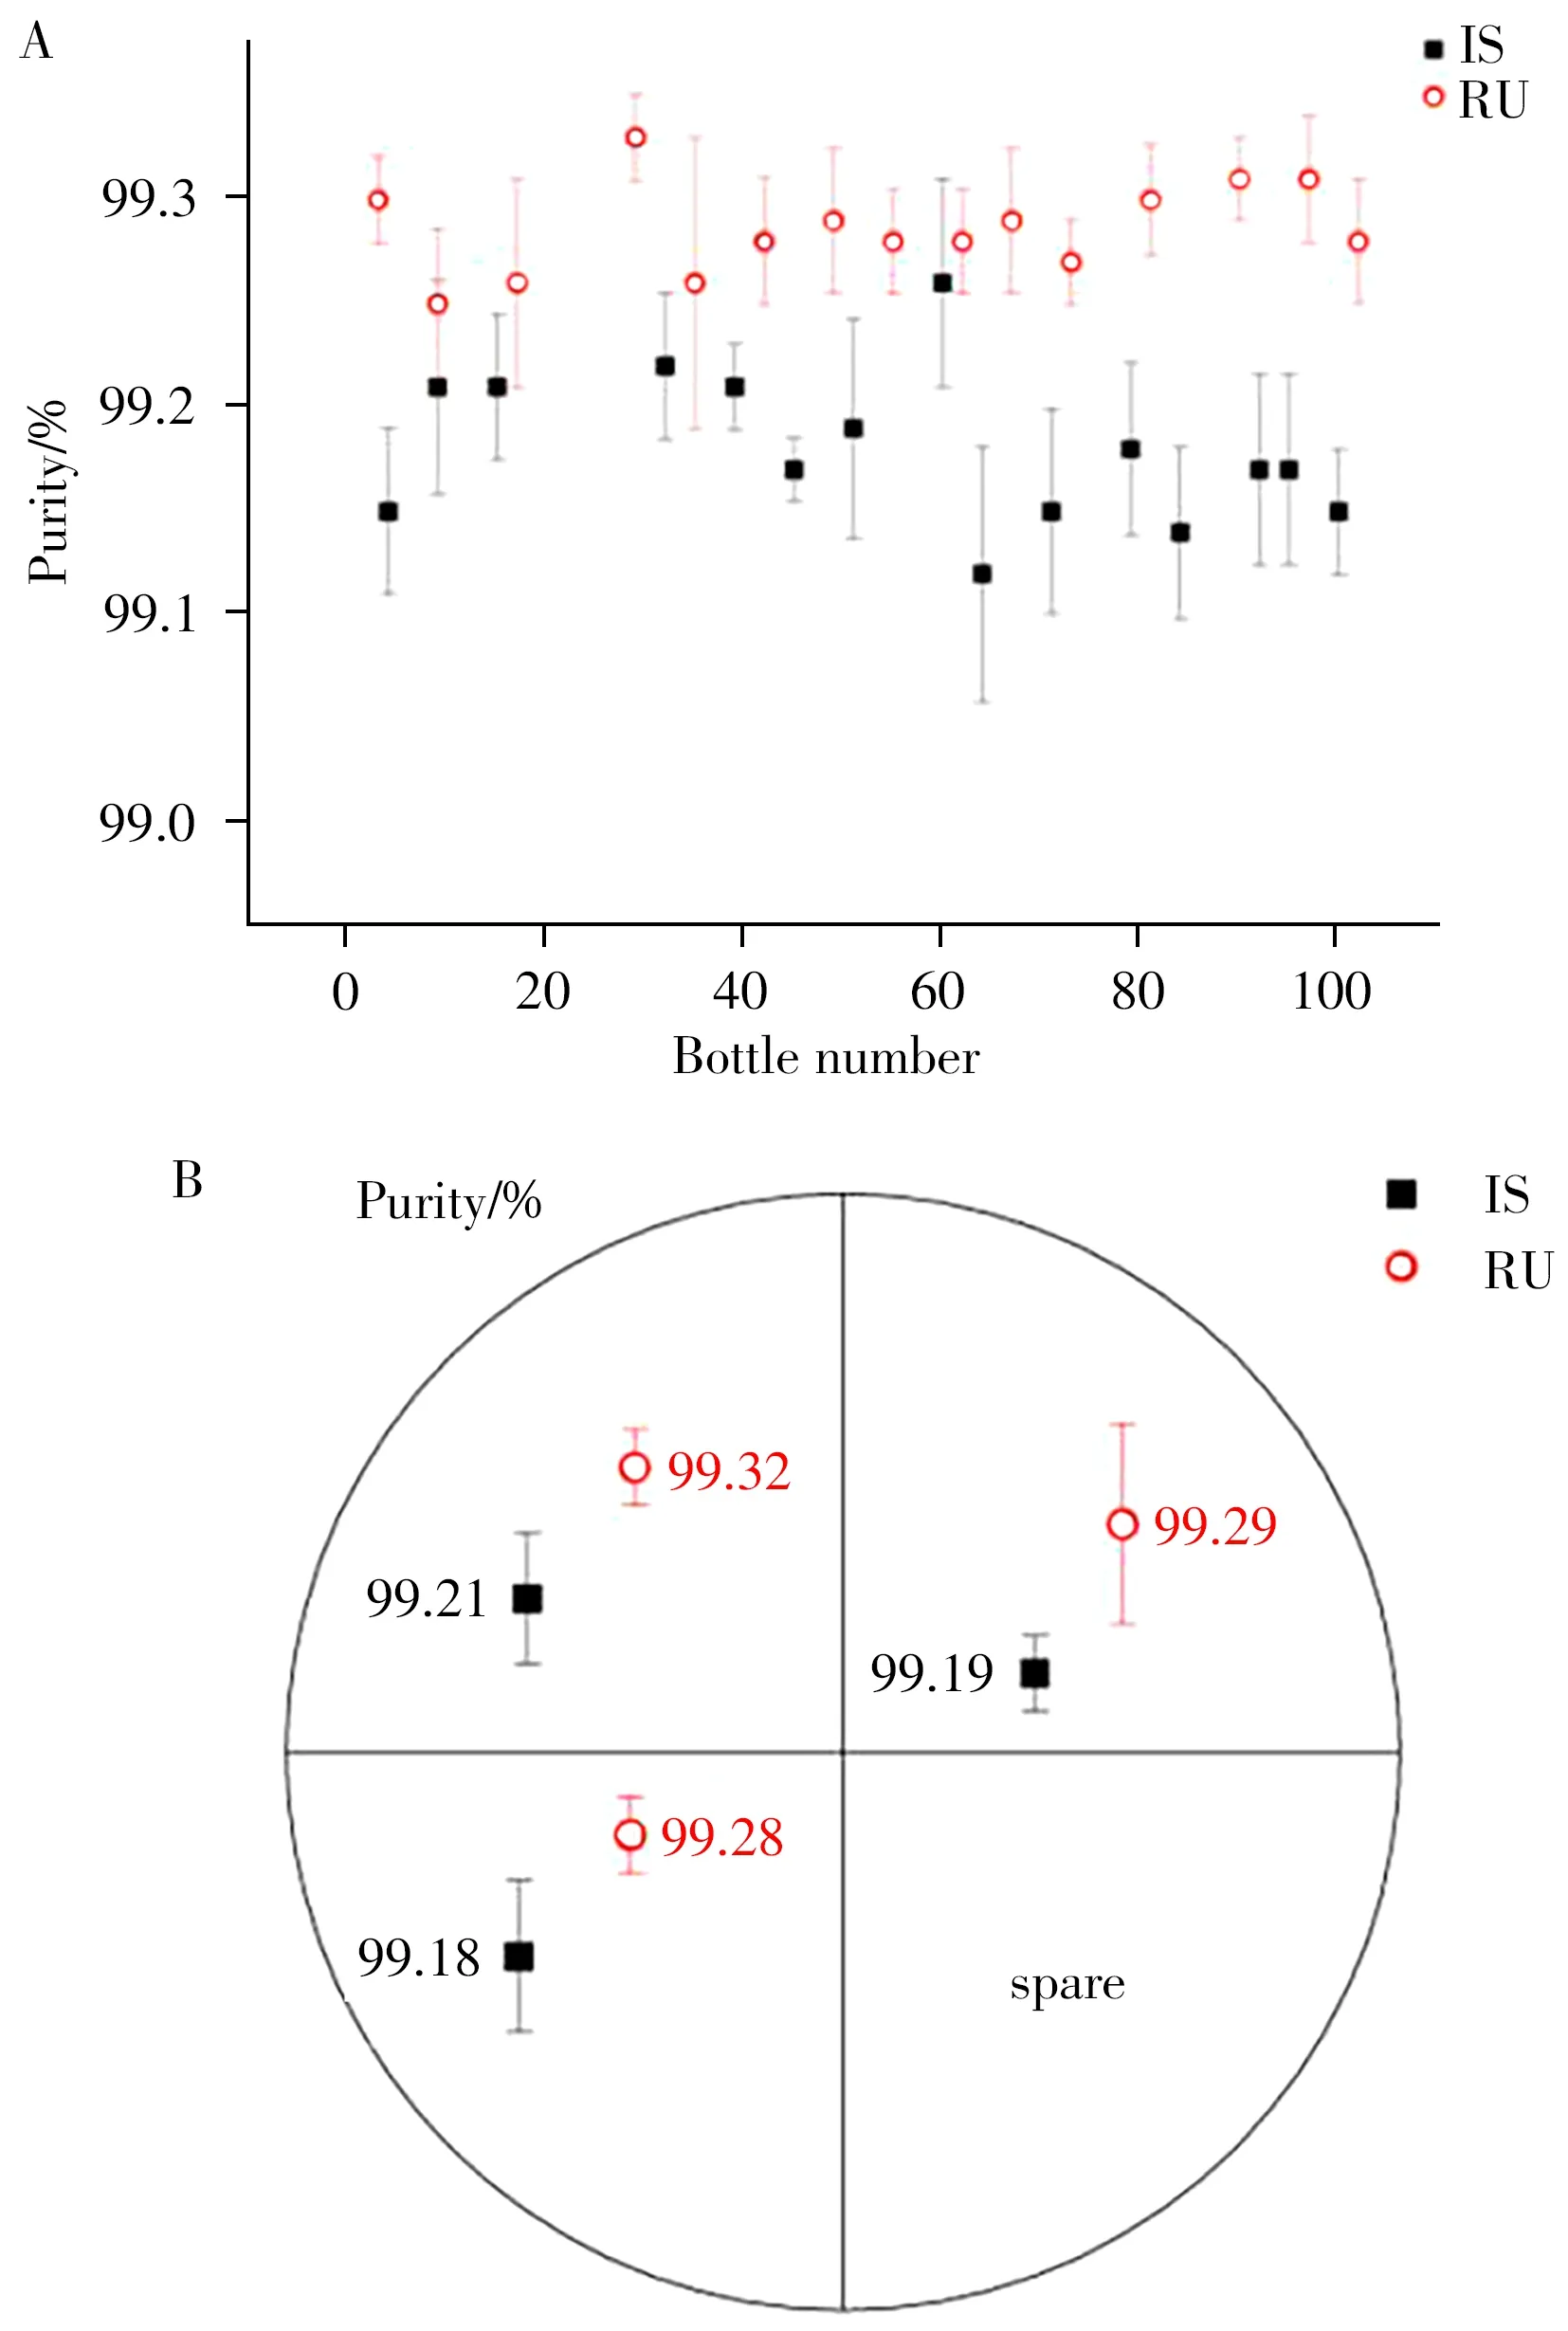
Fig.5 Inter-homogeneity results of 15 randomly picked bottles(A),intra-homogeneity results of 3 randomly picked parts(B)
As illustrated in Table 2,the calculatingFvalues of the inter-homogeneity of IS and RU were 2.025 and 1.090,respectively,which were less than 2.037(F0.05(14,30)).TheFvalues of the intra-homogeneity were 1.470 and 1.025,respectively,which were less than 5.143(F0.05(2,6)).These results indicated that there was no significant difference in purity data within and between groups and that the RM homogeneity of the prepared IS and RU was good.
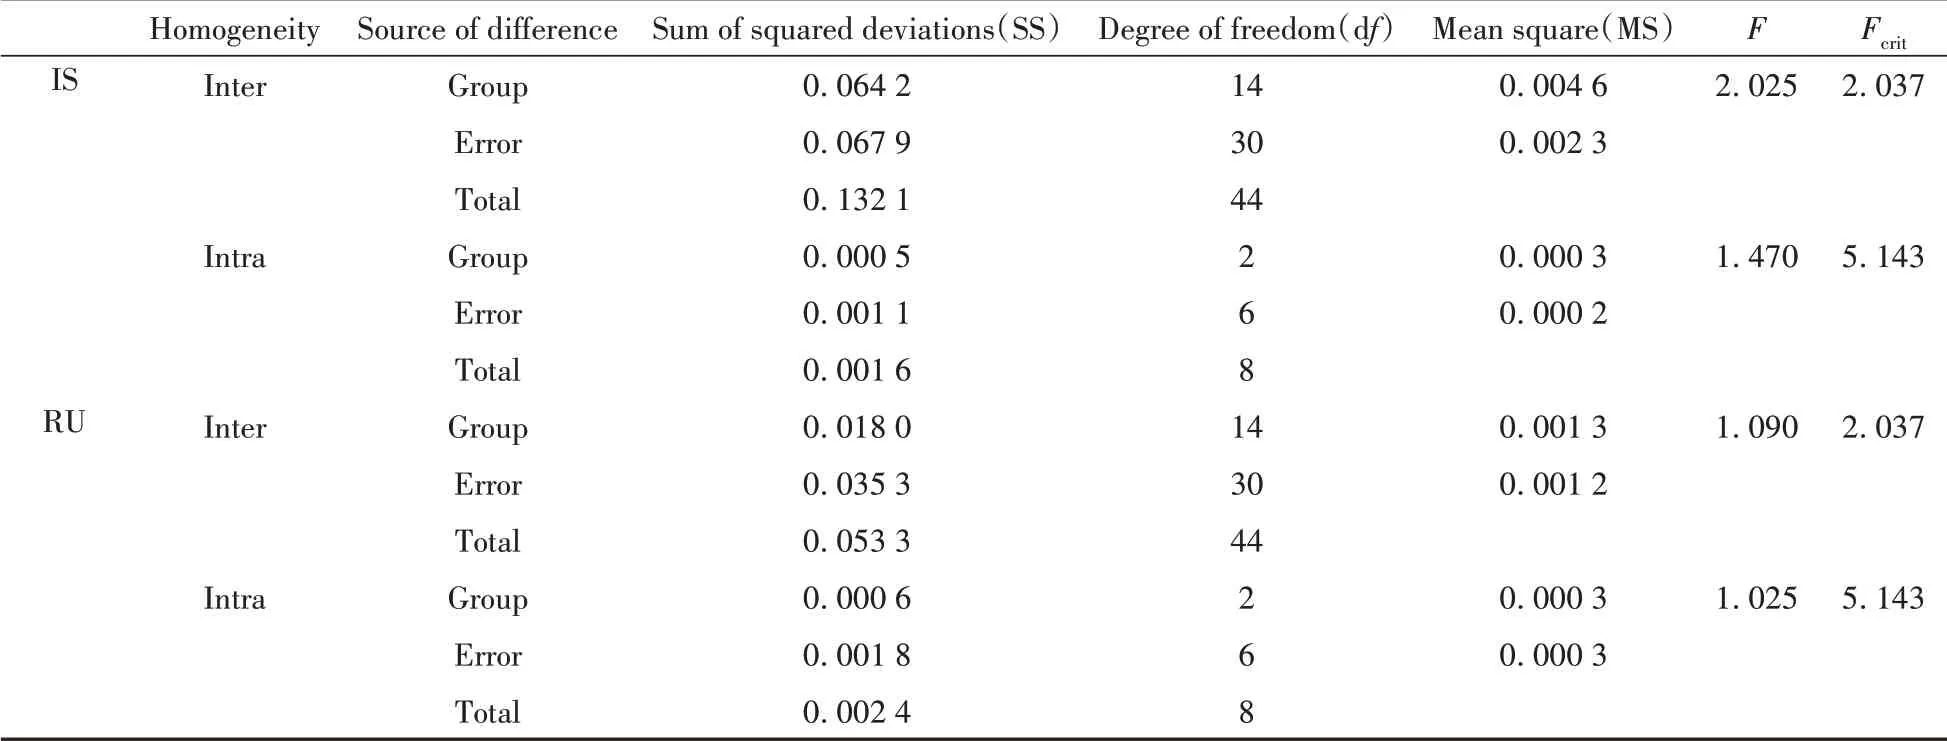
Table 2 Results of variance analysis of inter-and intra-homogeneity of IS and RU products
2.3.2 Stability evaluationThe long-term and short-term stabilities of the prepared IS and RU products were evaluated under different experimental conditions(long-term:stored at-20 ℃for 6 months;short-term:stored at-20 ℃and 4 ℃for 1 week).
Fig.6A illustrates the regression analysis results of testing data in evaluation of long-term stability.Two regression equations corresponding to IS and RU were obtained asy= -0.001 14x+ 99.191 26 andy=0.000 71x+ 99.273 88,respectively,whereymeant the purity(%)of the products andxmeant the storagetime(month).TheS2andSbfor IS and RU were calculated as 8.50 × 10-4,5.51 × 10-3and 1.17 × 10-3,6.46 × 10-3,respectively.Under the degree of freedom(n-2)of 5 and confidence interval(P)of 0.95,the value oft0.95(5)was assigned as 2.571.The absolute values of the slopes from the two regression equations were both less than thet0.95(5)×Sb,demonstrating that the slope difference was insignificant.These results suggested that the prepared IS and RU products were stable enough to be stored at -20 ℃for at least 6 months.In the evaluation of short-term stability,the regression equations from the obtained purity data by storing IS and RU products for 1 week under the temperature of -20 ℃and 4 ℃were y=0.002 93x+ 99.194 62(-20 ℃,IS),y= 0.000 16x+ 99.194 16(4 ℃,IS)andy= -0.000 30x+ 99.280 97(-20 ℃,RU),y=0.001 94x+99.273 1(4 ℃,RU),respectively(Fig.6 B,6C).TheSbfor IS and RU were calculated as 4.97 × 10⁻³(-20 ℃),5.39 × 10-3(4 ℃)and 4.74 × 10⁻³(-20 ℃),3.85 × 10-3(4 ℃),respectively.According to thet0.95(3)at 3.182,the absolute value of the slopes was less than the calculatedt0.95(3)×Sbvalue,which proved that the prepared IS and RU products had a stable purity and could be stored at 4 ℃and-20 ℃for one week.
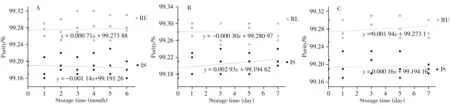
Fig.6 Stability evaluation of IS and RU products
2.3.3 Purity verification and uncertainty estimationFor purity verification,eight eligible laboratories were selected to determine the purity of the IS and RU products using the typical HPLC method.Five paralleled tests were required on one sample in each laboratory.The resulting IS and RU purity data was verified by Grubbs test.The resultingGmaxwas less thanGcrit,suggesting that there was no suspicious value in intra-and inter-group data and all the purity data should be reserved.The purity data from different laboratories was evaluated by Cochran test.The results ofCmax<Ccritindicated that the tests from the selected laboratories were at equally precise.The statistics of IS and RU by Shapiro-Wilk test were 0.934 and 0.936,respectively,both of which were less than the Wcrit,thus offering evidence that the obtained data of the collaborative determination conformed to normal distribution.Therefore,the purity of IS and RU products was established using the arithmetic mean(IS:99.16%;RU:99.22%).Table 3 shows the statistical results related to purity verification of the IS and RU products.
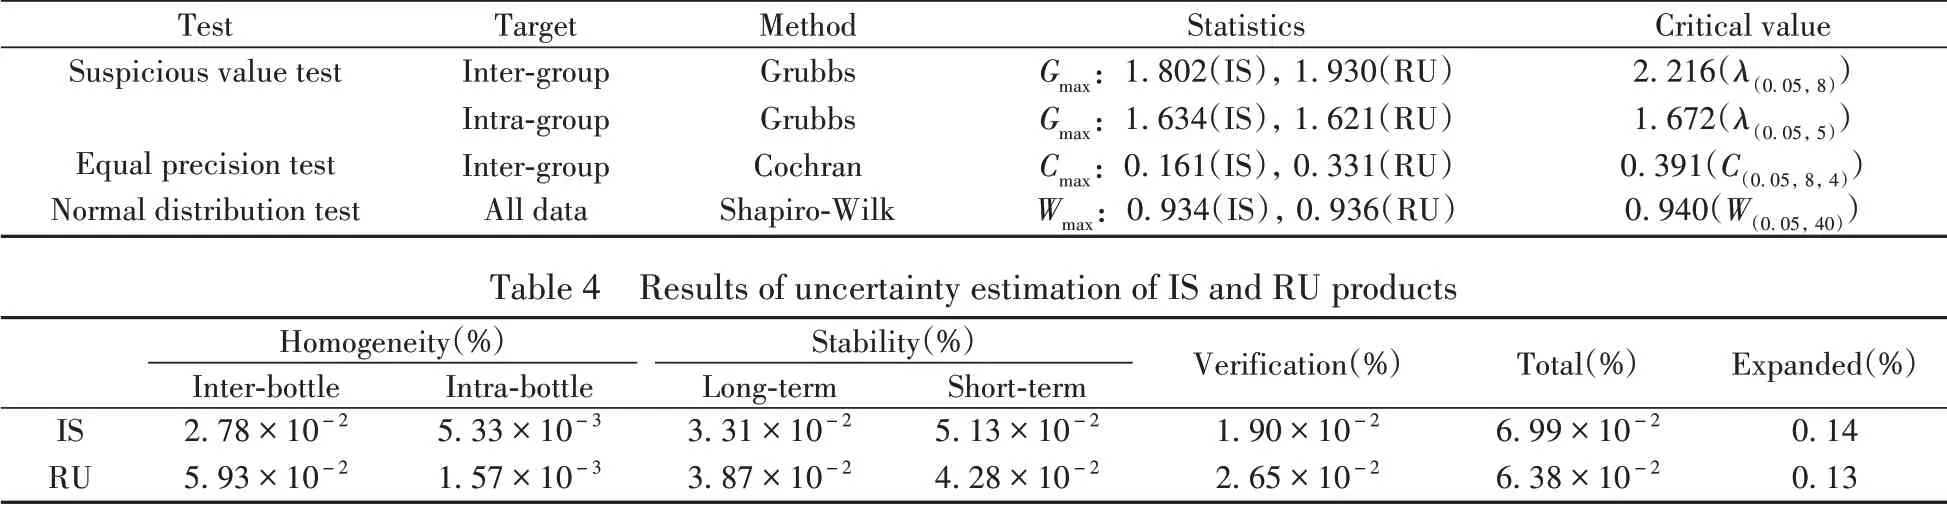
Table 3 Statistical results of purity of IS and RU products
Total uncertainty estimation of products was introduced by the uncertainty of homogeneity(inter and intra,stability(long and short-term)and the purity verification.Table 4 illustrates the uncertainty data calculated from each part.The total uncertainty of IS and RU products was calculated as 6.99×10⁻²%and 6.38×10⁻²%,respectively.Furthermore,the expanded uncertainty of IS and RU purity was calculated as 0.14% and 0.13%under thePof 0.95 and coverage factor(k)of 2.As a result,the IS and RU purity was established as(99.16 ± 0.14)% and(99.22 ± 0.13)%,respectively,demonstrating that the prepared IS and RU productshad high purity and could be used as RMs.
3 Conclusions
This research has successfully prepared the RMs of IS and RU with good homogeneity,stability and high purity from seabucrorn fruit powder.The products can be used as reference in drug analysis or quality evaluation of seabuckthorn products,showing good prospects of application.The proposed strategy for the preparation of RMs based on high-pressure liquid phase separation has been proved to be feasible and has remarkable advantages,which can be extended to the preparation of RMs of other plant-derived small molecule substances.