Spatiotemporal Analysis and Prediction of the Resilience in China’s Economy, Energy, and Environment System
2022-05-07WANGYanweiLONGWeiHUANGYi
WANG Yanwei, LONG Wei, HUANG Yi
(1.College of Architecture and Engineering, Yunnan Agricultural University, Kunming 650201, China;2.College of Economics and Management, Yunnan Agricultural University, Kunming 650201, China)
Abstract: With the rapid economic development in China, it is increasingly difficult to strike a balance between protecting the country’s natural environment and meeting its energy needs. Faced with external disturbances, the resilience of the economy, energy, and environment system (3E system) is particularly important. Scientifically measuring the resilience development state of the 3E system will help to save energy, protect the environment, and promote high-quality economic development. This study has four aims: to construct a conceptual model and a comprehensive evaluation system based on DPSIR to illustrate the resilience of the 3E system (EDR); evaluate the EDR level in China with entropy weight method, TOPSIS method, and coupled development model; analyze the temporal and spatial differences of EDR with time series and spatial variogram; and predict the resilience status of different regions in China with the grey prediction GM(1,1) model. The results show that the resilience value of most regions maintains a steady upward trend with small fluctuations, the spatial variation of resilience is increasing, and the characteristics of spatial differentiation are obvious. On the whole, it presents a spatial evolution pattern of “East > middle > West.”
Key words: economy-energy-environment system;resilience;spatiotemporal evolution;China
0 Introduction
In the context of the rapid development of the global economy, China has become one of the largest economy groups; however, with rapid economic growth, the problems of environmental pollution and energy use are becoming clearer. There are mutual influences and mutual checks and balances among energy systems, economic systems, and environmental systems, collectively called the 3E system[1]; simultaneously, financial crises, policy adjustments, market changes, natural disasters, and other un-certainties[2]increase the sensitivity and vulnerability of 3E systems, while resilience provides a new theoretical perspective for maintaining stability, reducing vulnerability, and improving adaptability[3-4]. Therefore, studying the temporal and spatial evolution and predicting the resilience of China’s 3E system is essential for improving its resilience level and promoting the sustainable development of China’s economy, energy, and environment.
1 Literature review
Currently, research on the 3E system focuses on three facets. One is the sustainability of economic growth under energy constraints, mainly focused on the optimal path of economic growth and the optimal exploitation of resources under the framework of the neoclassical growth model[5-6]; introducing resources into the production function allows for discussion of sustainable development of resources and economic growth under the framework of endogenous economic growth[7-8]. The second aspect is the sustainability of economic growth under environmental constraints, showing that emission of pollutants as an input factor can play the role of social capital by relying on the natural environment and have a positive impact on economic growth, but the continuous consumption of environmental capital will lead to the decline of total social capital, reducing the quality of the natural environment and negatively impacting the sustainability of economic growth[9-10]. The third approach is to bring economy, energy, and environment into the same framework for research.
The word “resilience” comes from the Latin resilire and refers to the ability of a system to maintain its own stability and recovery after being disturbed[11-12]. In 1973, Holling first put forward the concept of resilience in ecosystems and made a systematic interpretation. Since then, the study of resilience in ecology[11], psychology[13], engineering[14], supply chains[3], and management[15]have developed rapidly and have experienced the conceptual evolution process of engineering resilience, ecological resilience, and evolution resilience[16-17], mainly focused on the evolution mechanism, calculation methods, influencing factors, and empirical analysis[18]. The current research found that external shocks (e.g., economic crisis and enterprise bankruptcy), and internal disturbances (such as industrial recession and climate change) are important factors affecting the change of regional resilience[19]. Furthermore, the spatiotemporal evolution characteristics and impact factors of resilience on urban, agriculture, and tourism were also analyzed[18-20]. Current research mainly focuses on the application of resilience in regions, cities, tourism, agriculture, etc.; however, there is still little attention given toEDR.
The study of the temporal and spatial evolution ofEDRis important because such study will help us understand the response mechanism of 3E systems to external disturbances. However, compared with other research propositions, little attention has been given toEDR, and so further research is required. In this study, on the premise of combining DPSIR model with resilience, the resilience evaluation indicators of 3E systems in China are constructed, and then spatiotemporal evaluation ofEDRis conducted. Finally,EDRfor the next five years is predicted. The research provides a decision-making basis for optimization ofEDR.
2 Materials and methods
2.1 Evaluation model
The DPSIR model was established by the European Environment Agency in 1993 based on the PSR and DSR framework. Because the model has the advantages of strong comprehensiveness and clear logic, it has been widely used in the research fields of energy, environment, and sustainable development[21]. This study constructs a conceptual model of 3E system by using DPSIR (Fig.1).
Based on the concept model, the resilience indicators of 3E systems are refined (Table 1).
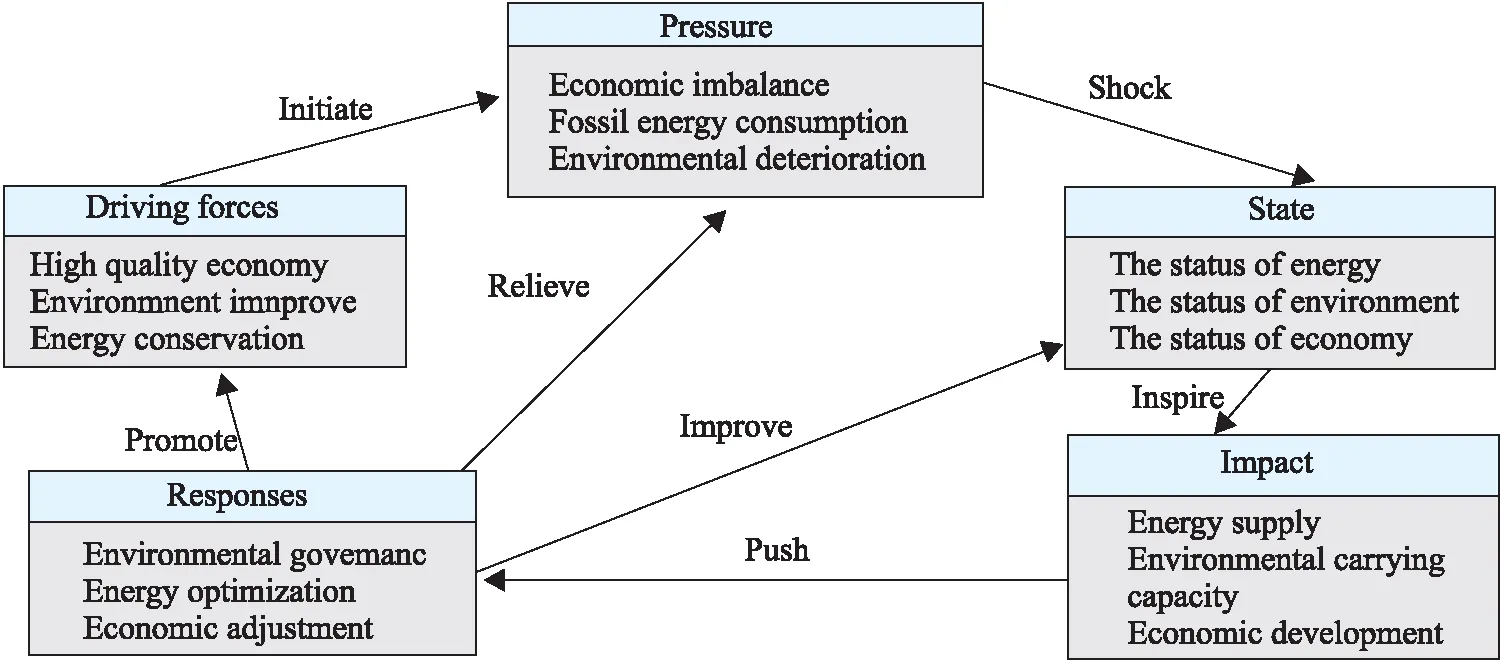
Fig.1 Conceptual model of EDR by DPSIR

Criterion layerElement layerIndicatorIndicator weightIndicator typeRefs.Driving forcesEconomyGDP0.052+[22]Total import and export trade0.140+[22]Total investment in fixed assets0.056+[22]PressureEnvironmentSO2 emission0.009-[23]Wastewater discharge0.005-[23]Industrial solid waste production0.004-[22]EnergyTotal energy consumption0.008-[24]Total electricity consumption0.006-[22]StateEconomyPer capita GDP0.036+[25]Per capita disposable income0.037+[26]EnergyProportion of industrial energy consumption in energy consumption0.098-[26]Per capita energy consumption0.005-[26]EnvironmentUrban green space area0.046+[27]Per capita park green space area0.040+[27]Greening coverage rate of builtup area0.009+[28]Number of nature reserves0.052+[26]ImpactEconomyProportion of tertiary industry employment in total employment0.019+[26]Proportion of tertiary industry output value in regional GDP0.014+[26]

(续表1)

Tab.2 EDR classification grade
2.2 EDR classification grade
So far, no unified standard for the resilience evaluation of 3E systems has been formed. Based on the existing research[29]and combined with the actual situation ofEDR, resilience is divided into 10 grades according to the principle of interval equalization (Table 2).
2.3 ED calculation
1) Standardize data to enhance indicator comparability.xλijis the value of the provinceifor indicatorjin yearλ. Formula 1 is used when the indicator is positive and Formula 2 is used when the indicator is negative. Use Formula 3 to normalize,i=1,2,3,…,m;j=1,2,3,…,n;λ=1,2,3,…,h.
(1)
(2)
(3)
2) Calculate information entropy of each indicator.
(4)
3) Calculate the weight
(5)
4) Use TOPSIS[30]to calculateED(the relative closeness to the ideal solution). Calculate the separation degree fromX+toX-of alternatives.
(6)
(7)
5) Calculate the positive ideal solution with Formula 8 and the negative ideal solution with Formula 9.EDHis the most preferred alternative andEDLis the least preferred alternative.

(8)
(9)
6) CalculateEDi, the relative closeness to the ideal solution of alternativei.
(10)
2.4 EDR calculation
The calculation procedures are as follows.
1) CalculateDR, the system coupling degree, whereED(a) is theEDof the economy subsystem,D(b) is theEDof the energy subsystem, andED(c) is theEDof the environment subsystem[31].
(11)
2) CalculateDD, the system’s development index, where the coefficientα=β=η=1/3, because of the equal importance of three subsystems in the interactive mechanism
DD=αED(a)+βED(b)+ηED(c)
(12)
3) CalculateEDRof the system
(13)
2.5 Spatial variogram analysis
A variogram is an effective means to analyze the law of spatial variation and structural analysis[32]. This study uses this model to reveal the spatial evolution law ofEDRin China. The function expression is:
(14)
whereZ(xi) andZ(xi+t) are the EDR values ofZ(x) on the spatial unitsxiandxi+t, respectively;N(t) is the number of samples separated byt.
Kriging interpolation is a simulation of spatial modeling and interpolation of random processes based on spatial variation model[33]. In a specific finite region, the Kriging method can give the optimal linear unbiased estimation. The function is expressed as follows:
(15)
whereZ(x0) is an unknown point,Z(xi) is a known sample point, andλiis the weight of the sampleipoint to the unknown point.
2.6 EDR prediction
The greyGM(1,1) model has the advantages of simple principle and high prediction accuracy; in addition, the researcher can preprocess the original data to obtain better smoothness, making the prediction more effective[34].GM(1,1) is valid for making relatively precise predictions, especially when there are limited sample sizes in the system[35]; therefore, theGM(1,1) model is useful in this study where the data sizes are relatively limited (13 years of data).
2.7 Data sources
The study area includes China’s 30 provinces on the Chinese mainland, not including Tibet, because the data were incomplete. Related data are from the 2005-2017 editions of China Statistical Yearbook, China Statistical Yearbook on Environment, and China Energy Statistics Yearbook, along with national economic and social development statistics bulletins from the 30 provinces. Some data are calculated according to the above data and the missing data are supplemented by linear interpolation.
3 Results and discussions
3.1 Temporal analysis of EDR
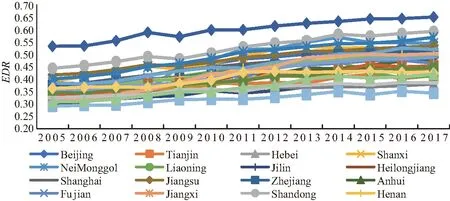
Fig.3 EDR of 30 provinces in China from 2005 to 2017
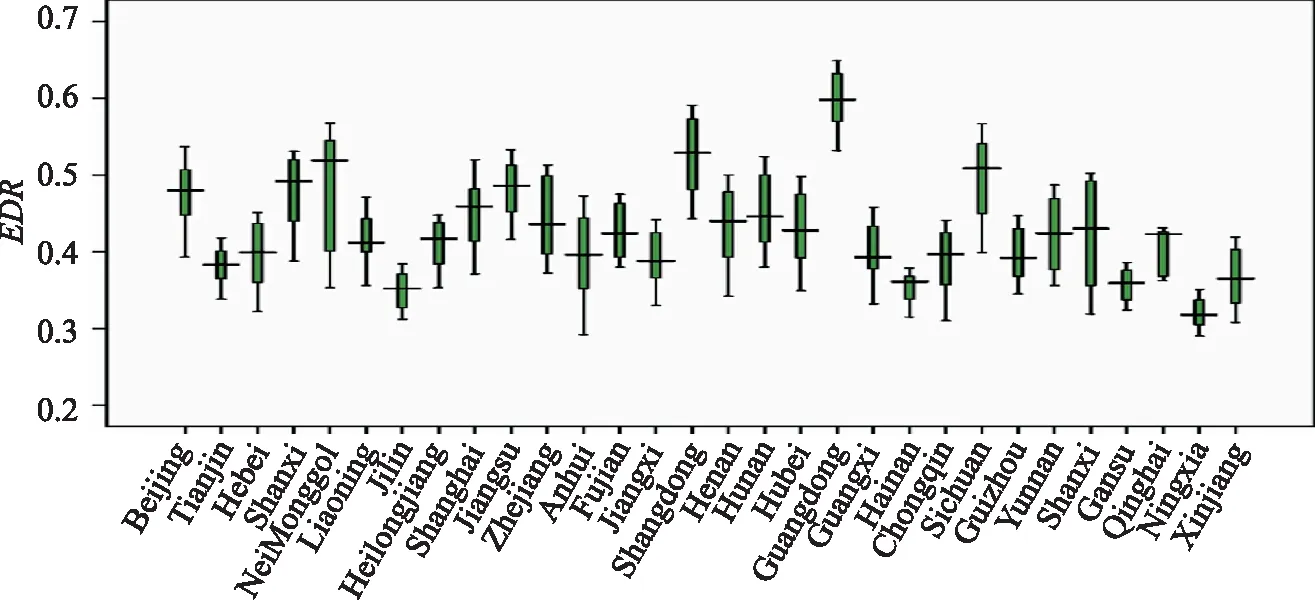
Fig.4 EDR of provinces in China
According to geographical location, the chosen China’s provinces are divided into three regions: the East(Beijing, Tianjin, Hebei, Liaoning, Shanghai, Jiangsu, Zhejiang, Fujian, Shandong, Guangdong, Guangxi, and Hainan), the Middle (Shanxi, Inner Mongolia, Jilin, Heilongjiang, Anhui, Jiangsu, Henan, Hunan, and Hubei) and the West (Chongqing, Sichuan, Guizhou, Yunnan, Shaanxi, Gansu, Qinghai, Ningxia, and Xinjiang). Based on the entropy weight and TOPSIS methods, theEDRof these 30 provinces in China from 2005 to 2017 are calculated. In order to reflect the characteristics of temporal variation, the corresponding East-Middle-West line chart, provincial line chart, and box map are drawn (Figure 2, Figure 3, Figure 4).
Fig.2 shows that resilience values in the Eastern region increased steadily before 2013 and then more stably. The average resilience value was 0.445, and the overall resilience value gradually increased from 0.381 in 2005 to 0.492 in 2017, with an average annual growth rate of 1.98%. The resilience value of the Middle region increased slightly before 2016 and then remained stable. The resilience value increased from 0.346 in the initial stage to 0.480 in the final stage, with an average annual growth rate of 2.56%. The resilience value of the Western region maintained steady growth with a minimum value of 0.335 in 2005 and a maximum value of 0.446 in 2017, and with an average annual growth rate of 2.22%. It can be seen that the overall resilience value in the Eastern region is high, mainly due to the dual advantages of location and economy, strong scientific and technological innovation strength, intensive and low-carbon development of economic regions; although the Middle and Western regions are limited by natural factors and historical conditions, their starting points are not high, and there is still a gap compared with the resilience level of the Eastern region; however, the Middle and Western regions focused on high-quality economic development and increased investment in science, technology, and environmental protection, andEDRgrew rapidly in the later stage. For both the Western and Middle regions, the average annual growth rate is higher than in the Eastern region.
Fig.3 shows that theEDRvalue of most provinces has continued to fluctuate mildly in the resilience transition interval (0.4-0.6) in recent years, indicating that theEDRwas in the transition period. However, there are some exceptions. Guangdong province maintains the highestEDR(above 0.6), proving that its system resilience is good. In some regions (e.g., Ningxia, Hainan, and Jilin), theEDRwithin the range of poor resilience is still low (below 0.4), so effective countermeasures should be taken.
Fig.4 shows that the resilience values of all provinces have improved to varying degrees over the past 13 years, but the resilience differences among provinces are significant. Taking the median as a reference, the maximum resilience value of Guangdong is 0.598 and the minimum resilience value of Ningxia is 0.318. It can be seen that theEDRin Guangdong province is at a good level. In terms of the progress of improvement, the average annual growth rate of the resilience level in Anhui province is 3.78%, much higher than in other provinces, mainly because Anhui’s economic subsystem has grown rapidly, driving the rapid growth of the resilience level of the whole system. The average annual growth rate of the resilience level in Liaoning province is the lowest, at 1.13%, mainly because its energy subsystem did not rise and its resilience value only increased by 0.056. The optimization progress ofEDRthus lags behind.
3.2 Spatial analysis of EDR
According to the temporal variation ofEDRin China, the years 2005, 2010, and 2017 were selected as representative time nodes based on the measurement ofEDRaccording to the resilience classification standard (Table 2); the corresponding spatial type distribution map ofEDRis drawn by the software Arcgis 10.8. The spatial distributions of the EDRs’ tendencies are shown in Fig.5.
Fig.5 shows that the resilience state of 3E systems belongs to five grades during the study period: moderate unresilience, slight unresilience, approaching unresilience, approaching resilience, slight resilience. There are no provinces with high resilience or favorable resilience. In 2005, the regional benefits of provinces with different resilience levels in spatial distribution were not significant. Among them, 25 provinces were in the state of slight unresilience, accounting for 83.3% of the total; Anhui and Ningxia were in the state of moderate unresilience, and only Guangdong was in the state of approaching resilience. In 2010, there were 14 provinces with slight unresilience, accounting for 46.7%; 13 provinces rose from the state of slight unresilience to approaching unresilience, 14 provinces were in the state of approaching unresilience, Shandong jumped from the state of approaching unresilience to approaching resilience, and 2 provinces were in the state of approaching resilience, accounting for 6.7% of the total. In 2017, provinces with different resilience levels showed significant zonal effects in spatial distribution; the overall resilience level showed a spatial pattern wherein the East was better than the Middle and Western regions. Among them, only Jilin, Hainan, Gansu, and Ningxia were in a state of slight unresilience, 10 provinces rose from the level of approaching unresilience to approaching resilience, and 11 provinces were in the state of approaching resilience, accounting for 36.7%; Guangdong province was in a state of slight resilience. It can be seen from the spatial distribution ofEDRthat the number of provinces with slight and moderate unresilience gradually decreases, while the number of provinces with approaching resilience continues to increase. At present, the overall resilience level is in the key stage of transition from low and medium levels to medium and high levels.

注:基于自然资源部地图技术审查中心标准地图服务网站的标准地图 (审图号:GS(2019)1697 号) 绘制,底图无修改。Note: The figure is drawn based on the standard map of the service website of Map Technology Review Center of the Ministry of natural resources (drawing review No: GS (2019) No. 1697), the basemap has not been modified. Fig.5 Spatial variations of EDR
3.3 Spatial variogram analysis of EDR
Gaussian, exponential, sphere, and linear models are used to fit the variable data and the model with the highest goodness of fit is selected. The sampling step is 28.64 km when the goodness of fit is optimal, so the sampling step is uniformly defined as 28.64 km. The fitting parameters of variogram in each year are calculated according to Formula 14, the details are shown in Table 3, and then Kriging interpolation is used to analyze the difference characteristics and distribution form ofEDRamong provinces. The interpolation results are visually expressed in 3D using Surfer software. The results are shown in Fig.6.
The fitting results show that the sill value and nugget value fluctuated and rose during the study period, indicating that the spatial variation degree ofEDRis increasing. The change of nugget coefficient can be divided into two stages, from 0.998 in 2005 to 0.77 in 2008, indicating that the spatial difference caused by the randomness of variables is decreasing and the structural difference caused by spatial autocorrelation is more and more obvious. After 2009 it showed an upward trend, indicating that the spatial autocorrelation ofEDRwas weakened and the heterogeneity was enhanced. The range reflects the spatial correlation distance ofEDRaccording to the evolution trend and it can be roughly divided into three stages. From 2005 to 2011 the range showed an upward trend, indicating that the spatial relationship ofEDRwas continuously strengthened, and the correlation effect ofEDRhad a wide impact on its surrounding areas. From 2012 to 2015 it showed a fluctuating decline, indicating that the radiation range of the spatial correlation effect ofEDRreduced and the radiation effect in high-level areas decreased. From 2016 to 2017 the range increased from 77.37 to 86.10, indicating that the regional agglomeration characteristics of high-level areas at this stage are significant. From the optimal fitting model selected by the spatial variation function, it can be seen that the models selected under different times are different, indicating that theEDRpresents different structural characteristics in different periods.

Tab.3 Fitting parameters of spatial variation function of EDR
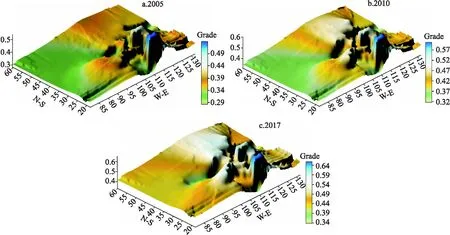
Fig.6 Kriging interpolation simulation of EDR in 2005, 2010, and 2017
Fig. 6 shows that theEDRevolution in the chosen China’s provinces has a certain continuity and regularity and that the characteristics of spatial differentiation are significant. On the whole, it presents a spatial evolution pattern of “East > Middle > West.” This is mainly reflected in the fact that the eastern region formed an obvious “peak” structure with Guangdong province as the core in 2005, while the “peak column” in the Western region was relatively low and flat, indicating that theEDRin the Eastern region was high while the resilience development in the Middle and Western regions was relatively balanced. In 2010, the “peak” structure represented by Nei Monggol began to appear in the Middle region. The Western region formed a “low valley” centered on Ningxia, which shows that Nei Monggol in the middle region has begun to show the growth status of resilience levels and the high-level regions show the characteristics of agglomeration distribution. In 2017, the Eastern region had a double “peak column” structure with Guangdong and Shandong as the high points, while the Western region had obvious characteristics in the “valley” areas with Ningxia and Gansu as the center, indicating that the difference inEDRhas gradually widened.
3.4 Temporal and spatial prediction of EDR
In order to explore EDR’s possible future tendencies so as to take targeted measures, this study further analyzes its future spatial characteristics and temporal tendency by using theGM(1,1) model. All provinces meet the requirements of theGM(1,1) model based on an accuracy test. It is proved that the model is accurate and can be used for prediction. Fig. 7 shows the predicted trends ofEDRin each province for the next five years. TheEDRin most provinces maintains the same trend, that is, 10 provinces will remain relatively stable in their future resilience level and the rest will improve. However, on the whole, the fluctuation of provinces is minor. This tendency is consistent with the performances in previous years and is reliable for making corresponding countermeasures. For the province with upgradedEDR(such as Nei Monggol), it is a positive expectation which proves that the stimulus policies of energy, economy, and environment have achieved good synergy, the ability to deal with external risks has been improved, and resilience has been better optimized.

Fig.7 Temporal fluctuation of EDR
Tendencies in spatial distribution of EDRs are shown in Fig.8. Projections indicate that the Middle and the East will remain the dominant regions of resilience, while the development of the Western region remains relatively slow. This trend is the same as in previous years. However, there is another trend indicating that the resilience gap between regions will be slightly larger than that in 2005. Specifically, the resilience value of Ningxia in 2022 is 0.382, while Guangdong province is 0.716. From the regional perspective, the middle and Eastern regions generally maintain a benign development trend while most of the Western regions maintain their current levels; this difference will become greater with time. It can be seen that corresponding measures should be taken from both the regional and national strategic perspectives to decrease imbalance among regions.

注:基于自然资源部地图技术审查中心标准地图服务网站的标准地图 (审图号:GS(2019)1697 号) 绘制,底图无修改。Note: The figure is drawn based on the standard map of the service website of Map Technology Review Center of the Ministry of natural resources (drawing review No: GS (2019) No. 1697), the basemap has not been modified. Fig.8 Spatial variations of EDR
4 Conclusions
The overall resilience state of 3E systems is developing in a positive direction but still has great potential for improvement. Temporally, theEDRof most regions maintains a steady upward trend with small fluctuations. Spatially, the degree of spatial variation of resilience continues to increase; on the whole, it presents the spatial evolution pattern of “East>Middle>West”. Predictions show that theEDRtrend of most regions will have temporal similarities with the previous years, while the trend of spatial transformation will be different and the gap ofEDRwill be enlarged for the next five years.
