Objective Quantification of Small Motor Sound Quality Based on Psychoacoustic Metrics
2022-04-29TaoHuangZhienLiuBinyuZhangJinyanBiLipinXie
Tao Huang, Zhi’en Liu, Binyu Zhang, Jinyan Bi, Lipin Xie
Abstract: With the widespread application of electrification and intelligence of automobiles, the number of electric devices with small DC motors in automobiles has gradually increased, and the interior of electric vehicles is quieter. The sound quality (SQ) of small motor directly affects the passenger experience. Therefore, the research on the SQ of small motor is of great significance. In this paper, the objective quantification of small motor sound quality was investigated based on traditional psychoacoustic metrics. The time-frequency characteristics of sound signal was analyzed to quantify the subjective perception caused by the sound of small motor. And a new psychoacoustic metrics of objective evaluation which were suitable for small motor SQ evaluation were proposed,namely specific loudness energy (SLE), specific prominence ratio index (SPRI), relative pitch exceedance (RPE) and tremolo index (TI). Then, two objective evaluation models of small motor SQ were established to characterize the multi-dimensional subjective perception attributes by using multiple linear regression (MLR) and support vector regression (SVR) respectively, which can be used for the prediction and evaluation of the small motor SQ. The results show that the prediction accuracy of the model established by SVR method was higher than that of MLR, and SVR has stronger robustness. The objective evaluation model of small motors SQ established in this study is of great importance for improving the sound quality of small motors.
Keywords: motor sound quality; subjective evaluation; psychoacoustic metrics; support vector regression (SVR)
1 Introduction
Nowadays, electrification and intelligence are the core development direction of the automotive industry, where most of the power for various electric devices are derived from motors. The power for various electrical accessories in automobiles were provided by small DC motors [1–2]. The performance of such motors directly affects the experience of electric devices, of which the motor noise is the most easily felt by people. And with the gradual popularization of electric vehicles,quieter inside the car, people are more and more sensitive to the noise in the car, when this kind of small motor sound quality (SQ) is poor, easy to directly cause people subjective sense of annoyance [3–5]. To improve the SQ of motor, you first need to clarify how to evaluate it. Therefore,the study of subjective evaluation and objective quantification methods for the SQ of such small motors is of great importance.
In recent years, there have been many studies dedicated to small DC motor noise control[6–7]. The following few studies focus on motor vibration and noise reduction. J Zhou et al. [8]described the control of motor noise and vibration from two aspects of motor design and process. Through the analysis of motor noise and vibration generation mechanism, the control measures of noise reduction are clarified. Y T Cho et al. [9] reconstructed the mass velocity of a motor by measuring the near-field acoustic pressure data of a small DC motor operating condition,which can be used for motor noise source identification in a very wide frequency range. M Jafar et al. [10] effectively reduced the motor vibration noise by increasing the DC motor stator intrinsic frequency to eliminate the serious effect of structural resonance. A combination of response surface method and finite element modal analysis was used to optimize the stator slot parameters to achieve noise optimization without increasing the weight of the motor. H B Huang et al.[11] proposed a noise source identification method based on interval analysis in order to improve the interior sound quality of pure electric vehicles. Based on the interval analysis method,the feasible intervals and noise source contributions of suspension structure noise were calculated, and the front spring and rear damper are identified as the main sources of suspension structure noise to achieve noise source identification.
However, with the silencing of electric vehicles, the demand for electric vehicles is no longer limited to the sound level of the small motor running noise, but is more focused on the quality of the running sound. To improve the SQ of motor, you first need to clarify how to evaluate it. To establish an objective quantification model of the subjective perception of small motor SQ, two aspects need to be focused on, the objective quantification parameters of SQ and the model building method [12–13].
Currently, there are many studies on the objective quantification of the subjective perception of SQ, including the SQ of motors and the SQ of other research objects. R Dragonetti et al.[14] conducted a motor SQ study on inexpensive DC motors by the psychoacoustic pairwise comparison method, and the results showed that the motor SQ was strongly correlated with the harmonics in the motor spectrum, and proposed to use the objective parameters roughness and pitch to describe the motor SQ. G Volandri et al. [15]completed the subjective evaluation and objective parametric analysis of the SQ of power windows motors, and the results showed that the objective quantified parameters of SQ, loudness,sharpness, and steadiness of the electric motor,were strongly correlated with the subjective evaluation results. Objective quantitative parameter analysis of motor SQ has a number of applications not only in the automotive industry but also in the home appliance industry [16–17]. S K Kyung et al. [18] studied the SQ of five home refrigerators in operation. The correlation analysis of the subjective and objective results showed that the underlying psychological objective parameters, sharpness, roughness and fluctuation strength, did not correlate well with the subjective evaluation results, and only loudness had a high correlation coefficient. S D Loreto et al. [19]studied the noise of home appliance range hoods,calculated the psychoacoustic index, and proposed a SQ index of range hoods to achieve an objective evaluation of the sound comfort of range hoods. The study of objective quantification of sound quality, in addition to the motor noise as the research object, there are other research objects, including automobile acceleration sound quality [20–21], engine sound quality [22],transient door closing sound quality [23– 24],physio-acoustic sound quality [25] and so on.These studies are all aimed at specific acoustic characteristics, corresponding to the proposed applicable SQ objective parameters.
On the other hand, there are many studies on the methods of building objective prediction model for SQ. A review of the existing research results shows that the mainstream objective quantification methods for SQ can be categorized into three types: multiple linear regression(MLR), neural networks, and support vector machines (SVM). M P Poveda et al. [26] developed a SQ prediction model for small DC motors using a MLR method based on traditional objective parameters of SQ. J H Park et al. [27] measured the engine sound when the car throttle was fully open, calculated the psychoacoustic parameters by filter modulation, and used a MLR method to develop a predictive model of engine motion sense SQ reflecting differences in evaluators’ tastes. K Qian et al. [28] used a traditional physical acoustic parameter and six psychoacoustic parameters for objective quantitative evaluation of in-vehicle SQ, and used MLR method to establish a SQ prediction model through correlation analysis of objective parameters and subjective evaluation results. C Hha et al. [29] proposed a quantitative prediction method for PEV nonsmooth interior SQ based on speed tracking psychoacoustic measurements and deep convolutional neural networks with adaptive learning rate trees for electric vehicle motors. H B Huang et al.[30] proposed a new intelligent acoustic model based on deep neural networks, called Laplace Scoring Deep Belief Network (LSDBN), and used LSDBN to evaluate the interior SQ of electric vehicles. Y L Lin et al. [31] proposes a multi-feature combination process to evaluate the vehicle impact noise caused by speed bumps. An intelligent prediction method, support vector machine is used to model the impulsive acoustic prediction of impact noise, and the results show that the combined multi-features of noise samples can be used to estimate the impact of impact noise.Y Tao et al. [32] proposed the modified simulated annealing method (SAM) to optimize the SVR prediction model, and the results show that the MSA algorithm has strong global optimization capability, good robustness, and short computational consumption, which can effectively improve the prediction accuracy and stability of air conditioning load prediction.
On the whole, there are several shortcomings in the current research on objective prediction models for the SQ of small DC motors.First, most of the current research are focused on the study of objective parameters of acceleration SQ of automobile drive motors, but there is no objective psychological parameter to describe the SQ of small DC motor, and the applicability of the existing traditional psychological parameters is not high. Second, there are limitations in the current prediction method of MLR. For the parameters with low correlation coefficients, the robustness of the MLR prediction model is poor.For prediction models using neural network deep learning algorithms, a large number of training samples were required to maintain accuracy, and for small samples are prone to overfitting and local optimality problems.
Therefore, the SQ of small DC motor are taken as the research object in this paper to systematically and comprehensively reveal the evaluation method and process from the four dimensions of subjective perceptions. Then, the new objective metrics of advanced psychoacoustic suitable for small DC motor were proposed,which can be used to evaluate the SQ of small motor. Finally,the SQ prediction model of small motor was established to objectively quantify the subjective perception based on the proposed psychoacoustic evaluation metrics by MLR and SVR model, which are suitable for the objective quantification of the SQ of small motor with small sample data set, and the prediction accuracy and the robustness of the two modeling methods were also compared.
The paper is structured as follows. In Section 2, the objective data testing of small motor operation sound, subjective evaluation of SQ and validity check of evaluation results were introduced. In Section 3, the proposed method of new SQ objective evaluation parameters, the principle of objective parameter calculation, and the analysis and discussion of new parameters and traditional parameters were described. In Section 4, based on the newly proposed objective parameters, the SQ prediction models using MLR and SVR methods were established respectively,and the accuracy and robustness of the prediction models were discussed and analyzed. Finally,conclusions were given based on the results of the study.
2 Measurement and Subjective Evaluation
2.1 Motor Sound Signal Recording
The running sound test of automobile wiper motor were carried out in the semi-anechoic room,and 25 data samples of vehicle interior sound of wiper motor were obtained. The 25 motor sound samples are testing the wiper operation sound of 25 prototype cars. The selection principles for the test vehicles included covering high and low SQ scores, selecting vehicles that sell well in the market, and covering Sedan, SUV and MPV.
The test method of wiper motor operation sound refers to the national standard for measurement of noise inside motor vehicles (GB/T 18697). The sound signal of wiper motor was collected through digital binaural head (HMS IV.0)and sound signal acquisition system (B&K 4100). The digital binaural head was placed at the driver’s position to measure the driver’s binaural sound, as shown in Fig. 1. The sampling frequency of the acquisition system for the sound signal was set to 25.6 kHz. The test condition is to remove the wiper arm and blade, eliminate the contact sound between the blade and the glass.The stable 13.5 V voltage was provided through the regulated power supply to drive the wiper motor. The binaural sound signal is collected at the driver’s position in the vehicle during the operation of the wiper motor. Each sample wiper sound sample three groups of test data to ensure high consistency. During the test, there is no other noise interference in the vehicle.
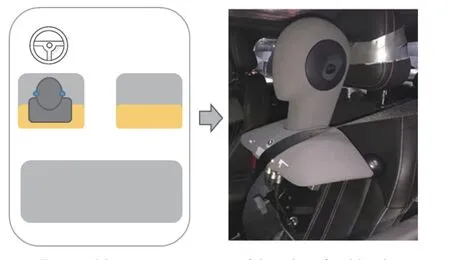
Fig. 1 Measurement position of digital artificial head
2.2 Subjective Evaluation
Through the organization of the motor SQ subjective evaluation test, the motor SQ subjective evaluation results were obtained. Subjective evaluation test in the SQ evaluation laboratory,through high-fidelity headphones (Sennheiser HD600) playback, low-frequency part of the Head Acoustic Subwoofer speaker compensation,calibrated playback equipment frequency response, to ensure the authenticity of playback,the sound quality playback system frequency response calibration results are shown in Fig. 2. As can be seen in Fig. 2, the frequency response curves of the measurement and the jury room are consistent, proving the validity of the jury room evaluation.
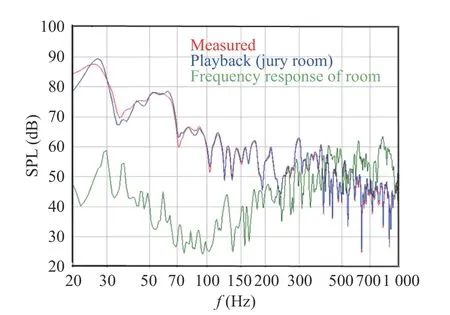
Fig. 2 Playback of system calibration results
The frequency response of the playback equipment was calibrated to ensure the authenticity of playback, as shown in Fig. 3. The evaluation environment ensures that there is no other noise interference, and the ambient temperature,lighting and other conditions were comfortable.

Fig. 3 Sound quality evaluation laboratory
The test object of subjective evaluation are 25 noise samples of small motor which collected by the digital binaural head, and the samples with the same duration of 6 s were intercepted for subjective evaluation. The experiment considered different age, gender, occupation and evaluation experience. Finally, 20 evaluators were selected to form a jury and trained before evaluation. The characteristic distribution of evaluators is shown in Fig. 4.
Subjective evaluation training for evaluators before evaluation, first inform the evaluators of the criteria for evaluating good or bad wiper motor sound quality, then try to listen to each characteristic sample, such as the motor sound apparent subjective listening sensation is how, and finally through the training of the evaluators and then subjective evaluation test. The more commonly used subjective evaluation methods include, the rating scale method, semantic segmentation method and pairwise comparison method, considering that there are 25 samples in this time. If pairwise comparison method and semantic segmentation method are used, it leads to too much evaluation workload, and the evaluators are easily exhausted, resulting in unreliable evaluation results. In this paper, subjective evaluation was performed using a ten-point rating scale, and the evaluator listens to the sample sounds through headphones and external speakers. The computer was operated for evaluation,and the order of sound sample playback evaluation can be randomized. The evaluation interface is shown in Fig. 5.
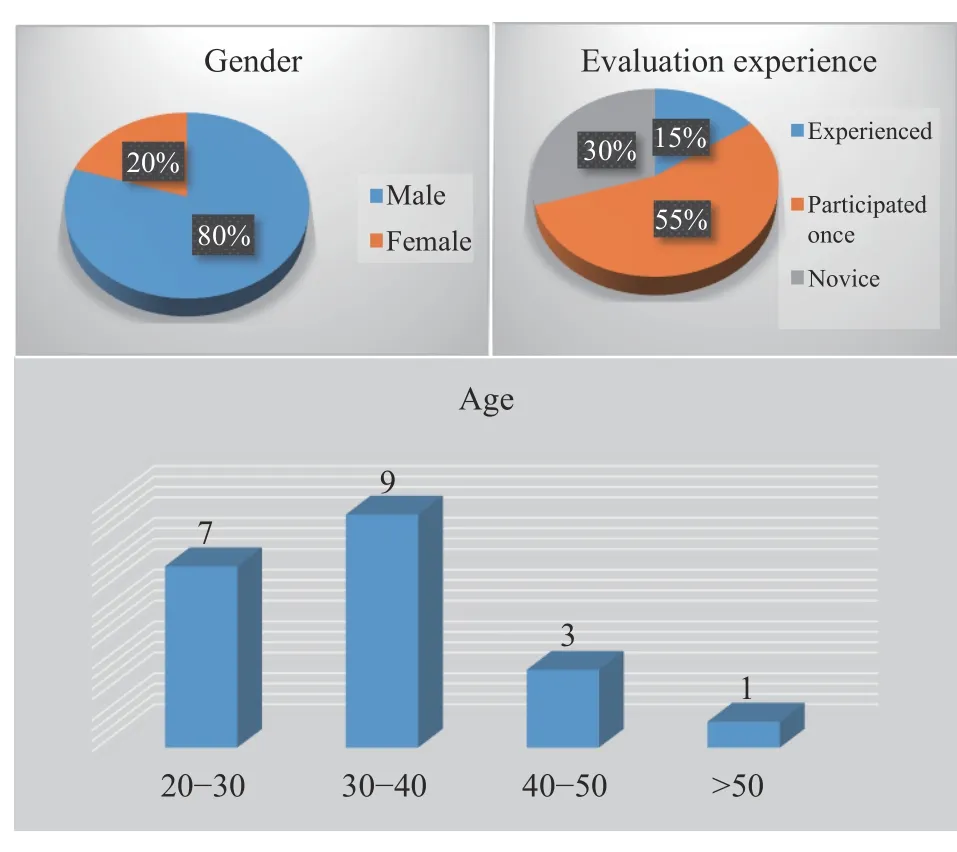
Fig. 4 Jury distribution characteristics
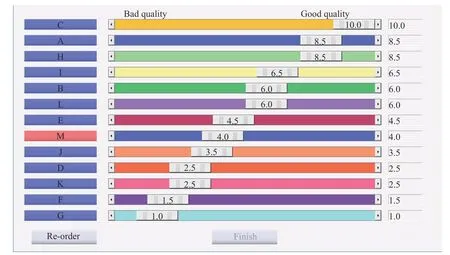
Fig. 5 Subjective evaluation interface of SQ
2.3 Evaluation Data Validation
For the subjective evaluation results of motor SQ, the reliability and validity of the data were tested to eliminate unreasonable data and ensure the validity of the evaluation results. Firstly,based on the interquartile range method [33] to eliminate the data outside the valid interval, as shown in Fig. 6.

Fig. 6 The interquartile range
Then the data validity test was conducted by calculating the person coefficient among the jury, and the closer the coefficient is to 1.0, the higher the consistency among the evaluators, and the Pearson coefficient matrix of the results of this subjective evaluation is shown in Fig. 7.From the Pearson coefficient matrix, it can be seen that correlation coefficients above 0.6 account for the vast majority, so it can be judged that there is a strong consistency among the jury on the evaluation results of the sample.
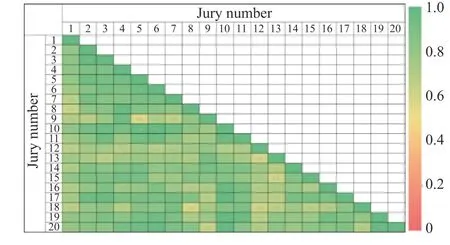
Fig. 7 Pearson correlation coefficient of the jury
In addition, the Kendall concordance coefficient is also calculated for data validity test,which is often used to judge the consistency of evaluation results ofKobjects byNevaluators,and when the Kendall concordance coefficient satisfies the significance test, the results of each evaluator on the evaluated objects can be considered to be consistent, which is calculated as
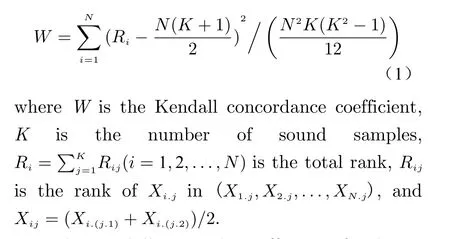
The Kendall concorde coefficient of subjective evaluation data was calculated, based on the above formula. There were 25 evaluation samples and 20 evaluators. The Kendall concordance coefficientWwas 0.67, which is greater than 0.6. It is necessary to check whether the evaluator ’s scoring results are significantly consistent(a=0.01).

According to Eq. (2),χ2is 254.8, which was obtained by chi-square table,(N −1)=36.91<254.8, which shows that the evaluation results have significant consistency.
In summary, the data validity test of the subjective evaluation results shows that the subjective evaluation results of the small motor SQ are valid. This subjective evaluation result can be used for the subsequent objective quantitative analysis of small motor SQ.
3 Advanced Psychoacoustic Metrics
3.1 Psychoacoustic Metrics Analysis
Human perception of sound subjectively depends on people’s own psychological and physiological states, as well as the time-frequency acoustical characteristics of sound. The actual human perception of sound cannot be fully quantified by the acoustic characteristics of the sound signal alone, so psychoacoustics research is needed [34].Psychoacoustics, that is, the way the human brain interprets sound, the acoustic characteristics perceived by the human ear are not equivalent to the emission characteristics of sound waves, which need to pass through the human auditory perception system, where sound waves enter the ear canal, eardrum, and cochlea in turn, generating nerve cell impulses, which are then transmitted to the nerve center of the brain to produce auditory perception [35].
The wiper motor operation sound in the car was obtained by referring to the test in Section 2.1. Through the preliminary analysis of the Fourier transform of the sound signal spectrum,as shown in Fig. 8, indicates that the sound spectrum characteristics of the wiper such small motor is concentrated in the frequency range of 200–2 000 Hz, manifested as a single or multiple harmonics of the high and medium frequency sound spectrum composition, subjective listening sensory performance as whistling sound.
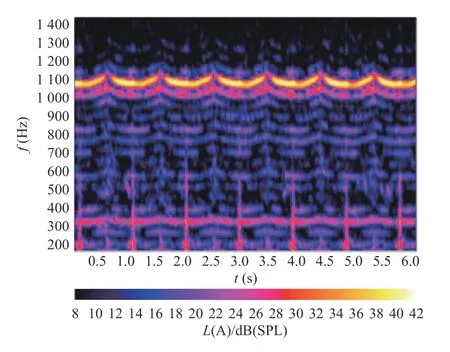
Fig. 8 Sound spectrum of wiper motor in the car
According to the wiper motor operation sound characteristics and subjective perception,an attempt was made to quantify the subjective perception of small motor SQ by means of basic psychoacoustic objective parameters. By analyzing and calculating the basic psychoacoustic objective evaluation parameters (loudness, sharpness, roughness, fluctuation, and tonality) of the small motor sound samples, and then performing correlation analysis with the subjective evaluation results, the results showed that the highest correlation coefficient between the basic parameters and the subjective results was only 0.59, as shown in Tab. 1.

Tab. 1 Correlation coefficient of subjective and objective
According to the results of the above analysis, it is clear that the basic psychoacoustic parameters are not applicable to the objective quantification of small motor SQ. Therefore, objective evaluation parameters with higher correlation coefficients with subjective perceptions need to be proposed for objective quantification of subjective perceptions of motor SQ.
The human ear perceives sound signals and then transmits them to the central nervous system to produce auditory perception. The first sensation is the loudness of the sound, followed by the frequency component of the sound signal,because different combinations of frequencies,with different sound timbre, cause completely different subjective perception. On the basis of these two dimensions, changes in the volume level of the sound are prone to cause subjective sensation of warble, while changes in the frequency components of the sound are prone to cause changes in pitch and timbre in subjective perception [36]. Therefore, in this paper, from the four dimensions of subjective perception, combined with the acoustic characteristics of small motor operation sound, advanced psychoacoustic objective evaluation parameters SLE, SPRI, RPE and TI are proposed from the four dimensions to realize the objective quantification of subjective perception of motor sound quality.
3.2 Specific Loudness Energy (SLE)
For the quantification of the magnitude of the sound magnitude of small motor operation, Section 3.1 used the objective metric loudness of basic psychoacoustics for evaluation, and the results show that the correlation coefficient was not high. This is due to the fact that the loudness of the previous paper calculates the overall loudness amplitude of the sound signal in the full frequency band at a certain moment, however, the main problem frequency band of motor sound is concentrated in the frequency range of 200–2 000 Hz, so the applicability is not enough. Therefore,this paper proposes to use the advanced psychoacoustic metric specific loudness to objectively quantify the subjective perception of the loudness of motor sound, and to quantify the overall sound magnitude by calculating the loudness of a specific frequency band.
The specific loudness (SL) was calculated by taking into account the auditory perception characteristics of the human ear and introducing a correction for the critical frequency band to calculate the sound loudness perceived by the human ear in different frequency bands, and the calculation formula is

Based on the wiper motor running sound characteristics, the specific loudness of the sound signal was calculated and used to quantify the subjective perception of the motor SQ. First, the sound signal of the steady-state operation time of the wiper motor was intercepted, and the specific loudness of the motor sound in the 24 Bark domain was calculated according to Eq. (3), and an example of the calculation result is shown in Fig. 9.
According to the motor sound specific loudness results, it can be seen that the main energy is concentrated in the 3–13 Bark range, which coincides with the main contribution frequency band of motor sound, so the advanced objective evaluation metric 3–13 Bark SLE is proposed to quantify the subjectively perceived loudness of motor sound, and the evaluation metric SLE is calculated as
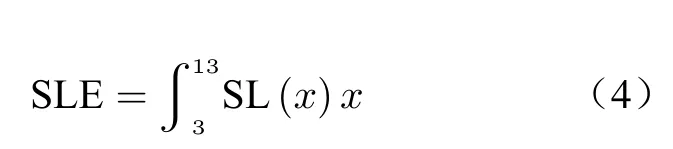
where SL is specific loudness,xis Bark number corresponding to frequency.
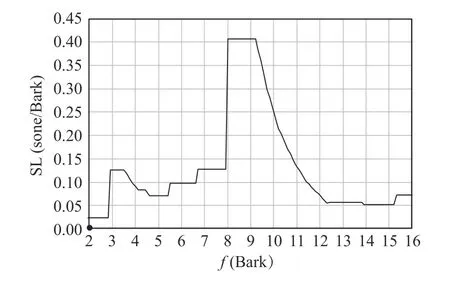
Fig. 9 Specific loudness of motor sound
3.3 Specific Prominence Ratio Index (SPRI)
The second dimension of the human ear’s auditory perception, where different frequency components lead to different hearing sensations. The more pronounced the motor whine in the sound of small motor operation, the higher the subjective annoyance and the lower the subjective rating of SQ. An attempt was made in Section 3.1 to quantify the subjective perception through the objective metric sharpness, but sharpness is an indication of the overall high-frequency component ratio of the sound, which is not applicable to the quantification of the significant degree of motor whine. Then, by analyzing the correlation between objective acoustic characteristics and subjective perception, it was found that the prominence ratio could be used to characterize the degree of motor whine sound saliency.
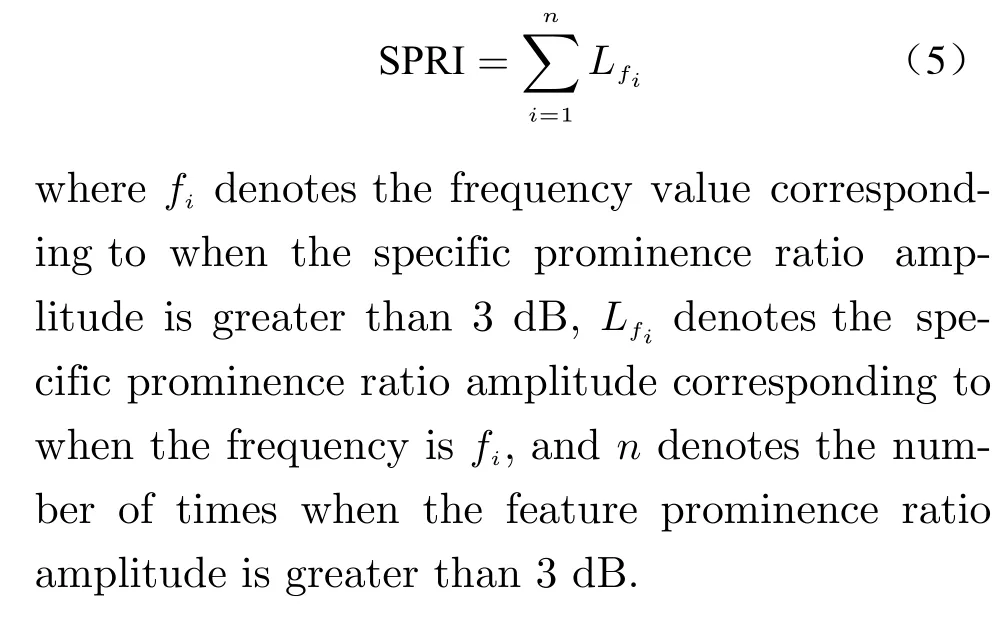
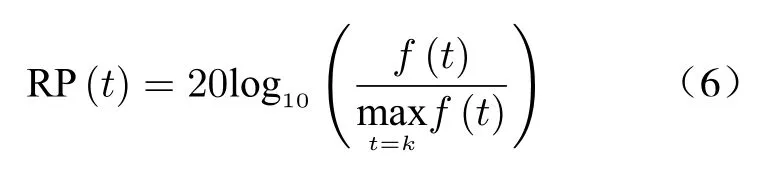
Four wiper small motor sound samples were used as examples to analyze whether the prominence ratio could be used to describe the subjective perception of motor whine sound. Among them, samples 1 and 2 have more obvious motor whine sound and low subjective scores; samples 3 and 4 basically do not feel the motor whine sound and have high subjective scores. Based on the standard ECMA-74, the four sound sample prominence ratio colormap plots were obtained by calculation, see Fig. 10.
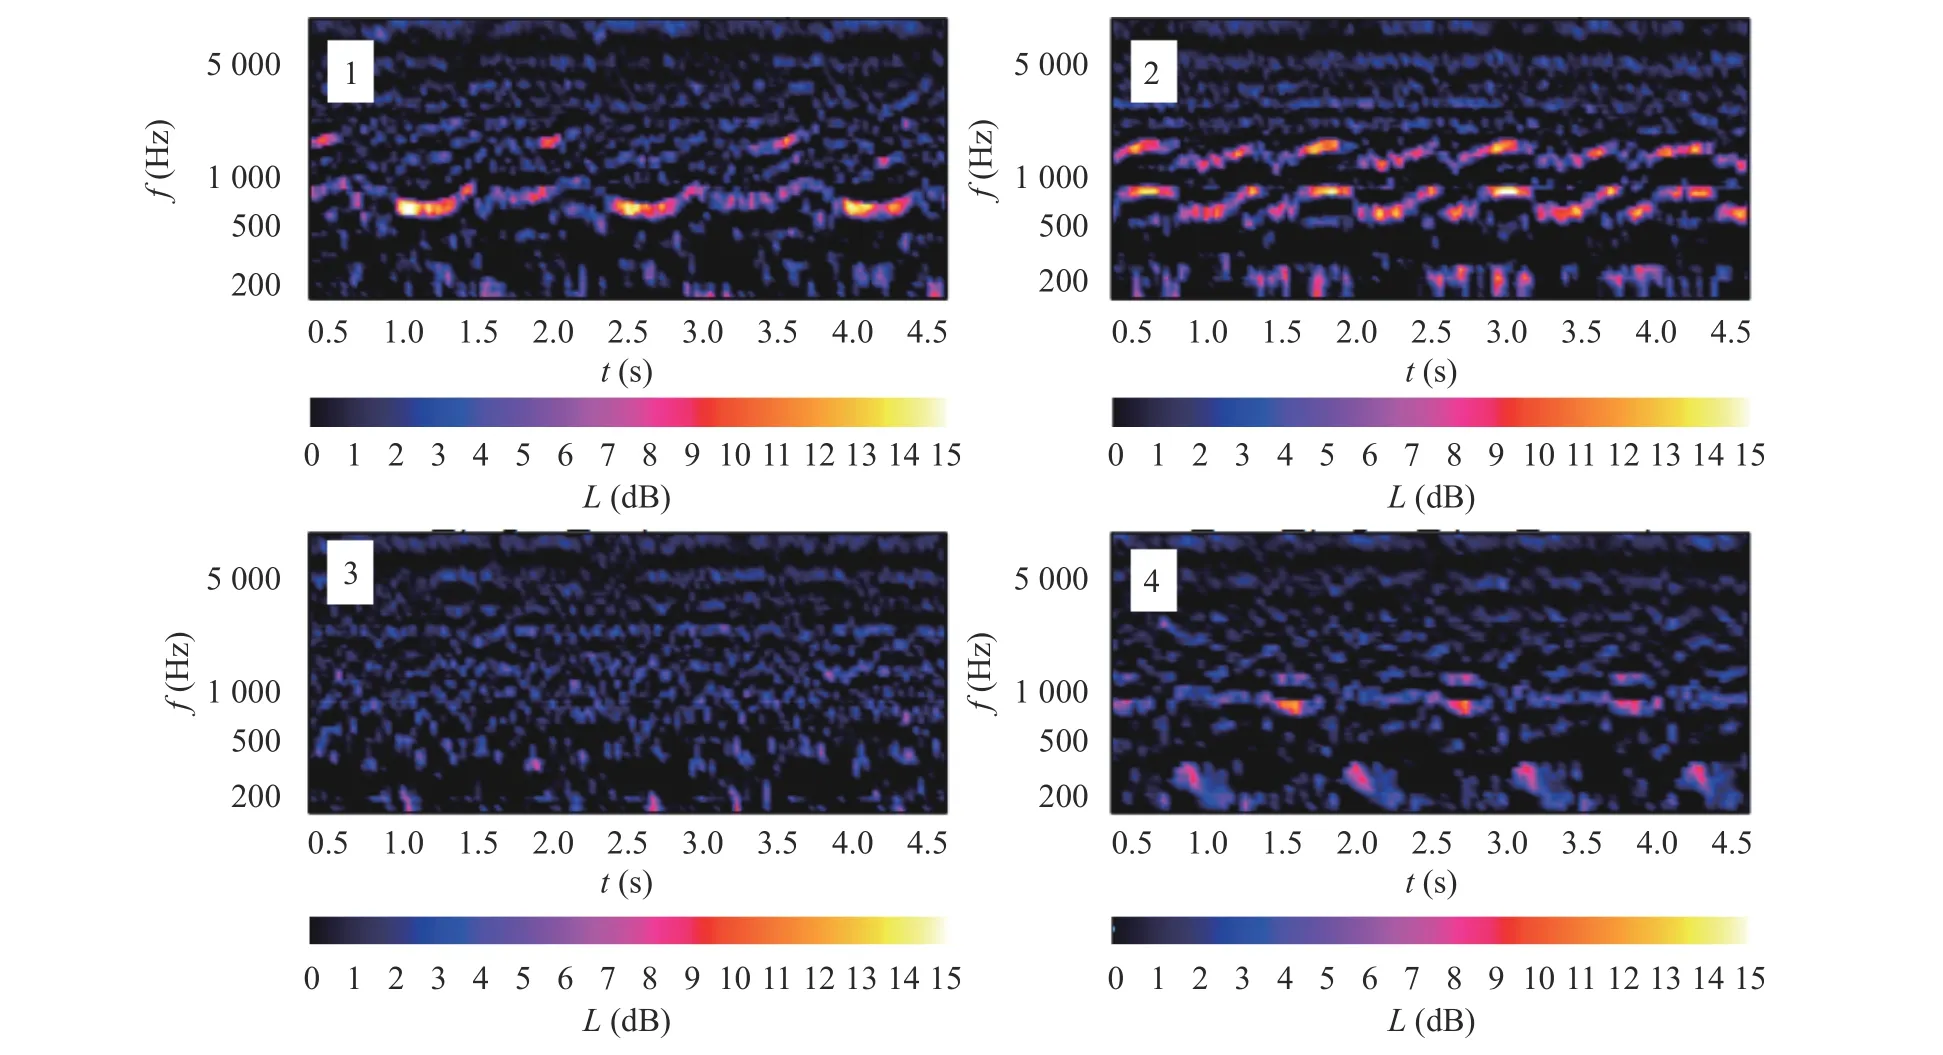
Fig. 10 Prominence ratio motor sound samples
In Fig. 10, the prominent ratio spectrograms of samples 1 and 2 showed obvious wavy bright bars, while samples 3 and 4 showed no obvious bright bars, which indicated that samples 1 and 2 appeared more prominent frequency bands,and it was speculated that when such bright bars appeared in the spectrograms, they were prone to cause subjective annoyance feelings. Further, by combining the analysis of the subjective evaluation results, the motor whine of samples 1 and 2 is obvious and the subjective annoyance is strong, and the annoyance of sample 2 is stronger than that of sample 1. Combined with the analysis of the subjective evaluation results, it is verified that this bright bar is the cause of the subjective annoyance, and it is shown that the brighter bars, the more energy, the lower the subjective rating of SQ. Therefore, an objective quantification of the obvious degree of motor whine can be achieved by quantifying the bright bar in the prominence ratio spectrogram.
In order to numerically quantify the significant degree of motor whine, the bright bars in the spectrogram need to be further parameterized.Therefore, in this study, the SPRI is proposed to achieve objective quantification of the subjective perception of motor whine. The SPRI is calculated by first calculating the specific prominence ratio curve of the sound signal in the steady-state operation section, and the sample calculation results are shown in Fig. 11.

Fig. 11 Example of specific prominence ratio
Combining the results of the subjective evaluation and the analysis of the specific prominence ratio amplitude, the results show that the motor whine can be perceived subjectively only when the specific prominence ratio amplitude is greater than 3 dB. The calculation principle of the advance objective metric SPRI is shown as
3.4 Relative Pitch Exceedance (RPE)
In addition to the above two dimensions, for the small motor steady-state operation process of the sound pitch changes too much, will also cause subjective discomfort. When the frequency of the sound changes frequently, the subjective listening sensation shows that the sound is changing its pitch, giving a subjective feeling of instability,and the greater the change in sound frequency,the worse the subjective rating. For the degree of pitch change fluctuation in the sound signal, Section 3.1 tries to use the psychological metric tonality to characterize the degree of pitch fluctuation, but the consistency with subjective is poor.
This paper proposes to use the RPE advanced objective evaluation metric to characterize the degree of pitch change fluctuation of the sound. The calculation principle of PRE is to first solve the spectrum of the steady-state acoustic signal to determine the main fluctuation frequency band of motor sound, as shown in Fig.12.
Then the highlighted wavy spectral lines in the spectrogram are extracted to obtain a curve with the horizontal coordinate as time and the vertical coordinate as frequency value. Finally,the relative pitch curve is obtained by calculating according to
wheref(t) is the frequency value corresponding to momentt, andkis the moment wheref(t) is the maximum value. The relative pitch curve calculated by Eq. (6) is shown in Fig. 13.
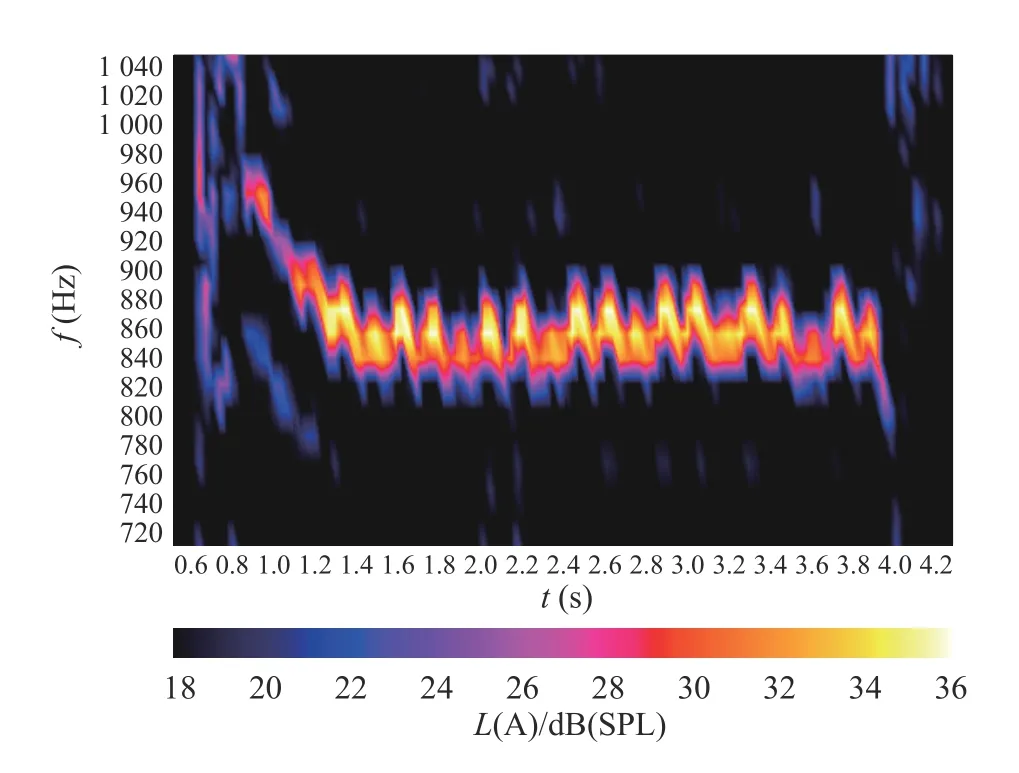
Fig. 12 Spectrum of motor sound
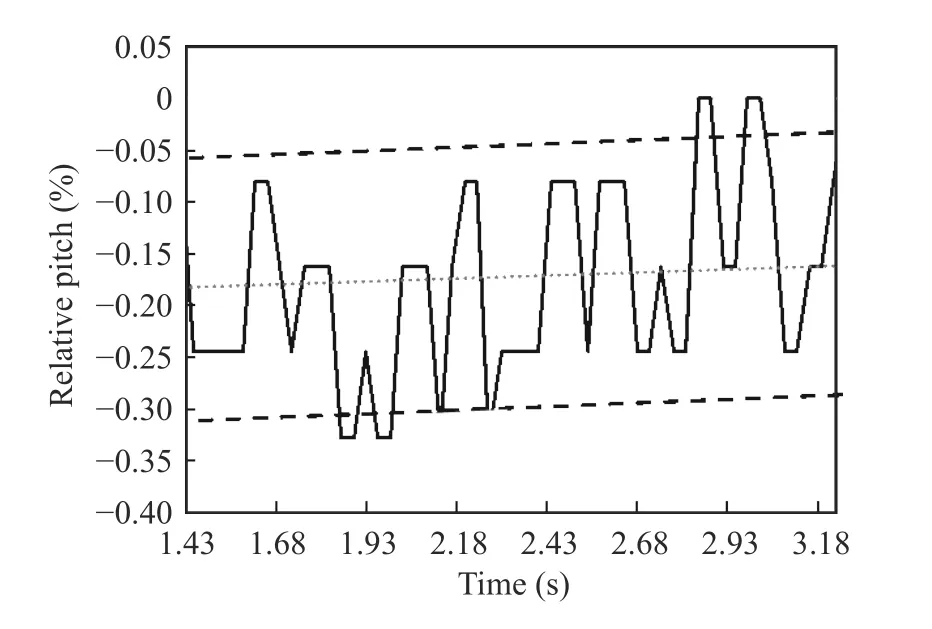
Fig. 13 Relative pitch curve of time
The solid black line in Fig. 13 represents the relative pitch at each moment, and the dotted line in the middle is a linear fit to the relative pitch curve. Based on the subjective evaluation results, a tolerance value of 0.12 is set for the relative pitch change, because only when the tolerance value is exceeded will the sound be perceived as pitch fluctuation subjectively.
According to the set tolerance value of 0.12 will fit the line to positive and negative offset,that is, the black dashed line in Fig. 13. The area between the upper and lower black dashed lines is the qualified area, and the part beyond this area is the exceeded standard. Finally, the degree of sound pitch fluctuation is quantified by calculating the number of exceeded segments.The more exceeded segments indicate the more obvious fluctuation of the subjectively perceived motor sound pitch and the lower the subjective rating. Therefore, the advanced evaluation parameter RPE is proposed to characterize the degree of motor sound pitch fluctuation.
3.5 Tremolo Index (TI)
PRE is used to describe the degree of change in sound frequency, for the subjective perception of small motor SQ, in addition to the change of tone will affect the subjective perception, the sound is suddenly large and small, that is, the change of sound amplitude, will also lead to a subjective sense of tremolo, incoherence, resulting in a low subjective rating. The psychological metrics underlying the warble degree in Section 3.1, and the subjective evaluation of the results of poor consistency, cannot effectively describe the obvious degree of this type of tremolo.
Therefore, in this paper, based on the psychological objective metric loudness, the advanced objective evaluation metric TI is proposed to reflect the fluctuation degree of the loudness change curve with time, and the relative amplitude change percentage is calculated for each fluctuation cycle, and its calculation principle is

4 Evaluation Model of Motor SQ
4.1 MLR SQ Prediction Model
Linear regression is a statistical analysis method that aims to understand whether two or more variables are correlated, the direction and strength of the correlation, and to establish a mathematical model to achieve the prediction of the dependent variable by analyzing a specific independent variable. Based on the least squares method, the loss function of multiple linear regression (MLR), the multiple linear regression equation is established and the general expression is given as
A MLR model was developed with four psychoacoustic objective metrics as independent variables and subjective ratings as dependent variables to achieve the prediction of subjective ratings of SQ by objective metrics. Before building the MLR model, the 25 motor sound samples were split into 20 regression samples and 5 validation samples. Firstly, the correlation analysis of the proposed four advanced psychoacoustic objective metrics and subjective ratings was performed with the 20 motor sound samples as the sample pool, and the correlation coefficients between objective metrics and subjective ratings were obtained, as shown in Tab. 2.
The results of the subjective-objective consistency analysis in Tab. 2 show that the newly proposed advanced objective metrics are strongly correlated with the subjective evaluation results,and the correlation coefficients are significantly higher than the basic psychoacoustic metrics by comparing with Tab. 1, which verifies the validity of the proposed advanced metrics. Through the stepwise criterion of variable input at F-test p-value ≤ 0.05 and variable removal at F-test pvalue ≥ 0.10, the root multiple linear regression modeling method was used to obtain the mathematical regression equation for the subjective evaluation of small motor SQ, shown as


Tab. 2 Subjective and objective correlation coefficient
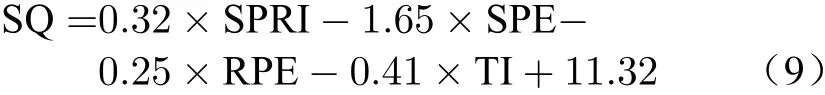
where SQ represents the subjective score of sound quality of small DC motor. The larger the value, the higher the subjective score.
As shown in Tab. 3, the correlation coefficientRof the MLR model is 0.915, and the corrected multiple judgment coefficientR2is 0.892,which is very close to 1.0, indicating that the fitting accuracy of the model is good. The tolerance of the four objective parameters is greater than 0.1, which can determine that the dependent variables are independent of each other; The Doberman Watson (DW) statistic is 1.469, closes to 2.0, indicating that the independence between residuals is well.

Tab. 3 Summary table of model parameters
According to the normal probability P-P diagram of the regression standardized residual,as shown in Fig. 14, the cumulative probability of the estimated value of the evaluation model of small motor SQ shows a linear trend with the scatter diagram of the real value of the sample.In conclusion, the established SQ prediction model can effectively realize the objective numerical quantification of subjective feeling of SQ of small DC motor.

Fig. 14 Normal P-P plot of regression standardized residual
4.2 SVR SQ Prediction Model
Support vectors are used in regression analysis,which is called support vector regression (SVR).SVR is compared to MLR methods for the nonlinear case by using a nonlinear mapping algorithm to transform the linearly indistinguishable samples in the low-dimensional input space into a high-dimensional feature space to make them linearly distinguishable. SVR is based on the theory of structural risk minimization that constructs the optimal classification surface in the feature space, which enables the learner to obtain global optimization and can increase the robustness of the regression prediction model.
Here is a brief introduction to the basic principle of establishing regression prediction model by SVR. Let the sample training set beD={(x1,y1),(x2,y2),...,(xm,ym)}, wherey1=−1 ory1=1, and divide the hyperplane in the sample space, which can be described by linear equation

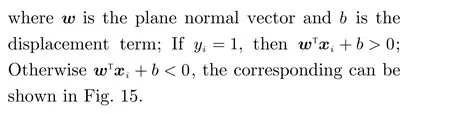
SVR expects to obtain a regression model so thatf(x)=wTx+bis as close toyas possible.By introducing ϵ-insensitive loss function (l) and relaxation variable (ξi), Lagrange multiplier(µi), Under the condition of satisfying KKT,and finally obtain the solution of SVR, shown as

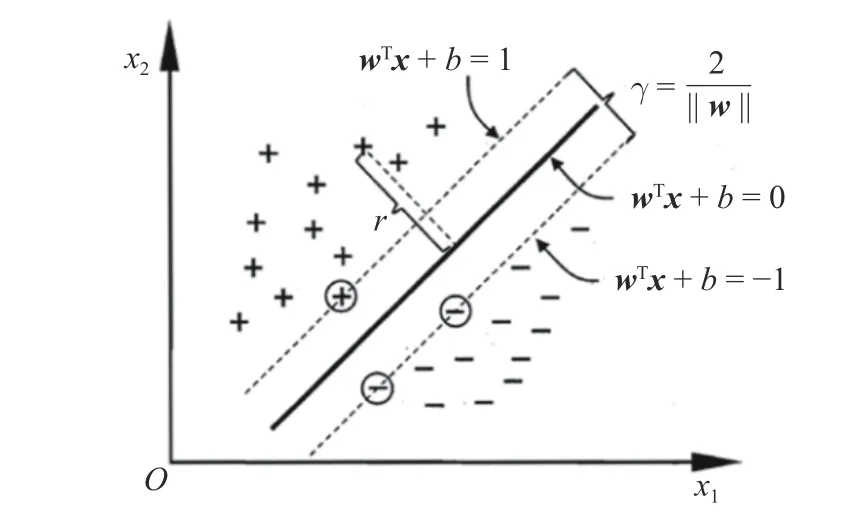
Fig. 15 Schematic diagram of SVM hyperplane
A mathematical prediction model of small motor SQ is established based on the SVR principle. Again, 20 motor sound samples are used as the training set and another 5 sound samples are taken as the test set. Where each data sample in the training set and test set, both include the independent variable objective parameters and the dependent variable subjective scores.
The sample data set was first normalized to 0-10 for subsequent analysis and calculation, and then the kernel function type was selected, and the data set was trained by SVM to seek the optimal parameters of the SVR model and establish the SVR SQ score prediction model. The model regression prediction subjective rating results are compared with the real subjective ratings as shown in Fig. 16.
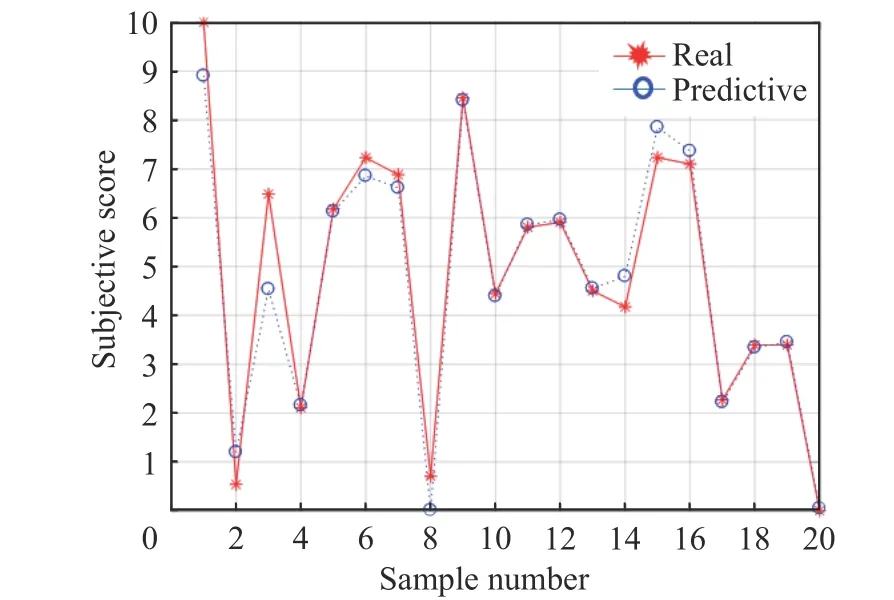
Fig. 16 Comparison of predicted value and real value of training set
Based on the analysis of the prediction model parameters, the mean square error (MSE) of the SVR prediction model was 0.014 and theR2of the linear fit was 0.954, which was very close to 1.0. This indicates that the SVR prediction model can achieve the prediction of subjective scores of SQ by the proposed objective metrics.
4.3 Prediction Model Discussion
A comparative analysis of the prediction models established by the MLR and SVR methods shows that the SVR model parameterR2is larger than MLR, which indicates that the fitting accuracy of the SVR prediction model is higher than the prediction accuracy of the MLR model. Further comparison and analysis of mean square error and maximum relative error showed that the mean square error of SVR model was only 0.014,which was much smaller than 0.592 of MLR,therefore, it can be considered that the prediction accuracy of SVR for subjective scores of small motors was higher than that of MLR. Specific model parameters comparison is shown in Tab. 4.
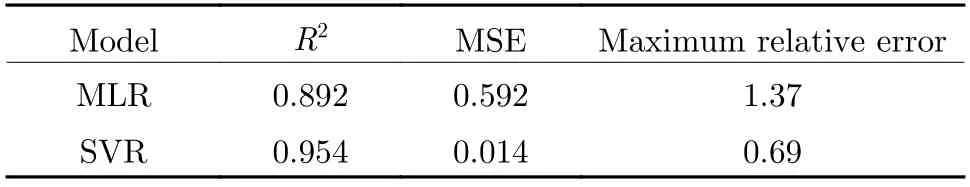
Tab. 4 Model parameters comparison
To complete the verification of the robustness of the model prediction, further analysis was performed to verify the prediction accuracy of the MLR and SVR prediction models, for data other than the training samples. The advanced psychoacoustic objective evaluation parameters(SLE, SPRI, RPE and TI) were calculated for the five validated sound samples divided in advance, and the MLR and SVR prediction models were applied to predict the subjective ratings of the sound samples, respectively, and the comparison of the prediction results of the two models is shown in Fig. 17.
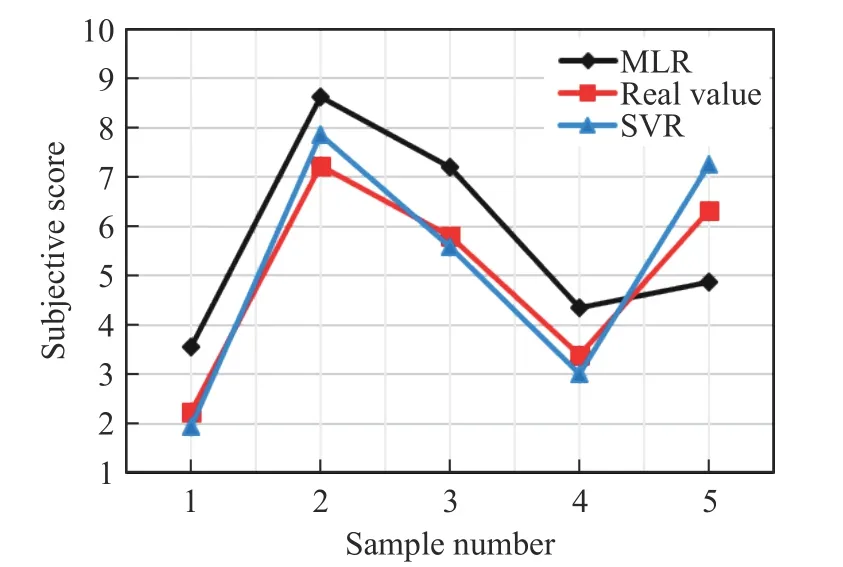
Fig. 17 Comparison of predicted and real results
As can be seen from Fig. 17, the SVR prediction scores are in full agreement with the actual subjective rating trends, and the deviation values of the score values are also much smaller than the deviation values of the MLR prediction,so it can be considered that the fit of the SVR prediction model is significantly better than that of the MLR model, and the SVR model also has very high prediction accuracy for data outside the training sample and has stronger generalization ability. That is, the SVR prediction model has stronger robustness and is more suitable for prediction model building of small sample sets.
5 Conclusions
The subjective and objective evaluation method of the SQ of small DC motor was studied in this paper with 25 wiper motor operation sound as the research object. The main goal of the current study was to evaluate and the SQ of small DC motor,and 4 advanced psychoacoustic objective metrics (SLE, SPRI, RPE and TI) that suitable for the SQ of small DC motor were proposed from four different dimensions. The subjective and objective consistency analysis shows that the correlation coefficient between the proposed metrics and the subjective evaluation result were significantly higher than the basic psychoacoustic metric, which can be used to objectively quantify the subjective score of small motor SQ. Thus, the prediction model of SQ subjective score was also established to realize the objective quantification of subjective score based on the advanced psychoacoustic objective metrics proposed, where the modeling method of SVR has higher fitting accuracy and stronger robustness and the regression coefficientR2of prediction model is up to 0.954.
In general, the analysis results show that the proposed four objective psychoacoustic parameters can effectively quantize the multi-dimensional subjective perception of the SQ of small DC motor using the constructed SVR model. And the proposed evaluation method of the SQ of small DC motor in this paper helps to guide the development of design for the small motor sound in vehicle. Further research is needed to achieve small motor SQ improvement, which include the mechanism of sound generation and controlling method of small motor should be studied to realize the forward development and design of motor SQ.
杂志排行

Journal of Beijing Institute of Technology的其它文章
- ISAR Imaging and Cross-Range Scaling Based on Image Rotation Correlation
- Jamming Monitoring Technology of the Space Situational Awareness Facilities:A Comprehensive Survey
- Fast Rail Defect Inspection Based on Half-Cycle Power Demodulation Method and FPGA Implementation
- Restoring Polarization Angle Map for High-Fidelity Underwater Imaging
- Jamming Recognition Based on Feature Fusion and Convolutional Neural Network
- Unmanned Technology-Based Civil-Military Intelligent Logistics System : From Construction to Integration