Fast Rail Defect Inspection Based on Half-Cycle Power Demodulation Method and FPGA Implementation
2022-04-29YuMiaoJiweiHuoZeLiuYingGaoChengfeiWang
Yu Miao, Jiwei Huo, Ze Liu, Ying Gao, Chengfei Wang
Abstract: In this paper, a fast-speed and real-time online rail inspection method based on half-cycle orthogonal power demodulation algorithm is proposed. For this method, the power characters of detection signal which represent the degree of rail track can be calculated using only half-cycle detection signal because of the symmetry characteristic of detected sine signal and reference signal. The theoretical analysis, simulation results and experiment results show that the demodulation precision of proposed method is almost equal to fast Fourier transform (FFT) demodulation method and orthogonal demodulation method, but has high demodulation efficiency and less FPGA resources cost. A high-speed experiment system based on three coils structured sensor is built for rail inspection experiment at a moving speed of 200 km/h. The experiment results show that proposed method is more effective for rail inspection and the time resolution of proposed method is double of classic method that based on FFT and orthogonal.
Keywords: fast speed; half-cycle power demodulation; field programmable gate array (FPGA); rail inspection
1 Introduction
Railway transportation plays an important role in economic development due to its advantage of clean, high efficiency, energy saving and low carbon emission [1]. Since a flaw in rail track is likely to cause the derailment, overturning or other security incidents, which lead to heavy casualties and huge property losses [2], railway inspection is of great significance in ensuring the safety of rail transportation. High speed, efficient rail defect detection is becoming an impending demand with the increase of operating speed and running mileage of rail transportation.
Research on rail inspection began as early as 1877 [3]. Over the past decades, there has been considerable interest in the application of non-destructive evaluation (NDE) techniques and defect detection that meet the industrial demands,which include some classic techniques, such as ultrasonic, magnetic flux leakage (MFL), visual,radiography, etc. [4−11]. Due to the advantages of non-invasive, non-contact and fast inspection speed, the inspection method based on electromagnetic has the potential for fast-speed rail inspection [12−15].
In previous electromagnetic rail inspection study, the amplitude of detection signal is generally used as the feature of rail defect and the amplitude is demodulated by using orthogonal demodulation algorithm or fast Fourier transform (FFT) algorithm, the demodulation algorithm implement in a digital processor [1−2].For these methods, defects which expressed by amplitude is not obvious enough, each demodulated amplitude needs an integer multiple of the detection signal for calculation and the real-time performance is limited. To improve the detection effect and real-time performance, in this paper, a half cycle power demodulation method based on FPGA is proposed for high-speed rail inspection to increase the effectiveness and real-time performance of inspection system.
2 The Principle and Advantage of Electromagnetic Rail Inspection by Power of Detection Signal
Because of the principle of electromagnetic induction, when an excitation coil applies alternating current near the sample, the eddy current will be induced in the rail [16]. If a defect exists in the detected rail track, the size and flow formation of eddy current will be changed, and the magnetic field intensity in the detection coil will be changed too. Thus, the defect of rail can be detected by variations of induced voltage of detection coil [17]. Fig. 1 shows the principle diagram of rail inspection when using three coils structured sensor.
When an alternative current is applied in the excitation coil and three coils structured sensor move along the movement direction as shown in Fig. 1, induced voltage of detection coil 1 and detection coil 2 can be expressed as
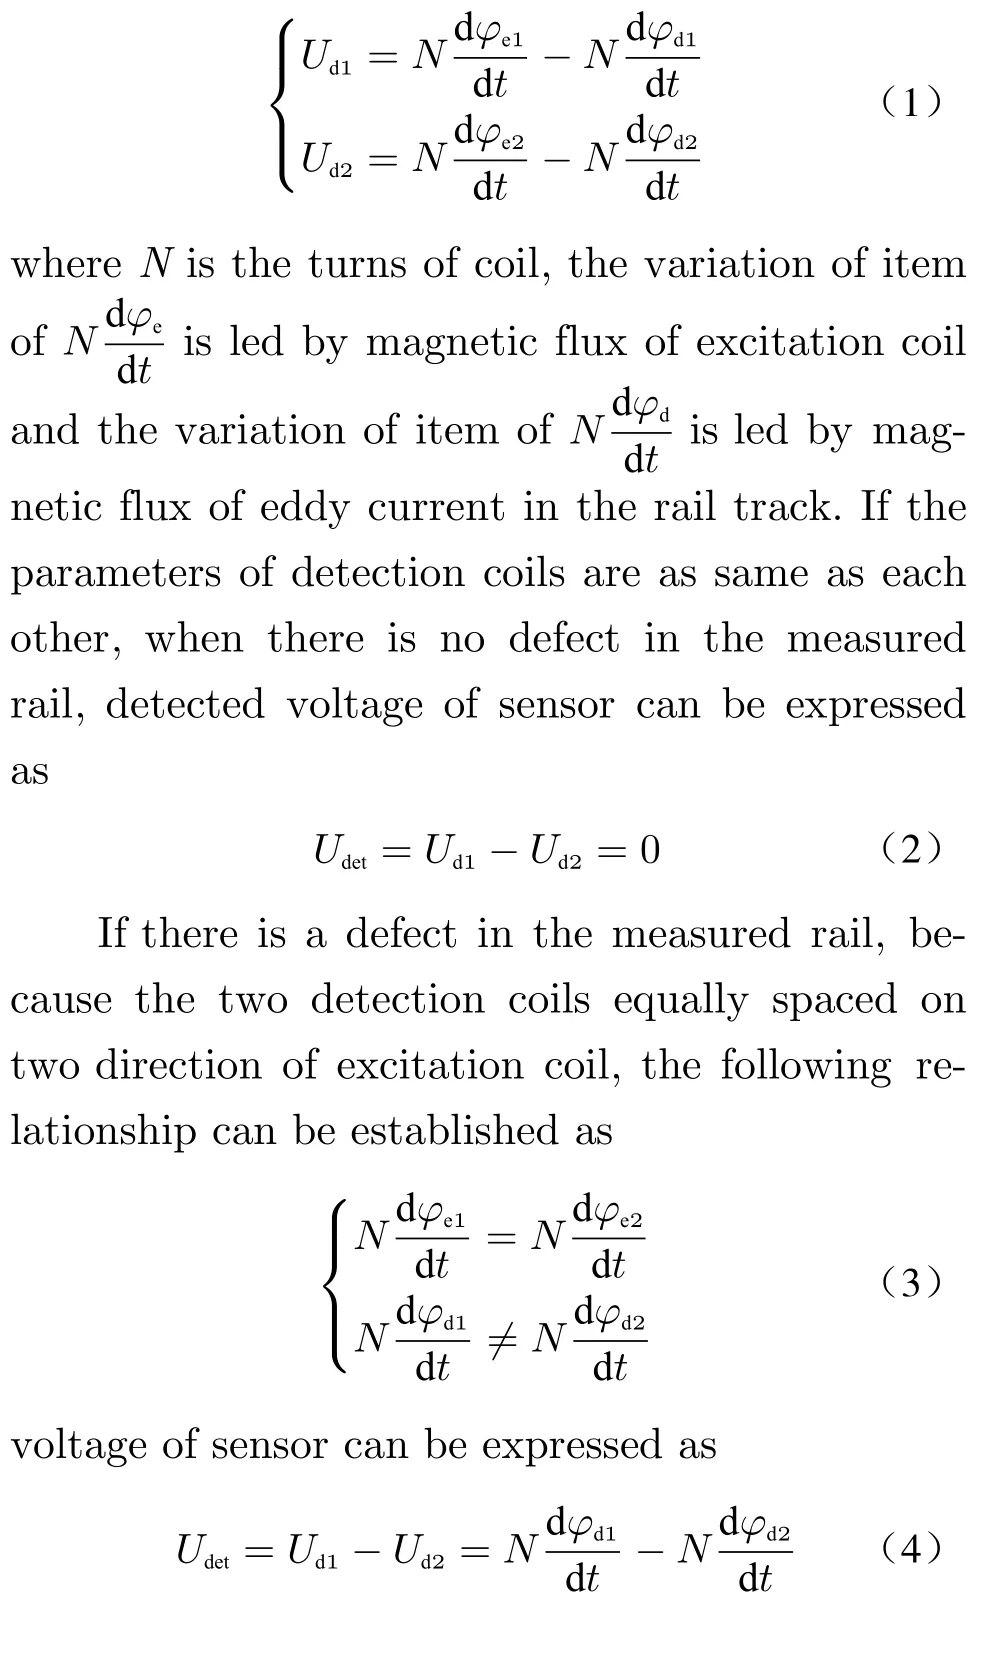
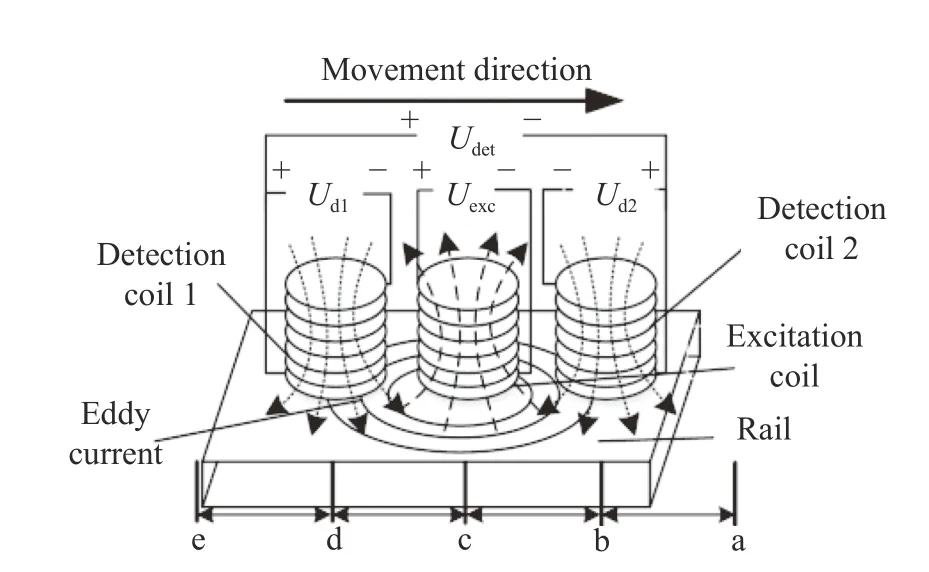
Fig. 1 Principle diagram of rail inspection
If the angular velocity of excitation alternative current isω, the voltage of detection signal can be expressed as

whereAis the magnitude of detection signal which can be calculated by spectrum estimation.If using Fouier transform to obtain the spectrum estimation results [18], the Fourier transform of discreted detection signal can be expressed as[19]

Thus, we can conclude that magnitude or power of the detection signal all can be used for rail inspection, but power of detection signal is more suitable as defect character compared with magnitude because the fluctuation of power is stronger than magnitude and the defect of rail will be easier to detect if the three coils structured sensor cross it.
3 Methods of Half-Cycle Power Estimation
3.1 Power Estimation Based on Fast Fourier Transform
As shown in Eq. (6) and Eq. (8), according to Eulers formula [21], the Fourier transform of discreted detection signal can be rewritten as [21,22]
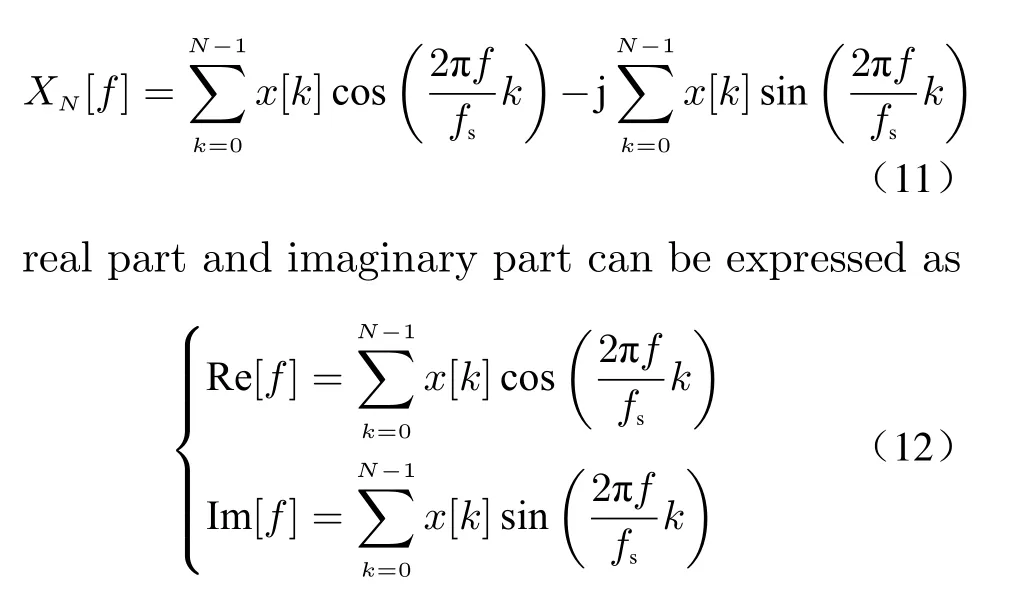
spectrum of magnitude and power can be calculated as
I am stunned5() that millions of Americans are threatened by hunger. If every gardener in America - and we re seventy million strong - plants one row for the hungry, we can make quite a dent1(,) in the number of neighbors who don t have enough to eat. Maybe then I will stop feeling guilty about abandoning a hungry man I could have helped.
Thus, the power and magnitude of identified frequency ofFthat selected through Eq. (7)can be calculated by Eq. (13) [23].
3.2 Power Estimation Method Based on Orthogonal Demodulation
Because the excitation signal contains only one frequency componentF, it means only power of frequency componentFis useful for rail defect characterization. Eq. (11) can be written as

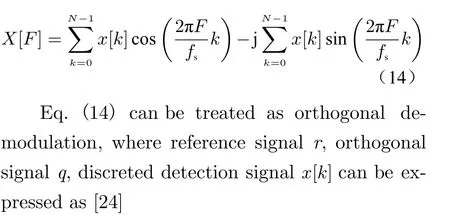
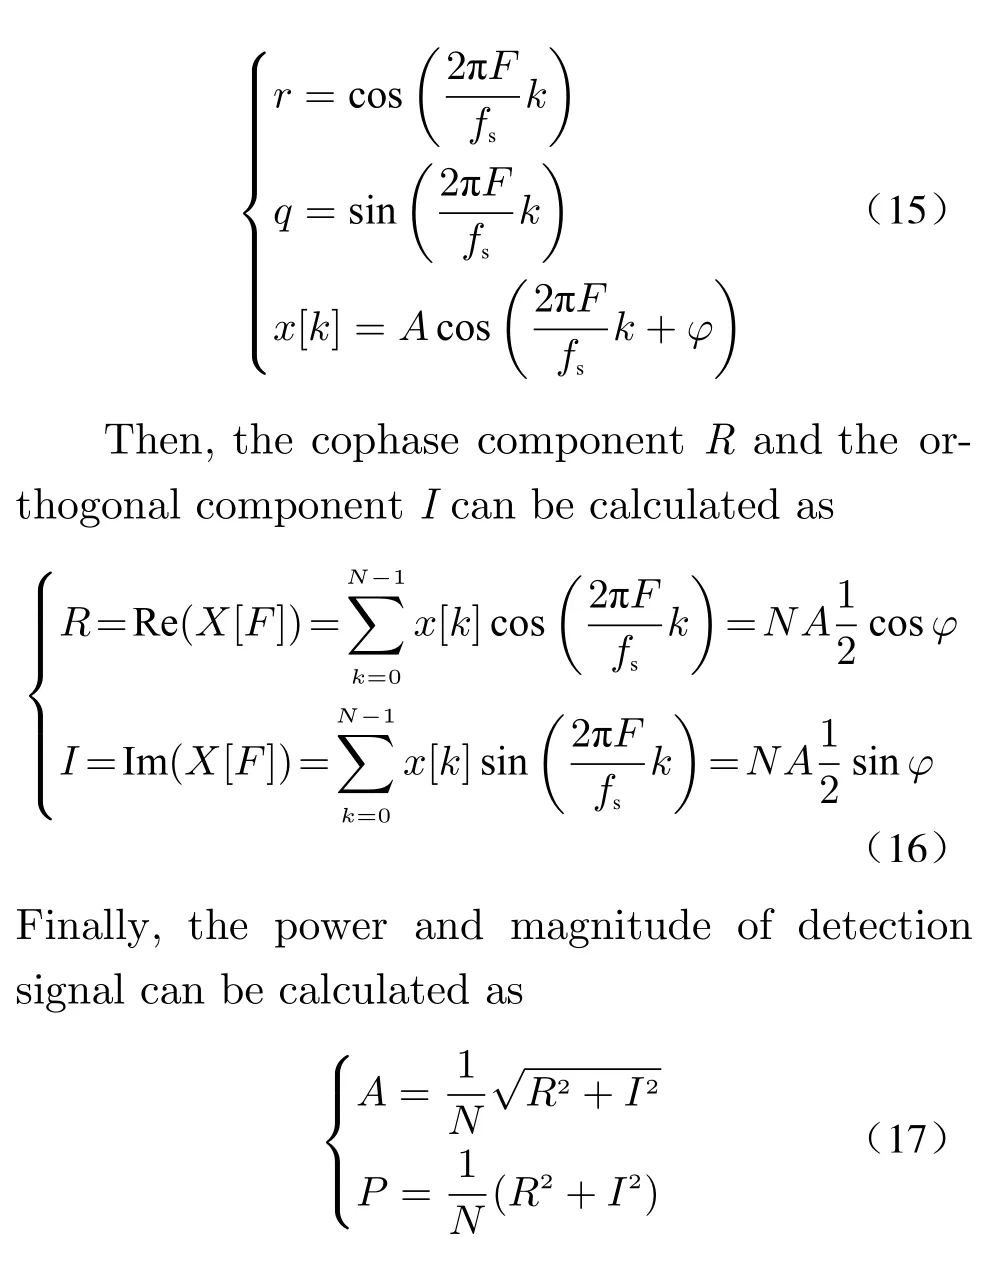
Comparing the two power estimate methods mentioned above, it can be concluded that there is less calculation needed for obtaining the factor of power when using orthogonal method.
3.3 Power Estimation Method Based on Half Cycle Orthogonal Demodulation
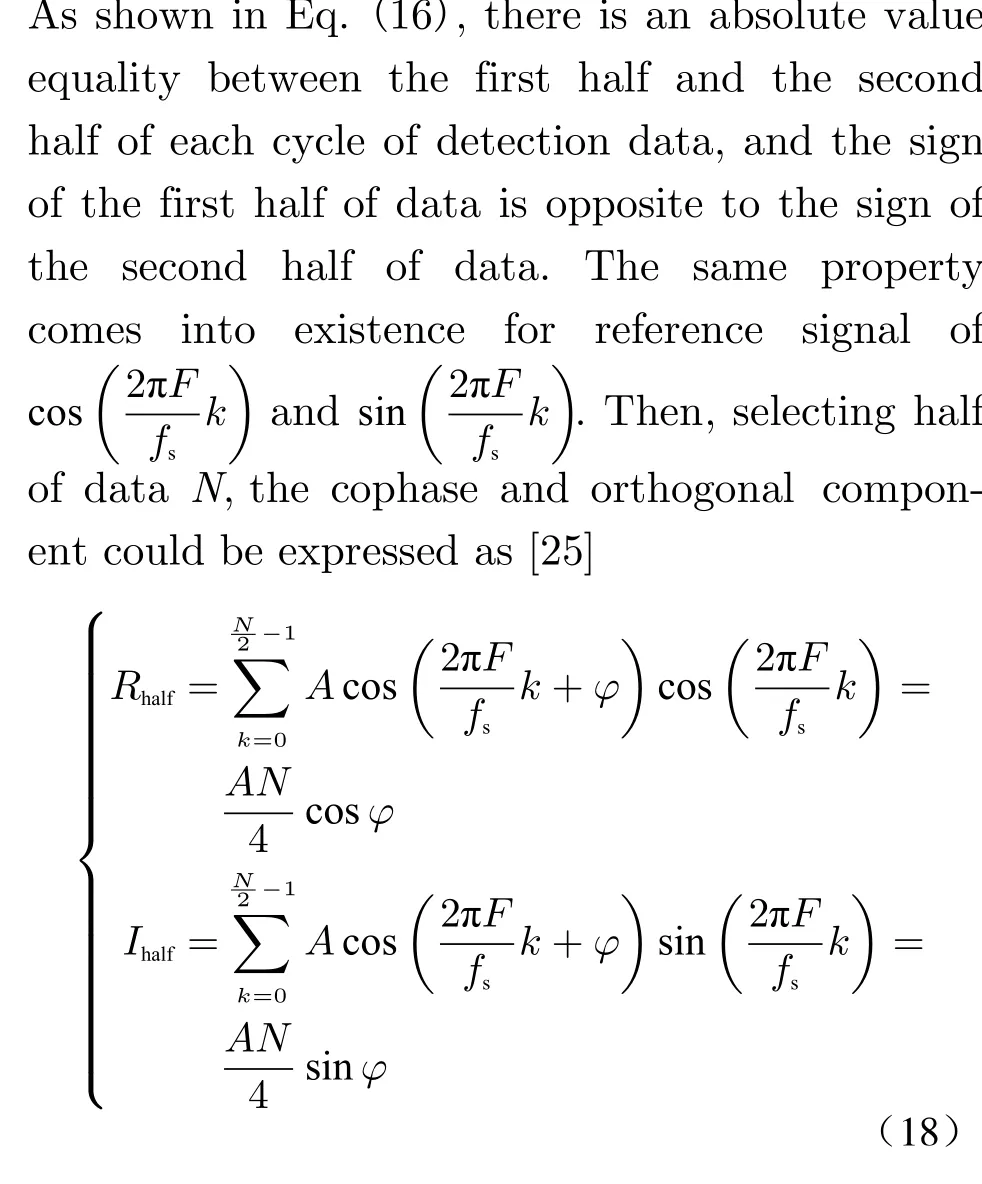
Thus, the half cycle magnitude and power of detection signal can be expressed as
Comparing Eq. (18) with Eq. (16), calculating power of detection signal with half cycle orthogonal method only need half of the points as orthogonal method. As a result, the speed of demodulation is increased, the amount of calculation is decreased and the capability of real-time is improved.
4 Simulation of Half-Cycle Power Estimation
To examine the accuracy of half-cycle power estimation method, MATLAB is used for simulation. Assume that the discreted detection signal is

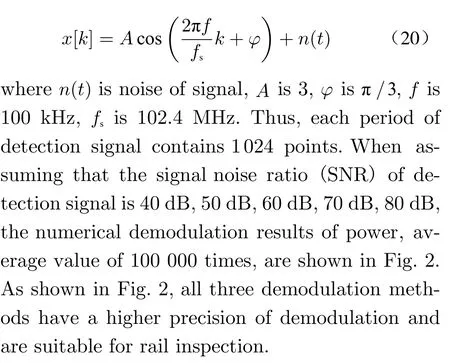
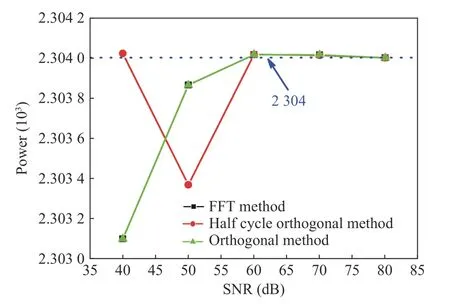
Fig. 2 Simulation results of power
5 FPGA Implementation of Power Estimation
5.1 Implementation of Power Estimation Based on FFT
As discussed in Section 3, results of power can be calculated through FFT and the calculating diagram of power using FPGA is shown in Fig. 3.The operation unit ofNpoint FFT could be implemented by using IP core. As shown in Fig. 3,track 1 and track 2 show the calculate process of power and magnitude separately and there is one more root operation when calculating the magnitudeA[k] compared with calculating the powerP[k].

Fig. 3 Calculate diagram using FFT
When the IP core of FFT is working at streaming mode, the timing diagram of calculation is shown in Fig. 4. As shown in Fig. 4, in each 1 024 period of system clock, the real part and imaginary part will be calculated by FFT core. When setting the calculation delay of multiplier, adder, divider and square root extractor 1 clock period separately, the result of power is obtained after 3 clock period delay and magnitude is obtained after 4 clock period delay after the moment of real part and imaginary part calculated.
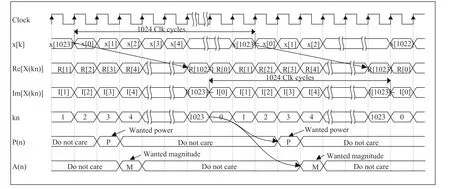
Fig. 4 Timing diagram when using FFT
5.2 Implementation of Power Estimation Based on Orthogonal Demodulation
As shown in Eq.(15), Eq.(16) and Eq.(17), FPGA implementation of power calculation by orthogonal method is show in Fig. 5. In Fig. 5, the read only memory (ROM) numbered 1 and 2 are used to store one period discrete sine and cosine wave separately, and the frequency of two wavefkis equal to the frequency of detection signalF.Thus, there is only one frequency componentFthat needs calculation when using orthogonal method for power estimation.
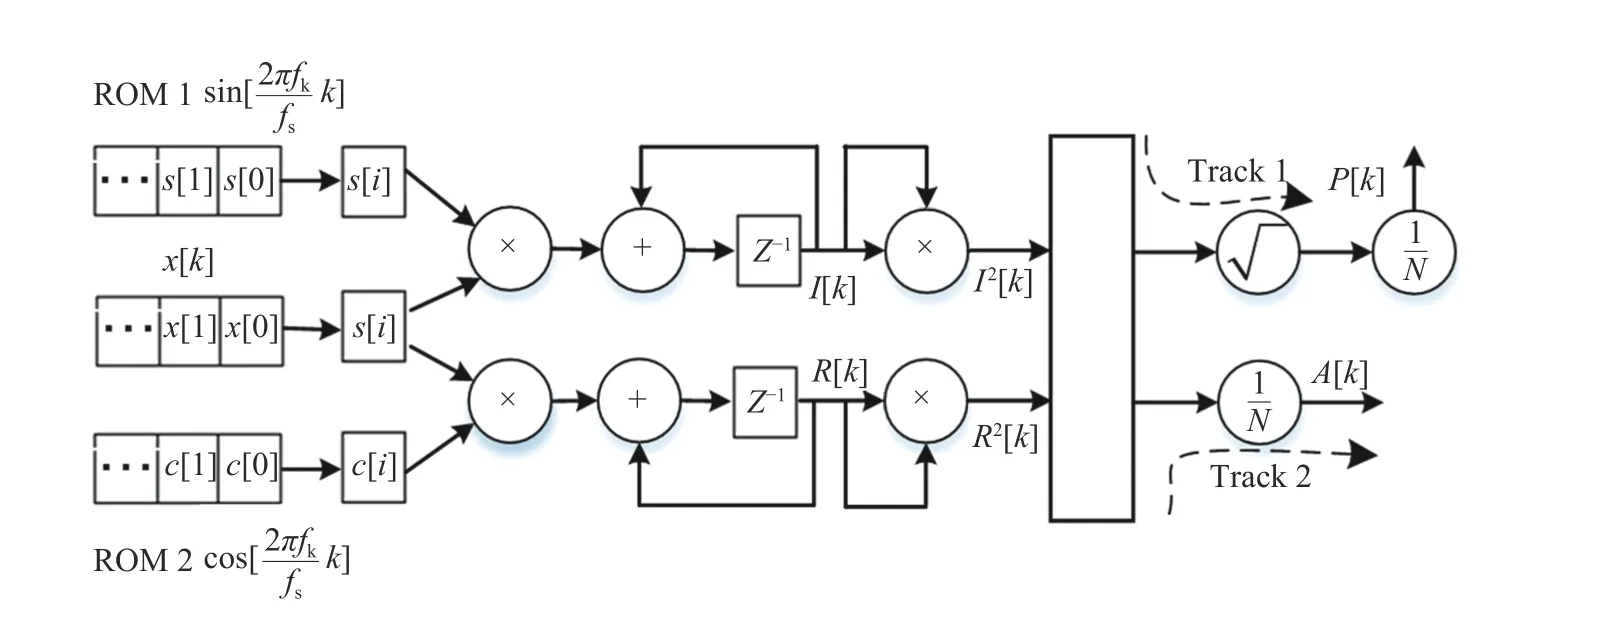
Fig. 5 Calculating diagram using orthogonal method
When setting the delay of multiplier, adder,divider and root extractor 1, the cophase and orthogonal component will be calculated after 3 clock cycles when the last discrete detection data of each period was obtained. There are 2 and 3 clock cycles delay in obtaining the power and magnitude separately after the cophase and orthogonal component calculated. The discussed timing of calculation is shown in Fig. 6.
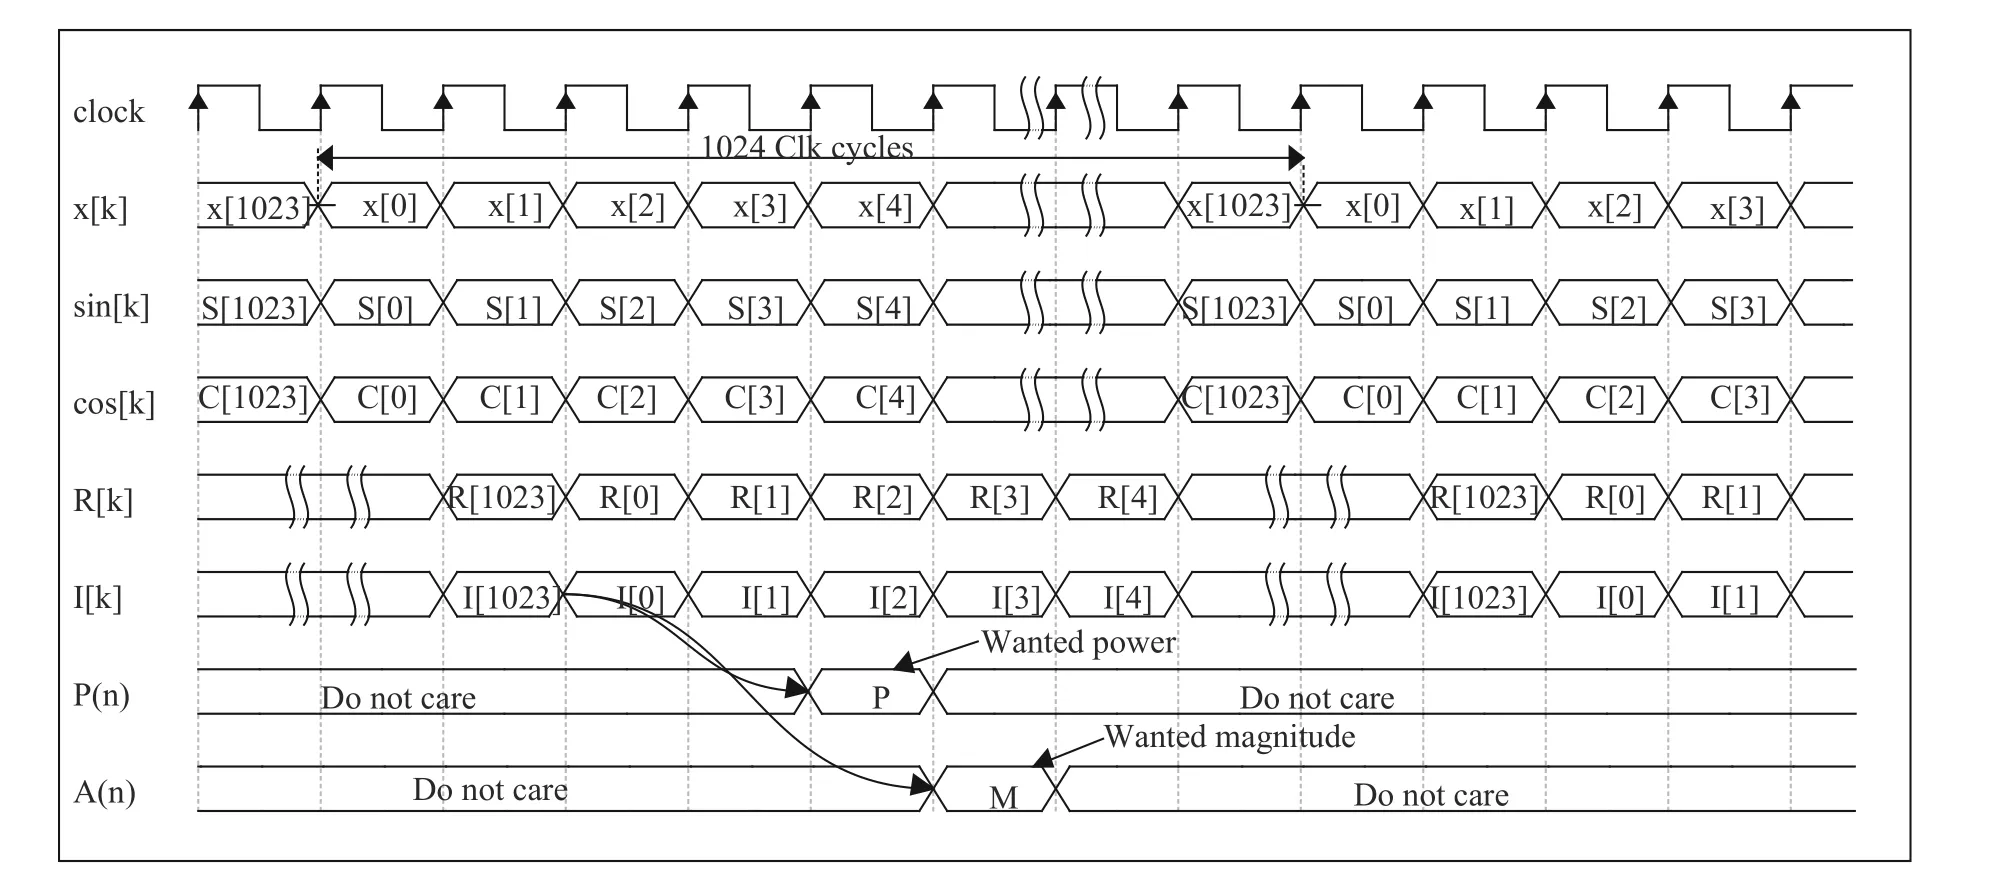
Fig. 6 Timing diagram when using orthogonal method
5.3 Implementation of Power Estimation Based on Half Cycle Orthogonal Demodulation
Comparing Eq. (19), Eq. (17), and Eq. (18) Eq.(16), FPGA implementation of half-cycle orthogonal method is as same as orthogonal method and the calculation diagram is almost as same as Fig. 5, where the only difference is that ROM 1 and ROM 2 store half-cycle discrete reference signal rather than a whole cycle. The timing of half cycle power estimation is show in Fig. 7. As shown in Fig. 7, the total calculation time of power is half of the calculation time when using orthogonal method.
5.4 Analysis of Logic Resources Consuming
Tab. 1 lists the consuming of FPGA resources when different power and magnitude demodulation method selected. As shown in Tab. 1, comparing with using magnitude as character of defect, using power of defection signal as defect character needs less logic [register, look-up tables(LUTs) and flipflops (FFs)] consuming, but the consuming of logic (DSP48E1 and BRAM) are identical. The consuming of logic (register,LUTs, FFs, DSP48E1 and BRAM) when using demodulation algorithm based on FFT are much more than using method based on orthogonal demodulation and half-cycle orthogonal demodulation no matter using power or magnitude as defect character. The consuming of logic (register,LUTs, FFs, DSP48E1 and BRAM) is equal when using calculation algorithm based on orthogonal method and calculation algorithm based on halfcycle method.
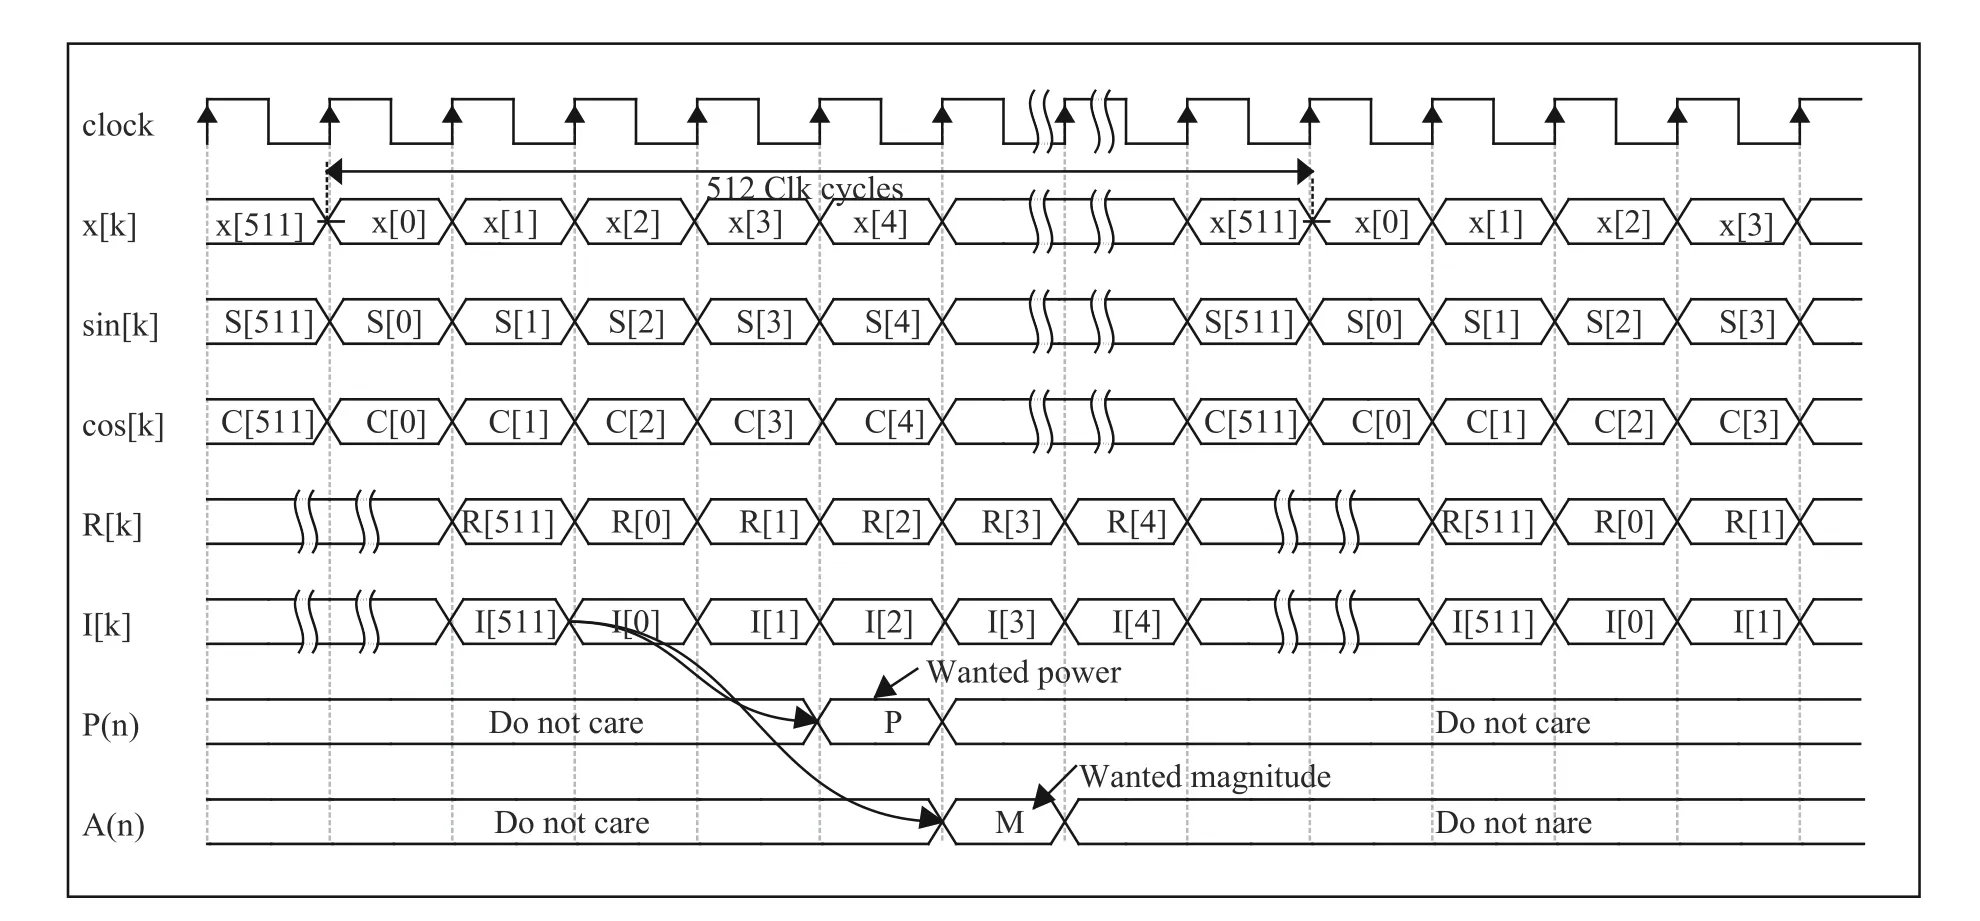
Fig. 7 Timing diagram when using half cycle orthogonal method for power estimation

Tab. 1 List of FPGA resources used
6 Experiment of Demodulation
An experiment system based on FPGA was built to verify the feasibility and stability of calculation algorithm. The experimental system of data processing is shown in Fig. 8, and the diagram of data processing system is shown in Fig. 9. As shown in Fig. 9, the system contains DC-DC board, excitation signal amplifier board (power amplifier board), detection signal amplifier board(amplitude amplifier board), AD/DA board and FPGA board.
A sinusoidal signal is generated by a signal source. Set the frequency to 100 kHz, and connect it to the ADC port. If the frequency of sampling clock is set to 102.4 MHz, the normalized demodulated power values calculated through three different algorithms that discussed above are shown in Fig. 10. The operation of normalization can be expressed as

whereg[j],j=1,2,··· ,mare results of demodulation,mis the quantity of demodulation result. In Fig. 11 and Fig. 12, the number ofmis 100. As shown in Fig. 10, power fluctuation when using half-cycle orthogonal method and orthogonal method are almost the same and far below FFT method.
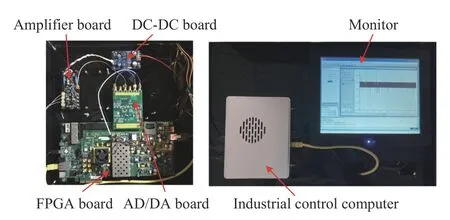
Fig. 8 Experiment system of data processing
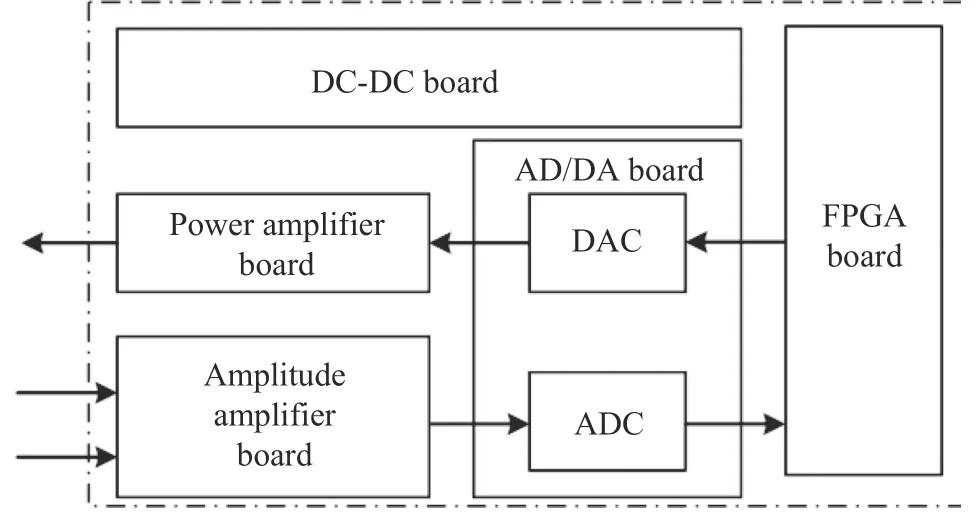
Fig. 9 Experiment system diagram of data processing
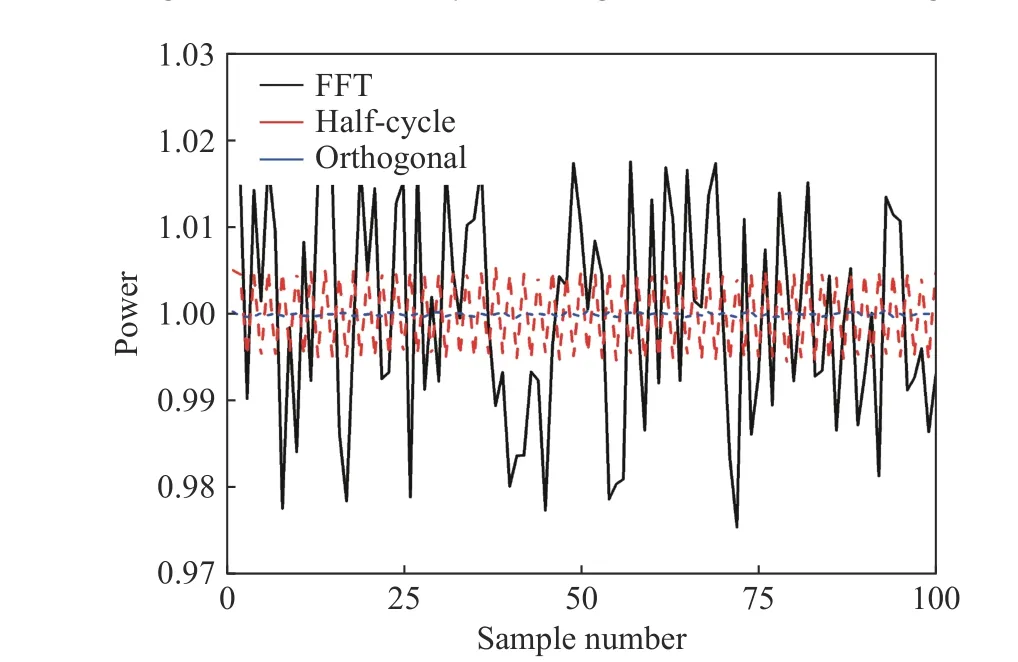
Fig. 10 Comparison of demodulated power of sinusoidal signal
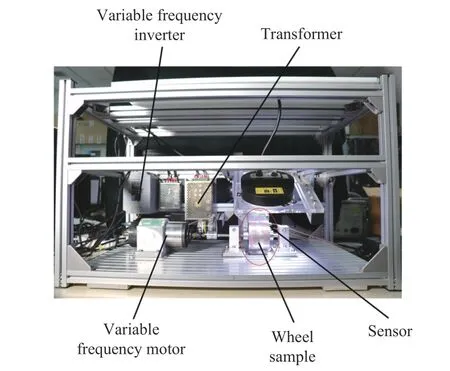
Fig. 11 System for rail inspection under high-speed condition
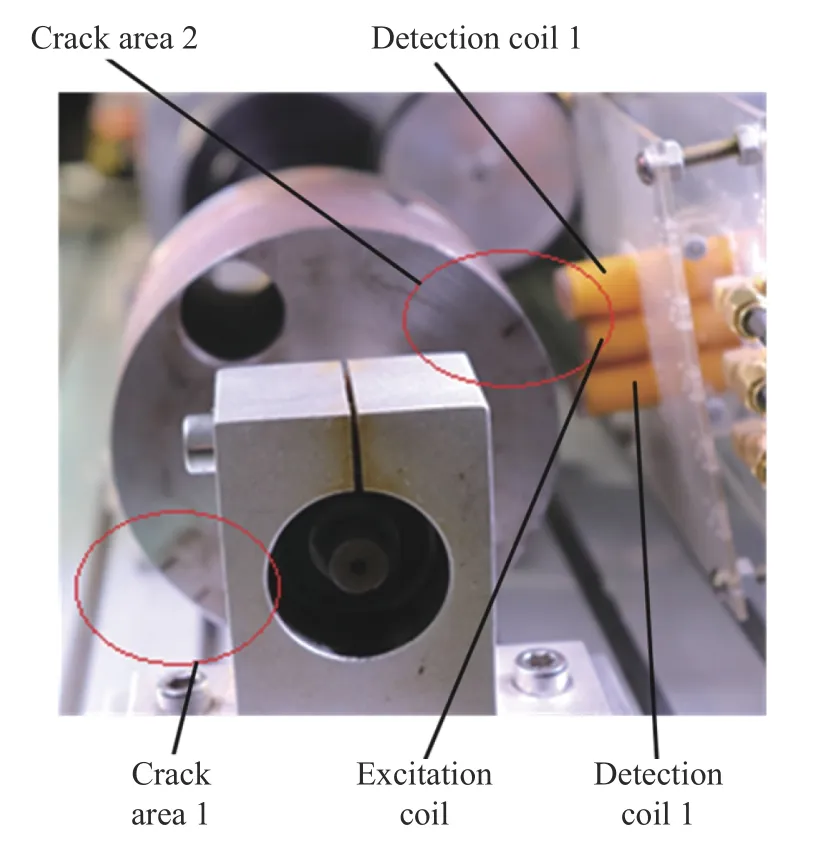
Fig. 12 Sample of rail with defects
7 Experiment of Rail Inspection under High-Speed Condition
To verify the effectiveness of rail defect inspection by proposed method under fast speed condition, a rail defect inspection experiment system was built and the inspection speed was set to 200 km/h. The diagram of the system is shown in Fig. 11.
As shown in Fig. 11, the system contains wheel sample, sensor array, high-speed variable frequency motor, frequency converter, etc. When system in operation, the high-speed variable frequency motor actuate the wheel sample rotate fast to simulate high-speed movement of sensor up on the rail. The excitation coil and two detection coils are connected to corresponding port shown in Fig. 9 by shielded wire. The details of rail sample and sensor array are shown in Fig.12.
As shown in Fig. 12, the sensor array contains an excitation coil and two detection coils.The wheel sample contains two defects, the defect 1 contains 2 crack and defect 2 contains 1 cracks, the width of each crack is 0.5 mm and the depth of each crack is 5 mm.
In the experiment system, for excitation part, FPGA generates a single frequency digital sinusoidal signal by using DDS IP core, which is analogized by DAC, and the obtained analog excitation signal is amplified by using excitation amplifier board and applied in the excitation coil to generate excitation electromagnetic field. For detection part, the two detection signals are differential amplified and filtered by using differential amplifier and filter on the detection signal amplifier board, the analog processed detection signal is digitized by ADC, and the obtained digital signal is demodulated by FPGA. Thus, the character of power and magnitude of detection signal are obtained.
The experiment results when selecting different method as demodulation algorithm under 200 km/h speed condition are shown in Fig. 13,Fig. 14, Fig. 15.
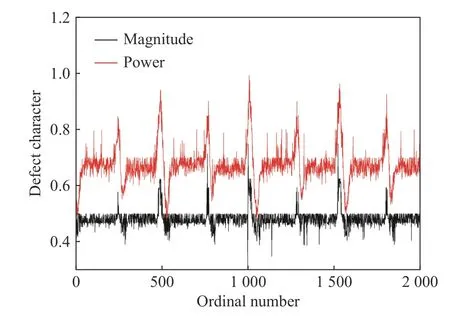
Fig. 13 Experiment results when select FFT method as demodulation algorithm
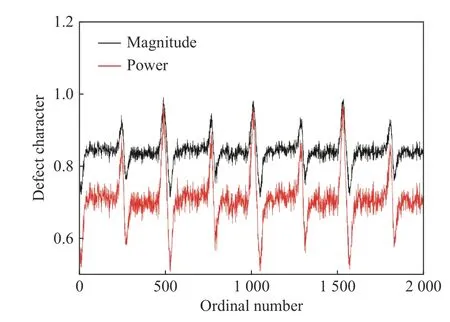
Fig. 14 Experiment results when select orthogonal method as demodulation algorithm
From Figs. 13-15, we can find that the experiment results are consistent with theoretic analysis, which means selecting power as defect character is more appropriate for rail defect inspection because the fluctuation of demodulated power is much more remarkable than demodulated magnitude when sensor cross the defect.Demodulation algorithm based on three methods is acceptable for high-speed rail inspection and the algorithm based on half-cycle method has better real-time performance, because in the same period of time, the numbers of demodulated characters are double of using other methods.
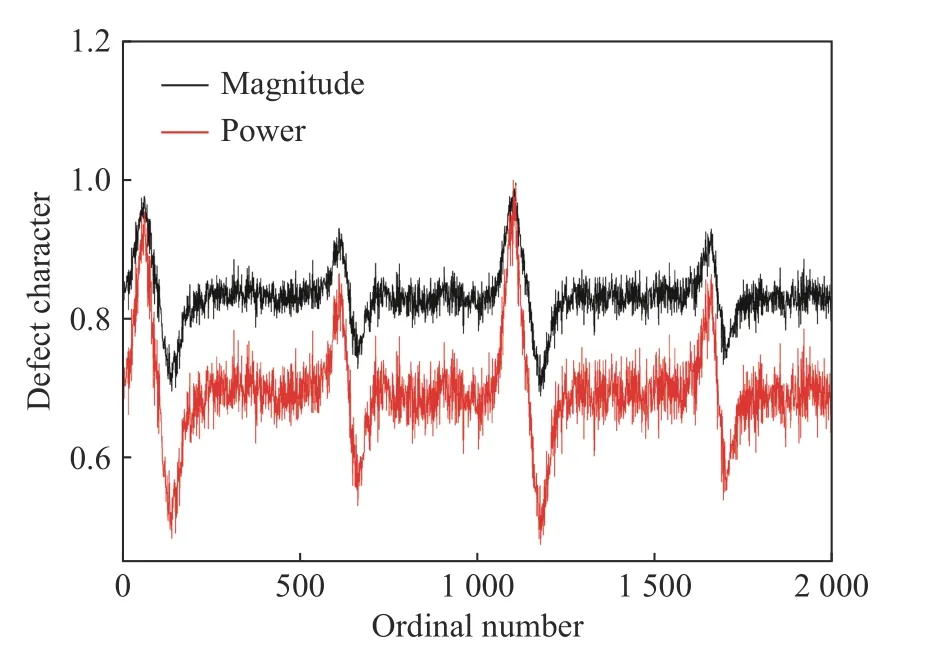
Fig. 15 Experiment results when select half-cycle orthogonal method as demodulation algorithm
8 Conclusion
In this paper, method of half-cycle power demodulation based on FPGA for high-speed and real-time rail inspection is proposed. Conclusions can be described as follows: 1) Compared with selecting the magnitude of the detection signal as character of detected defect, selecting the power of the detection signal is more effective for rail defect inspection. 2) Compared with the FFT power demodulation method and the whole cycle power demodulation method, the time resolution of the half-cycle power demodulation method is double of other two methods. 3) Compared with FFT power demodulation method, half cycle power demodulation method consumes less FPGA resources. 4) Half cycle power demodulation method can effectively detect the seam defect under the detection condition of 200 km/h.
杂志排行
Journal of Beijing Institute of Technology的其它文章
- Objective Quantification of Small Motor Sound Quality Based on Psychoacoustic Metrics
- ISAR Imaging and Cross-Range Scaling Based on Image Rotation Correlation
- Jamming Monitoring Technology of the Space Situational Awareness Facilities:A Comprehensive Survey
- Restoring Polarization Angle Map for High-Fidelity Underwater Imaging
- Jamming Recognition Based on Feature Fusion and Convolutional Neural Network
- Unmanned Technology-Based Civil-Military Intelligent Logistics System : From Construction to Integration
