Decentralized damage diagnostic technique for tall buildings using VARMAX model
2022-04-15LakshmiandPrawin
K. Lakshmi and J. Prawin
CSIR-Structural Engineering Research Centre, CSIR Road, Chennai 600113, Tamil Nadu, India
Abstract: Civil infrastructure, especially buildings, are becoming more slender, tall, and multipurpose, creating a need to continuously monitor their health to ensure the safety and security of human lives and assets. While the majority of structural health monitoring techniques use measurements from the entire structure, in this study, an output-only damage diagnostic technique using a decentralized concept (subdomain-based) for tall buildings and employing a vector form of the autoregressive moving average with exogenous input (VARMAX) model is proposed, which offers reduced instrumentation and data handling requirements. Unlike other decentralized approaches, this technique predicts more than one DOF at a time so the number of subdomains required for the diagnosis of the complete structure is minimized.The proposed subdomain-based damage diagnostic algorithm works with ambient loads and does not require any correlated numerical models since it is solely based on measured data. The proposed algorithm can identify the time instant of damage, spatial location (s) and characterize the damage intensity. Efforts have been made to account for confounding factors such as environmental and operational variabilities separate from measurement noise to avoid false positive alarms. The effectiveness of the proposed technique is illustrated using synthetic time history responses from a twenty-story framed structure under ambient loading and an experimental study on a ten-story framed structure. Both numerical and experimental investigations confirm the effectiveness of the method and its robustness to environmental/operational variabilities and measurement noise.
Keywords: structural health monitoring; subdomain; high-rise buildings; shear-type buildings; VARMAX model; environmental and operational variability; measurement noise
1 Introduction
Advancements in the construction industry, such as innovative technologies fueled by an increase in population and land demand, have led to increased construction of high-rise buildings around the globe. They have become a symbol of technical, financial, and engineering excellence of a country, exhibited through the construction of modern buildings, with ever-increasing heights. Further, these tall structures are becoming increasingly flexible due to innovative construction materials and design practices. The buildings are normally subjected to multi-hazards such as wind and seismic actions (Zhou and Xu, 2007; Xie and Qu, 2018). Therefore, these modern buildings are more susceptible to damage. A system that can monitor high-rise buildings and flag a warning when there is a change in the state of the structure due to aging or after an event such as an earthquake, is essential for their safe operations.
Structural health monitoring (SHM) has been proven to be a highly viable alternative to timeconsuming, expensive, and highly subjective periodic visual inspections (Zhang and Jin, 2008), both from an economical point of view as well as safety and reliability in assessment. The advancements and affordability of sensor technologies make structural health monitoring an integral part of civil infrastructure management systems. These sensors are optimally and strategically placed on the structures, using the optimal sensor placement techniques (Vosoughifar and Manafi, 2020; Huet al., 2018), to obtain the data containing the crucial information of structures. Damage diagnostic techniques are the key components of any SHM scheme. Apart from single-type sensors, multi-type sensors are also being used for acquiring different kinds of measurement and analyzing them to extract the features of damage (Dinget al., 2019; Huet al., 2018). The basic premise on which most of the damage diagnostic techniques have been developed is that the damage in any structure alters the stiffness locally, which promptly reflects in its dynamic behavior (Avciet al., 2021).
During health monitoring of civil engineering structures, the damage features extracted from measured data are often limited by confounding effects such as environmental and operational characteristics. In this context, the structure′s temperature-sensitive parameter such as Young′s modulus has the most significant influence in altering its static and dynamic behavior in different ways or simply influence the measurement, leading to false alarms. In general, temperature-based effects on features indicating SHM damage are more significant than local structural damage in early stages (Farraret al., 1997; Peeters and De Roeck, 2001; Baiet al., 2018). Similarly, operational conditions such as live loads, speed of operation of wind loads and changing excitation sources etc., can also adversely affect damage diagnostic techniques. These environmental and operational variabilities need to be addressed appropriately to achieve robustness in damage diagnosis. Apart from these, other sources of variability can also exist at the experimental level such as instrumentation, random noise, vibration source, etc. and require attention.
Among various damage diagnostic techniques developed so far, vibration-based methods are quite popular and have been investigated over the past three decades (Avciet al., 2021). Among them, the natural frequency and mode shapes and other similar derived features such as modal flexibility, modal curvature, modal strain energy etc., (Fan and Qiao, 2011; Hsuet al., 2019) have dominated initial SHM research primarily due to their sound theoretical basis and close correlation with the physics of the structure. However, they are global methods and cannot precisely locate local damage. Apart from this, difficulties in extracting the higher modes which can reflect local damage has also limited their practical applicability. Apart from this, handling confounding factors such as environmental and operational variability (EOV) is difficult with modalbased methods. In view of this, several signal processing techniques have recently gained prominence. Popular among them are statistical time series models (Yao and Pakzad, 2012; Entezamiet al., 2018, 2020), timefrequency analysis (Nagarajaiah and Basu, 2009; Shiet al., 2012; Rao and Lakshmi, 2015; Panet al., 2018), multivariate methods (Raoet al., 2012, 2015; Tibaduiza, 2016; Sarmadi, 2020), time-scale analysis (Kankanamgeet al., 2020), multi-model based methods (Liet al., 2017; Lakshmiet al., 2017; Krishansamy and Arumulla, 2018, 2019), artificial intelligence (AI) and machine learningbased techniques (Avciet al., 2021) etc. Among several choices of these signal processing tools, the statistical time series modelling techniques have recently gained prominence. In the last few years, especially with the advent of advanced sensors such as wireless smart sensors, where the processing of the signals can be carried out locally within the sensor, these time series models hold several advantages when compared to other signal processing techniques. These techniques are potential candidates to account for the enormous amount of data collected during the SHM of civil structures (Sohn and Farrar, 2001). They offer additional advantages in terms of their abilities to (i) perform in an uninterrupted operational mode, using ambient vibration responses, (ii) automatically account for the uncertainty or variability by adopting the appropriate statistical tools, and (iii) operate using the parts of the structural dynamic model with limited sensors.
Time series methodologies typically use autoregressive (AR) (Wanget al., 2016; Chenget al., 2017), AR-AR with exogenous inputs (AR-ARX) (Sohn and Farrar, 2001), vector AR (Mosaviet al., 2012; Lakshmi and Rao, 2018), autoregressive moving average (ARMA) models (Carden and Brownjohn, 2008), ARMA with exogenous inputs (ARMAX) (Mei and Gül, 2015; Lakshmi and Rao, 2016; Lakshmiet al., 2017; Krishansamy and Arumulla, 2018), vector ARMA(ARMAV) (Bodeux and Golinval, 2001), vector ARMAX models (Fassois and Lee, 1993) and other variants such as time-dependent autoregressive moving average (TARMA) (Spiridonakos and Fassois, 2010) and functionally pooled models (Sakellariou and Fassois, 2017), to extract the damage features.
The damage diagnostic techniques discussed so far are based on the centralized concept of instrumenting the entire structure, measuring the time-history responses and later using diagnostic techniques on the entire set of measurements to arrive at the current state of the structure. Since civil engineering structures are spatially large, e.g., such as long-span bridges, tall buildings, etc., a large number of sensors are required to instrument them for global centralized monitoring. Even though high fidelity sensing always provides high-quality diagnosis, it is expensive and complex for spatially large structures. In view of this, SHM schemes generally resort to a limited number of optimally placed sensors (Rao and Anandakumar, 2007) to reduce the monitoring costs, thereby sacrificing the robustness of the diagnosis process. On the other hand, decentralized algorithms show exceptional promise as these techniques focus on a local area of a structure with high fidelity sensing, to detect and locate structural damage more robustly. The proposed subdomain-based algorithm is a type of decentralized algorithm. Subdomain-based algorithms offer several advantages over centralized algorithms such as (i) data handling and diagnostic complexities become much simpler, as the measurements are confined to only a particular subdomain, (ii) high fidelity sensing is feasible due to the limited degrees of freedom associated with a subdomain and improves the quality of diagnostics, (iii) diagnosis can be independently performed on any critical part of the structure, without resorting to complete measurements, (iv) greatly improves the power as well as transmission efficiency when implemented on a network of smart wireless sensors, as all computations can be performed locally in each subdomain unlike centralized methods, and (v) adaptable for the technology-driven SHM such as mobile sensing and diagnostics (Zhuet al., 2010).
Several decentralized damage diagnostic techniques have recently been proposed in the literature under the name of substructure-based damage diagnostic techniques. Rao and Lakshmi (2011) have developed domain decomposition-based system identification techniques for tall buildings using immune algorithms. Xing and Mita (2012) proposed a substructure approach for damage detection of shear structures by dividing a complete structure into several substructures and thereby reducing the number of unknown parameters for each substructure. The damage detection was conducted independently in each substructure. Gislasonet al., (2019) evaluated the effectiveness of the ARMAXbased damage detection model (DDM) in locating and quantifying damage in buildings. However, the technique predicts only one degree of freedom (DOF) at a time and therefore many substructures are needed to assess the complete structure. Ugaldeet al. (2016) proposed a novel SHM method for damage localization and quantification in simulations and experimental investigations of a fivestory laboratory structure, combining the substructuring approach and vector auto-regressive with exogenous input (VARX) models using displacement data. It can be observed from the above discussion that most of the earlier works required a large number of substructures as well as correlated finite element models.
Keeping these things in view, in this study, a decentralized damage diagnostic technique for shear-type buildings is proposed using the vector ARMAX(VARMAX) model, which includes the disturbance dynamics present in the signal, employs easily measurable output-only acceleration data and provides a diagnosis with a lesser number of substructures. The proposed technique can be applied to tall buildings and allows the number of stories in each subdomain to be selected. The whole structure is conveniently divided into the smaller units called ‘subdomains’ and the time history measurements of each subdomain are processed independently for damage diagnosis. The responses from the internodes and interior nodes of a subdomain are used in the VARMAX model for prediction. New damage indices have been proposed to handle the inevitable confounding factors such as environmental and operational variabilities, apart from measurement noise, to avoid false-positive alarms during subdomain-based diagnosis. To the best of the author’s knowledge, this is the first time that a subdomain-based damage diagnostic technique handling environmental and operational variabilities has been proposed. The advantages of the proposed technique are: (i) It does not require any correlated numerical models because it is solely based on measurement data, (ii) the ARMAX model has the capability to include the disturbance dynamics for prediction, (iii) ability of the VARMAX model to predict the responses of more than one DOF within the subdomains simultaneously, and (iv) diagnosis with a minimum number of subdomains in a structure.
A damage localization strategy using the current data from a typical subdomain and its corresponding pristine data is proposed with a new damage index to identify the change in the state of dynamics locally due to the presence of damage. The proposed damage diagnostic technique will account for all the confounding factors such as environmental/operational variabilities and measurement noise while localizing the damage. Apart from identifying the exact time instant of damage and localization, the proposed damage index can also characterize the intensity of the damage. The effectiveness of the proposed damage diagnostic technique is illustrated using the synthetic time-history responses of a twenty-story framed structure under ambient loading and an experimental study on a tenstory framed structure.
This paper is organized as follows. The mathematical formulations of the proposed VARMAX-based damage detection methodology are presented in the next section, followed by a description of the step-by-step procedure of the proposed damage diagnosis technique in Section 3. The numerical validation studies, using a 20-story shear structure are presented in Section 4, followed by the experimental investigation of a 10-story framed structure in Section 5. Conclusions based on the investigations carried out are presented in the last section.
2 Theoretical formulations
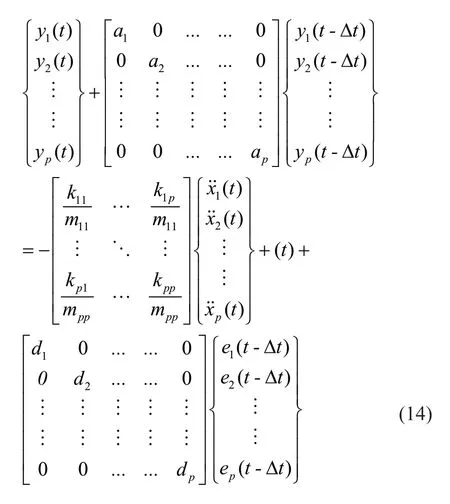
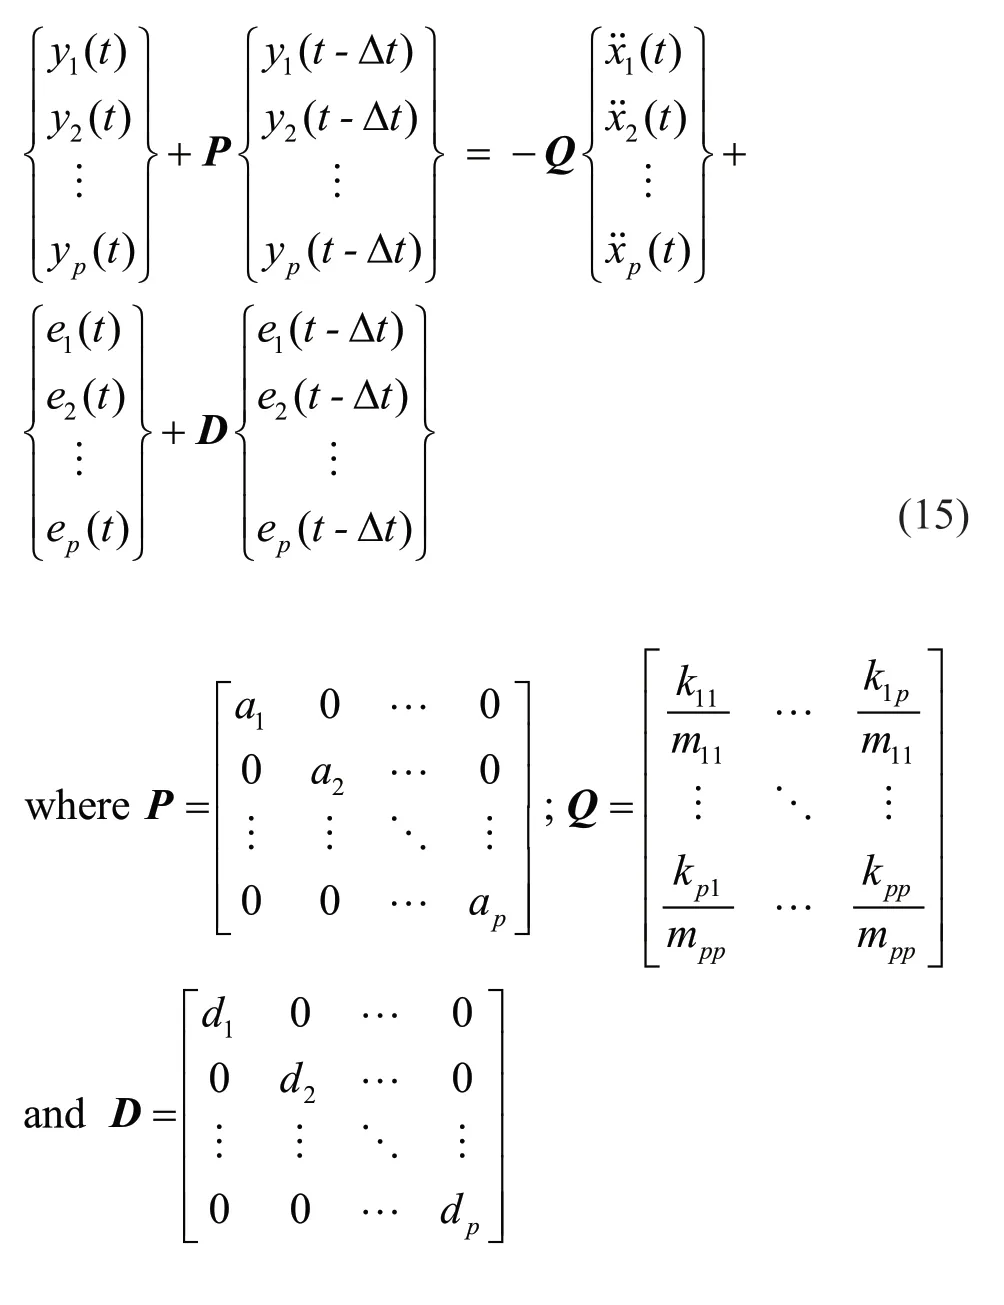
The proposed subdomain-based technique is built based on time series modelling of the responses acquired from the structure of interest. The time series model employed in this technique is the vector ARMAX model written in the form (Ljunget al., 1999, pp. 91-93) given below.
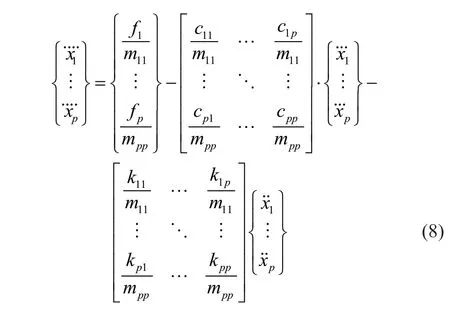
The generalized dynamic equation of motion, ofndegrees-of-freedom, can be written as
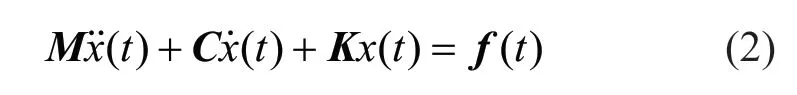
whereM,C, andKare thenbynmass, damping and stiffness matrices of the system, respectively. The vectorsandx(t) are acceleration, velocity and displacement at time instantt, respectively.f(t) is the vector representing the external force acting on the system. Equation (2) can be represented in a matrix form as
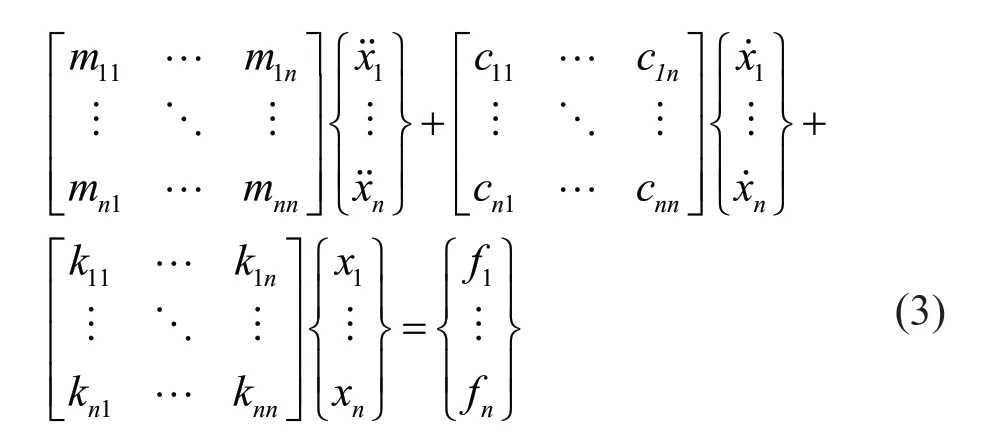
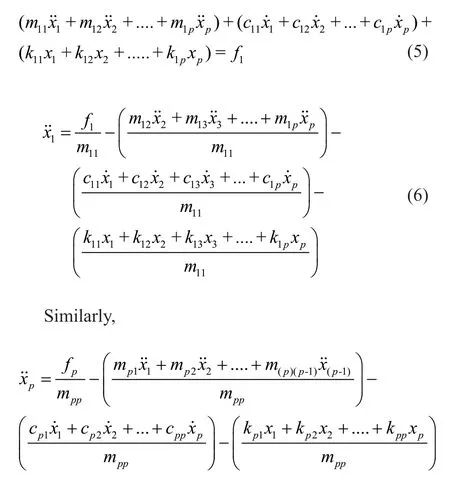
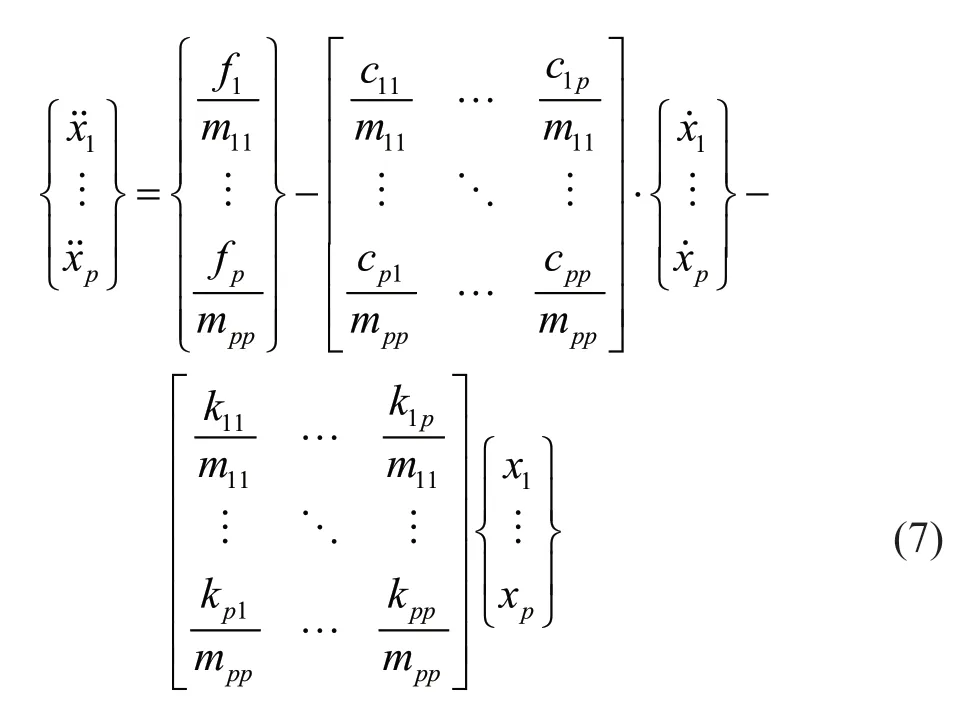
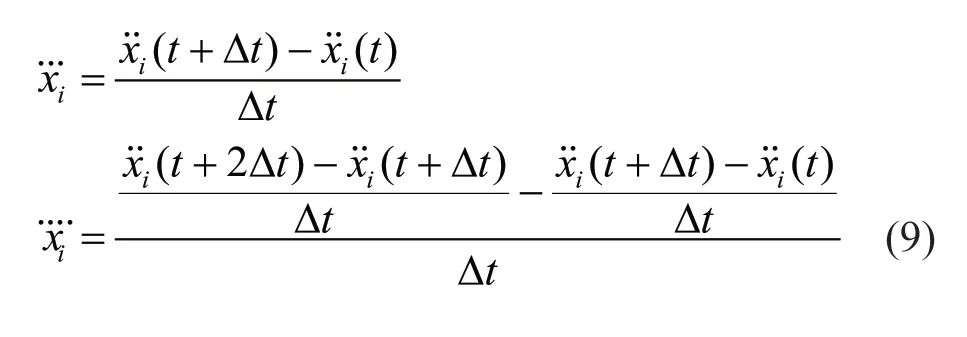
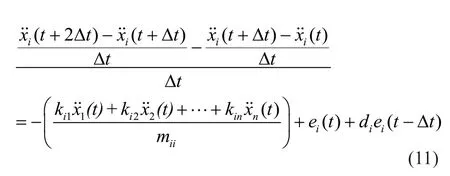
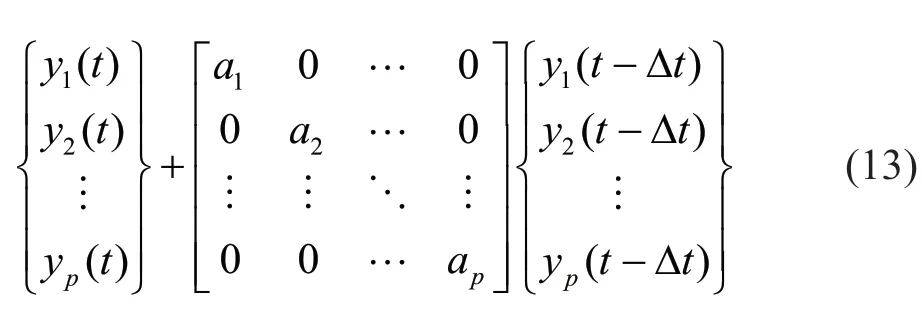
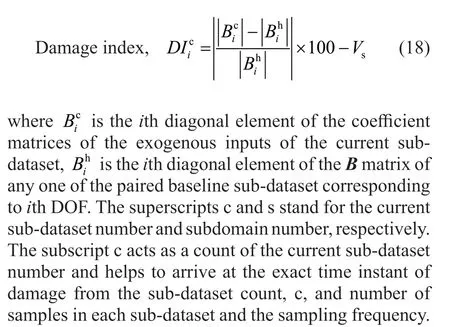
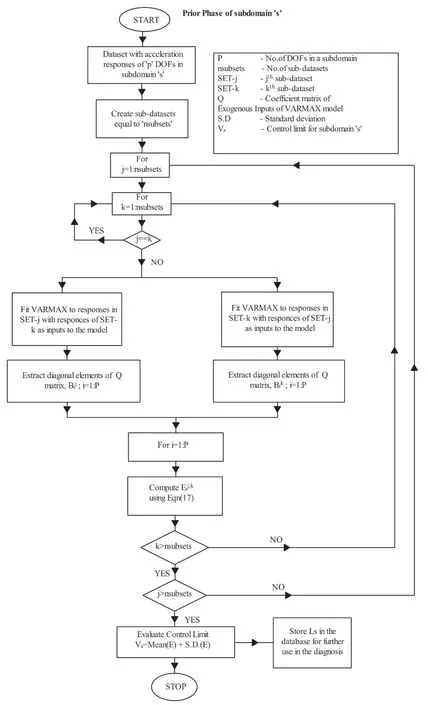
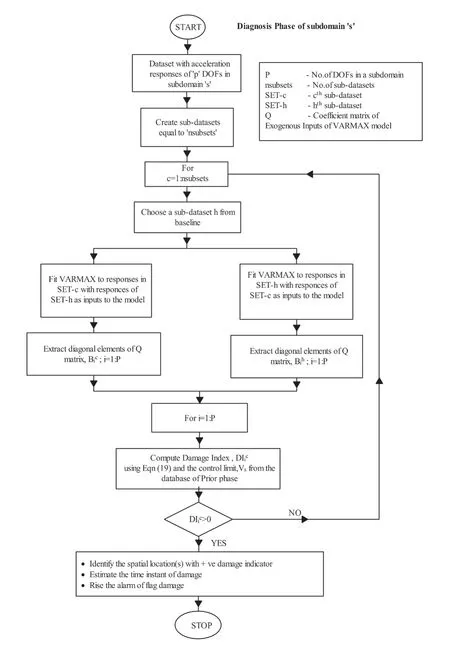
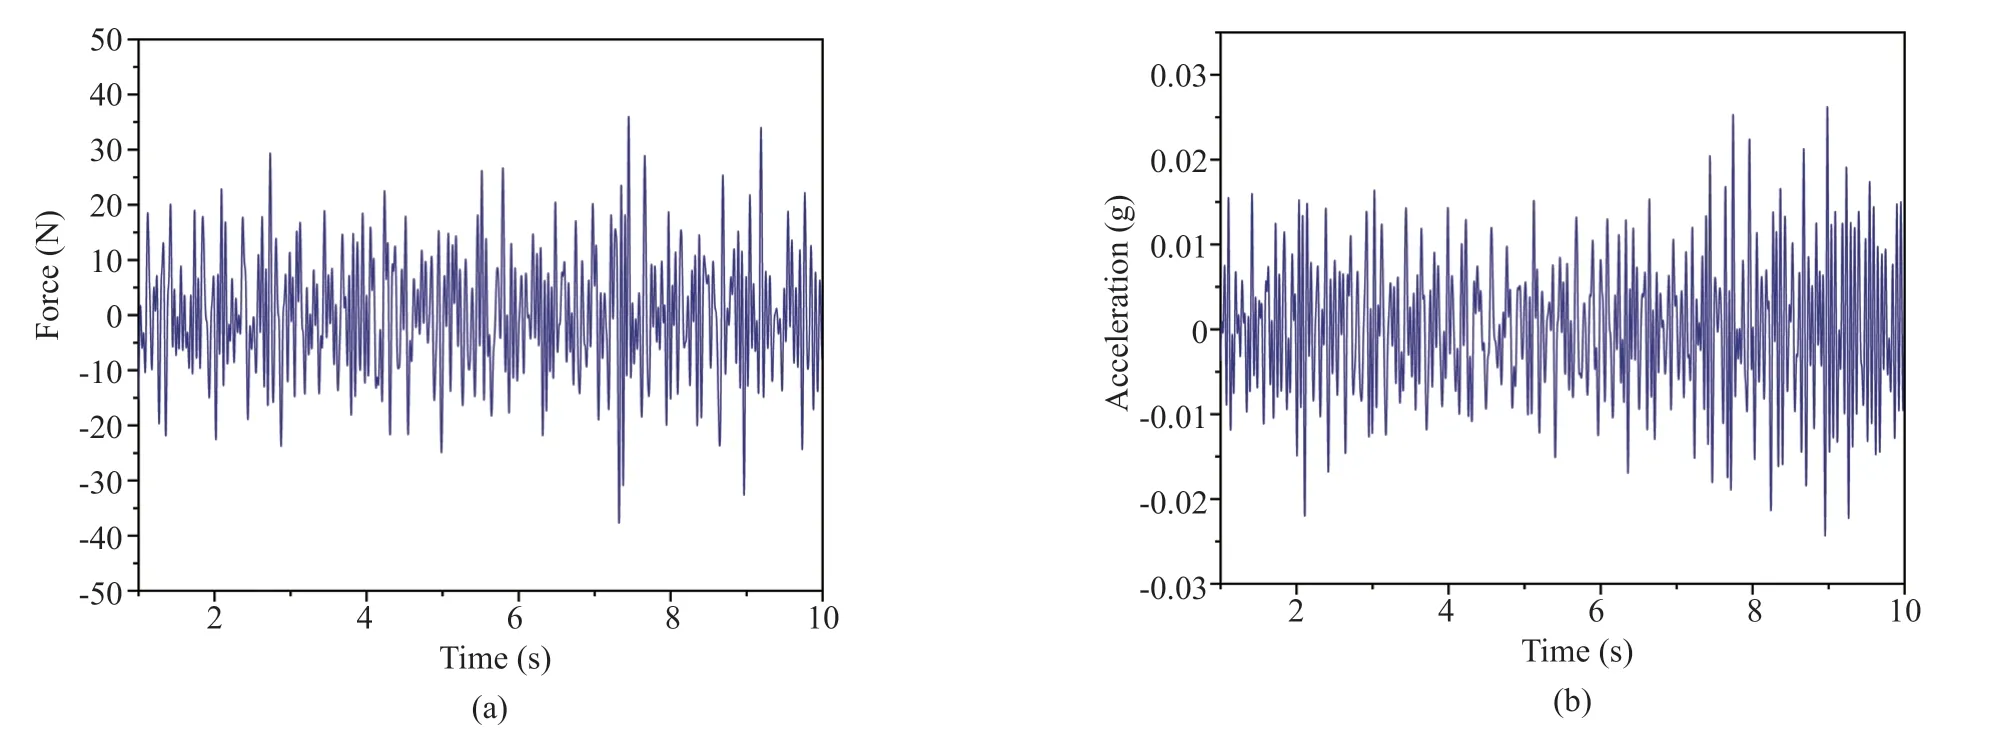
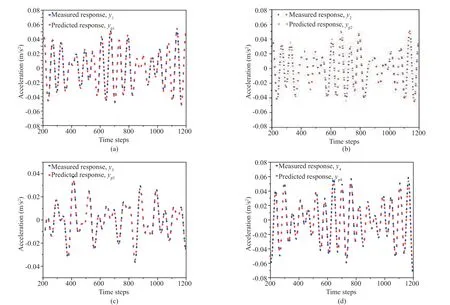
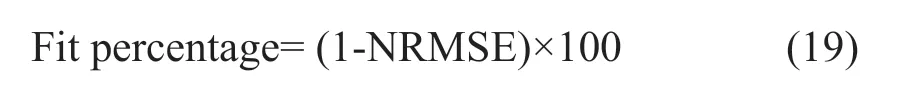
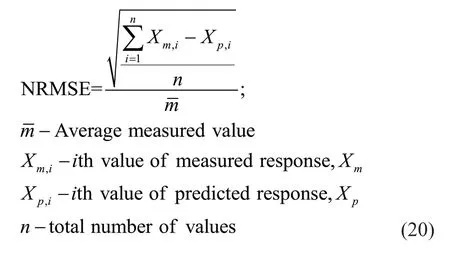
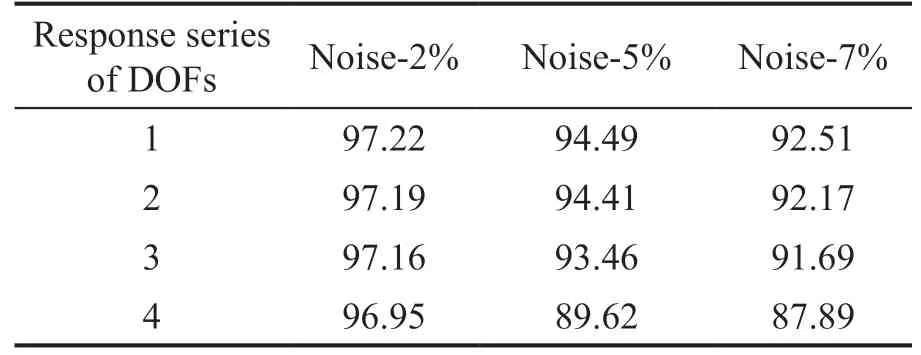
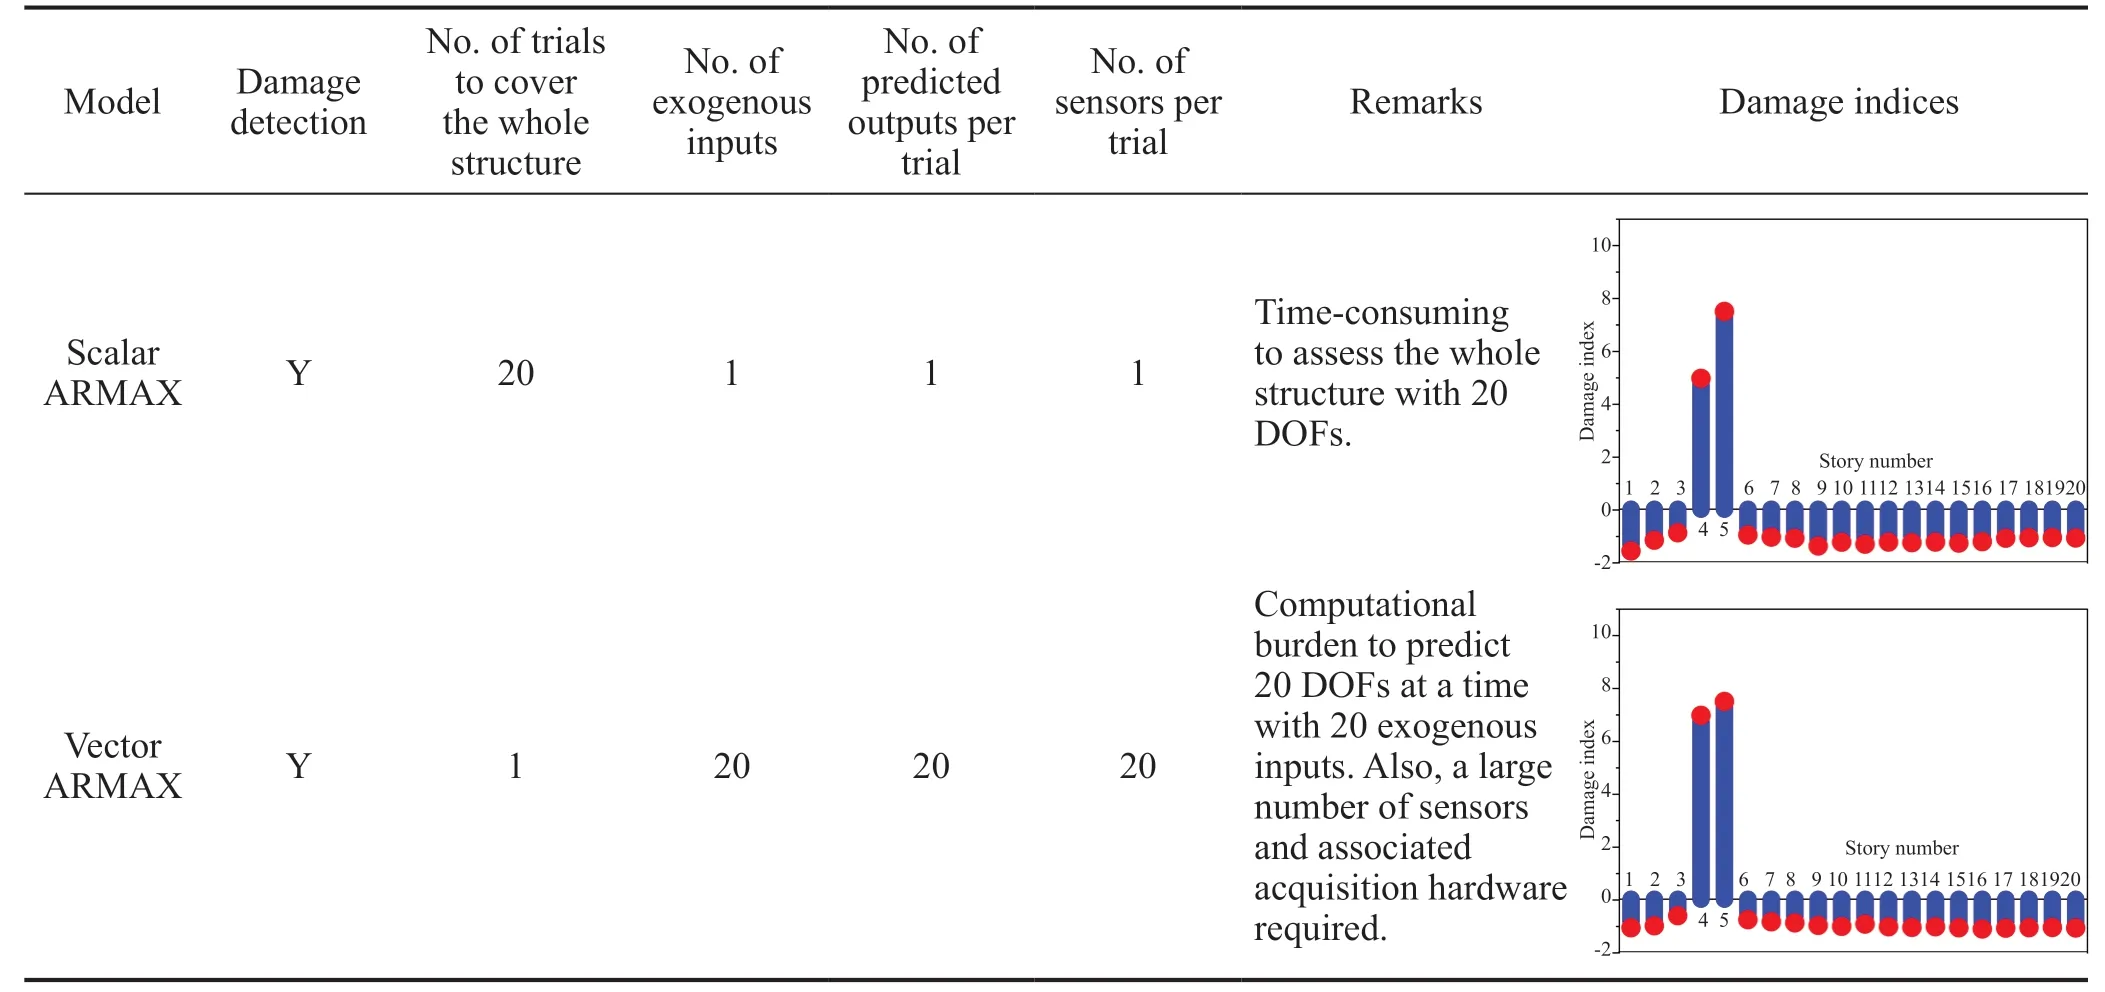
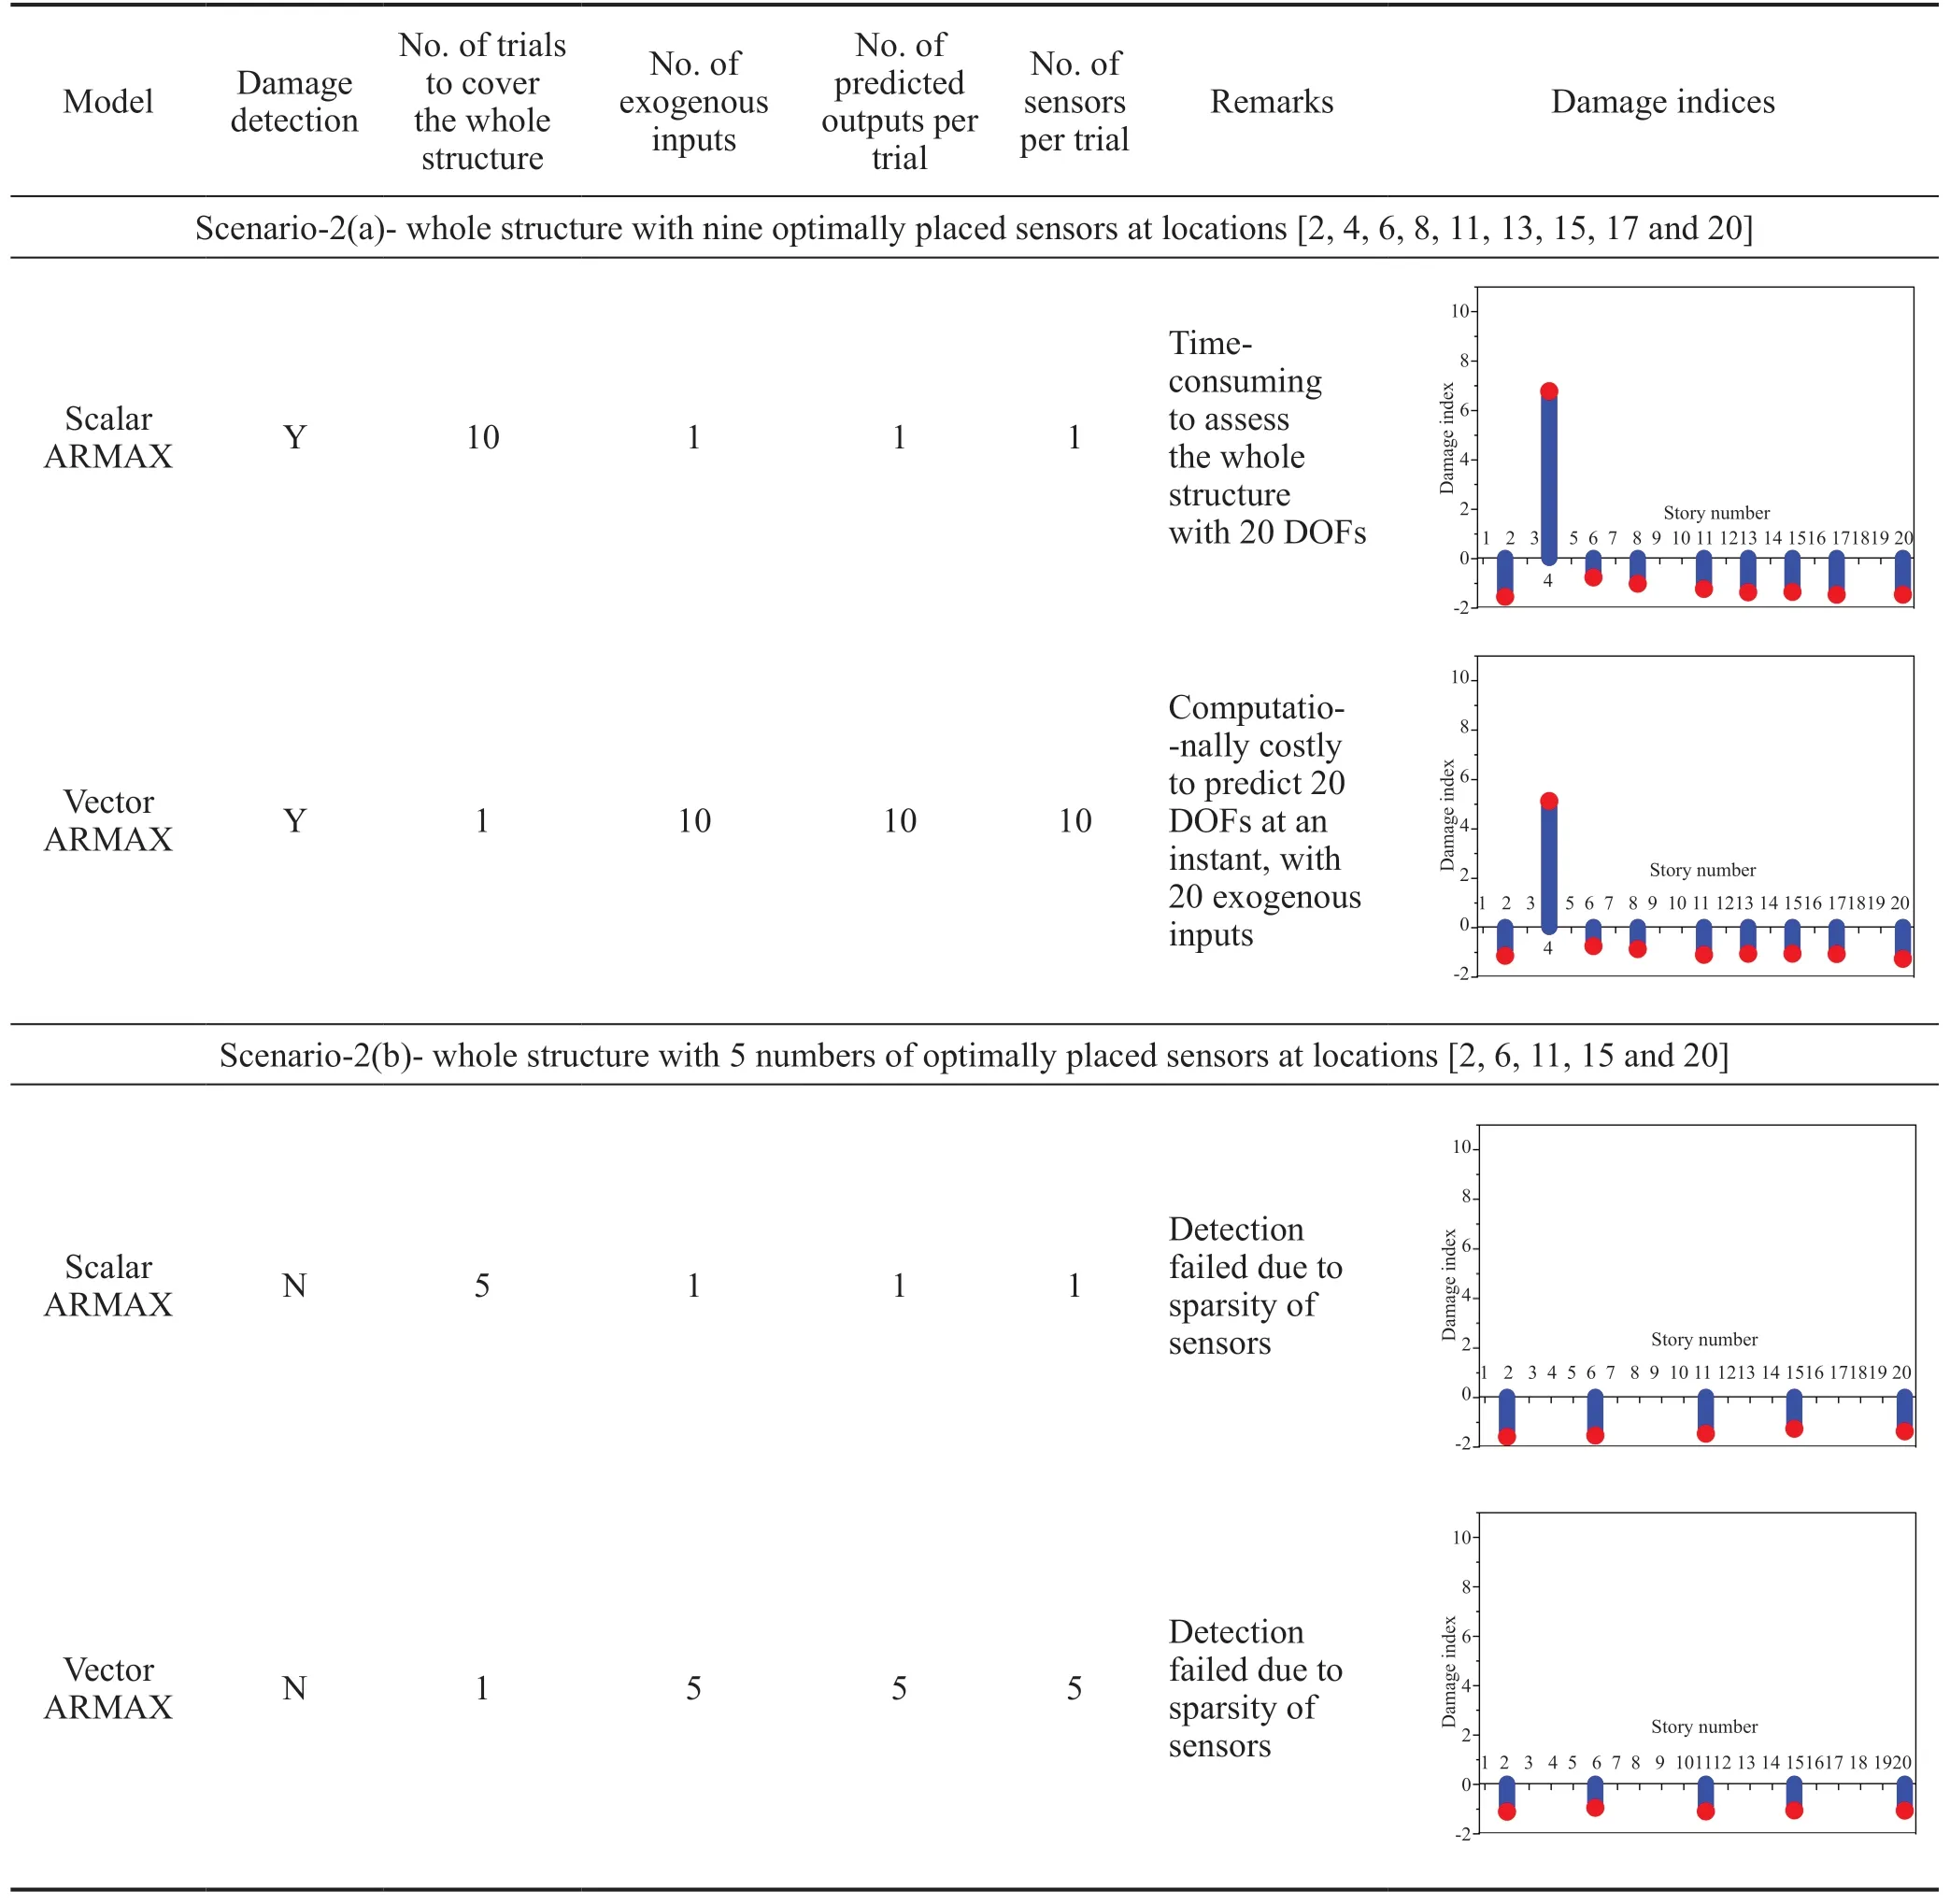
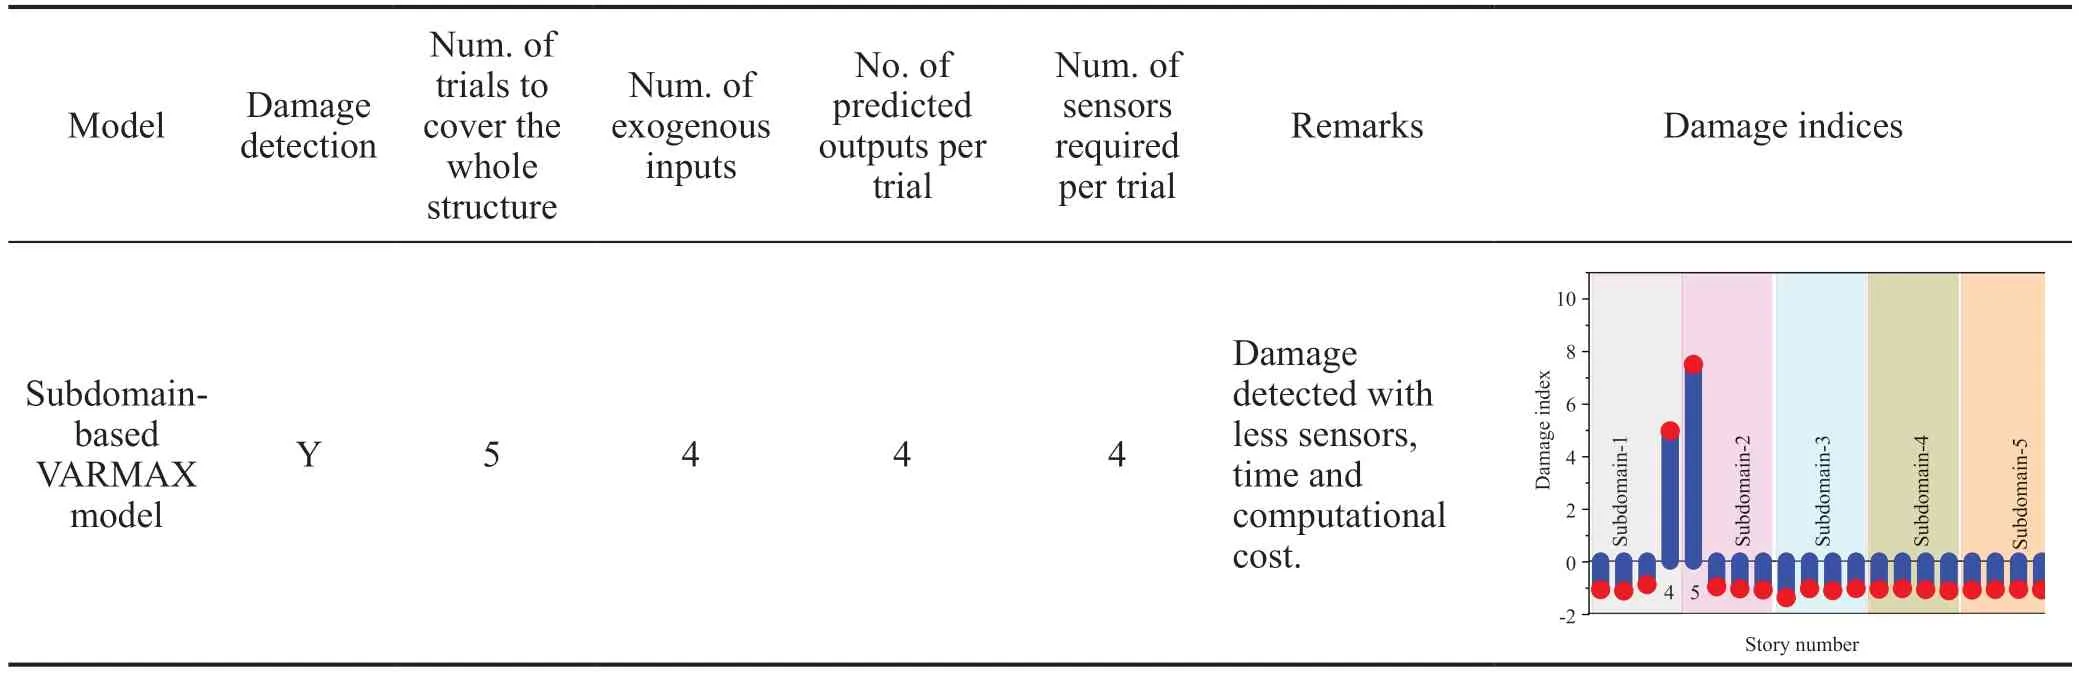
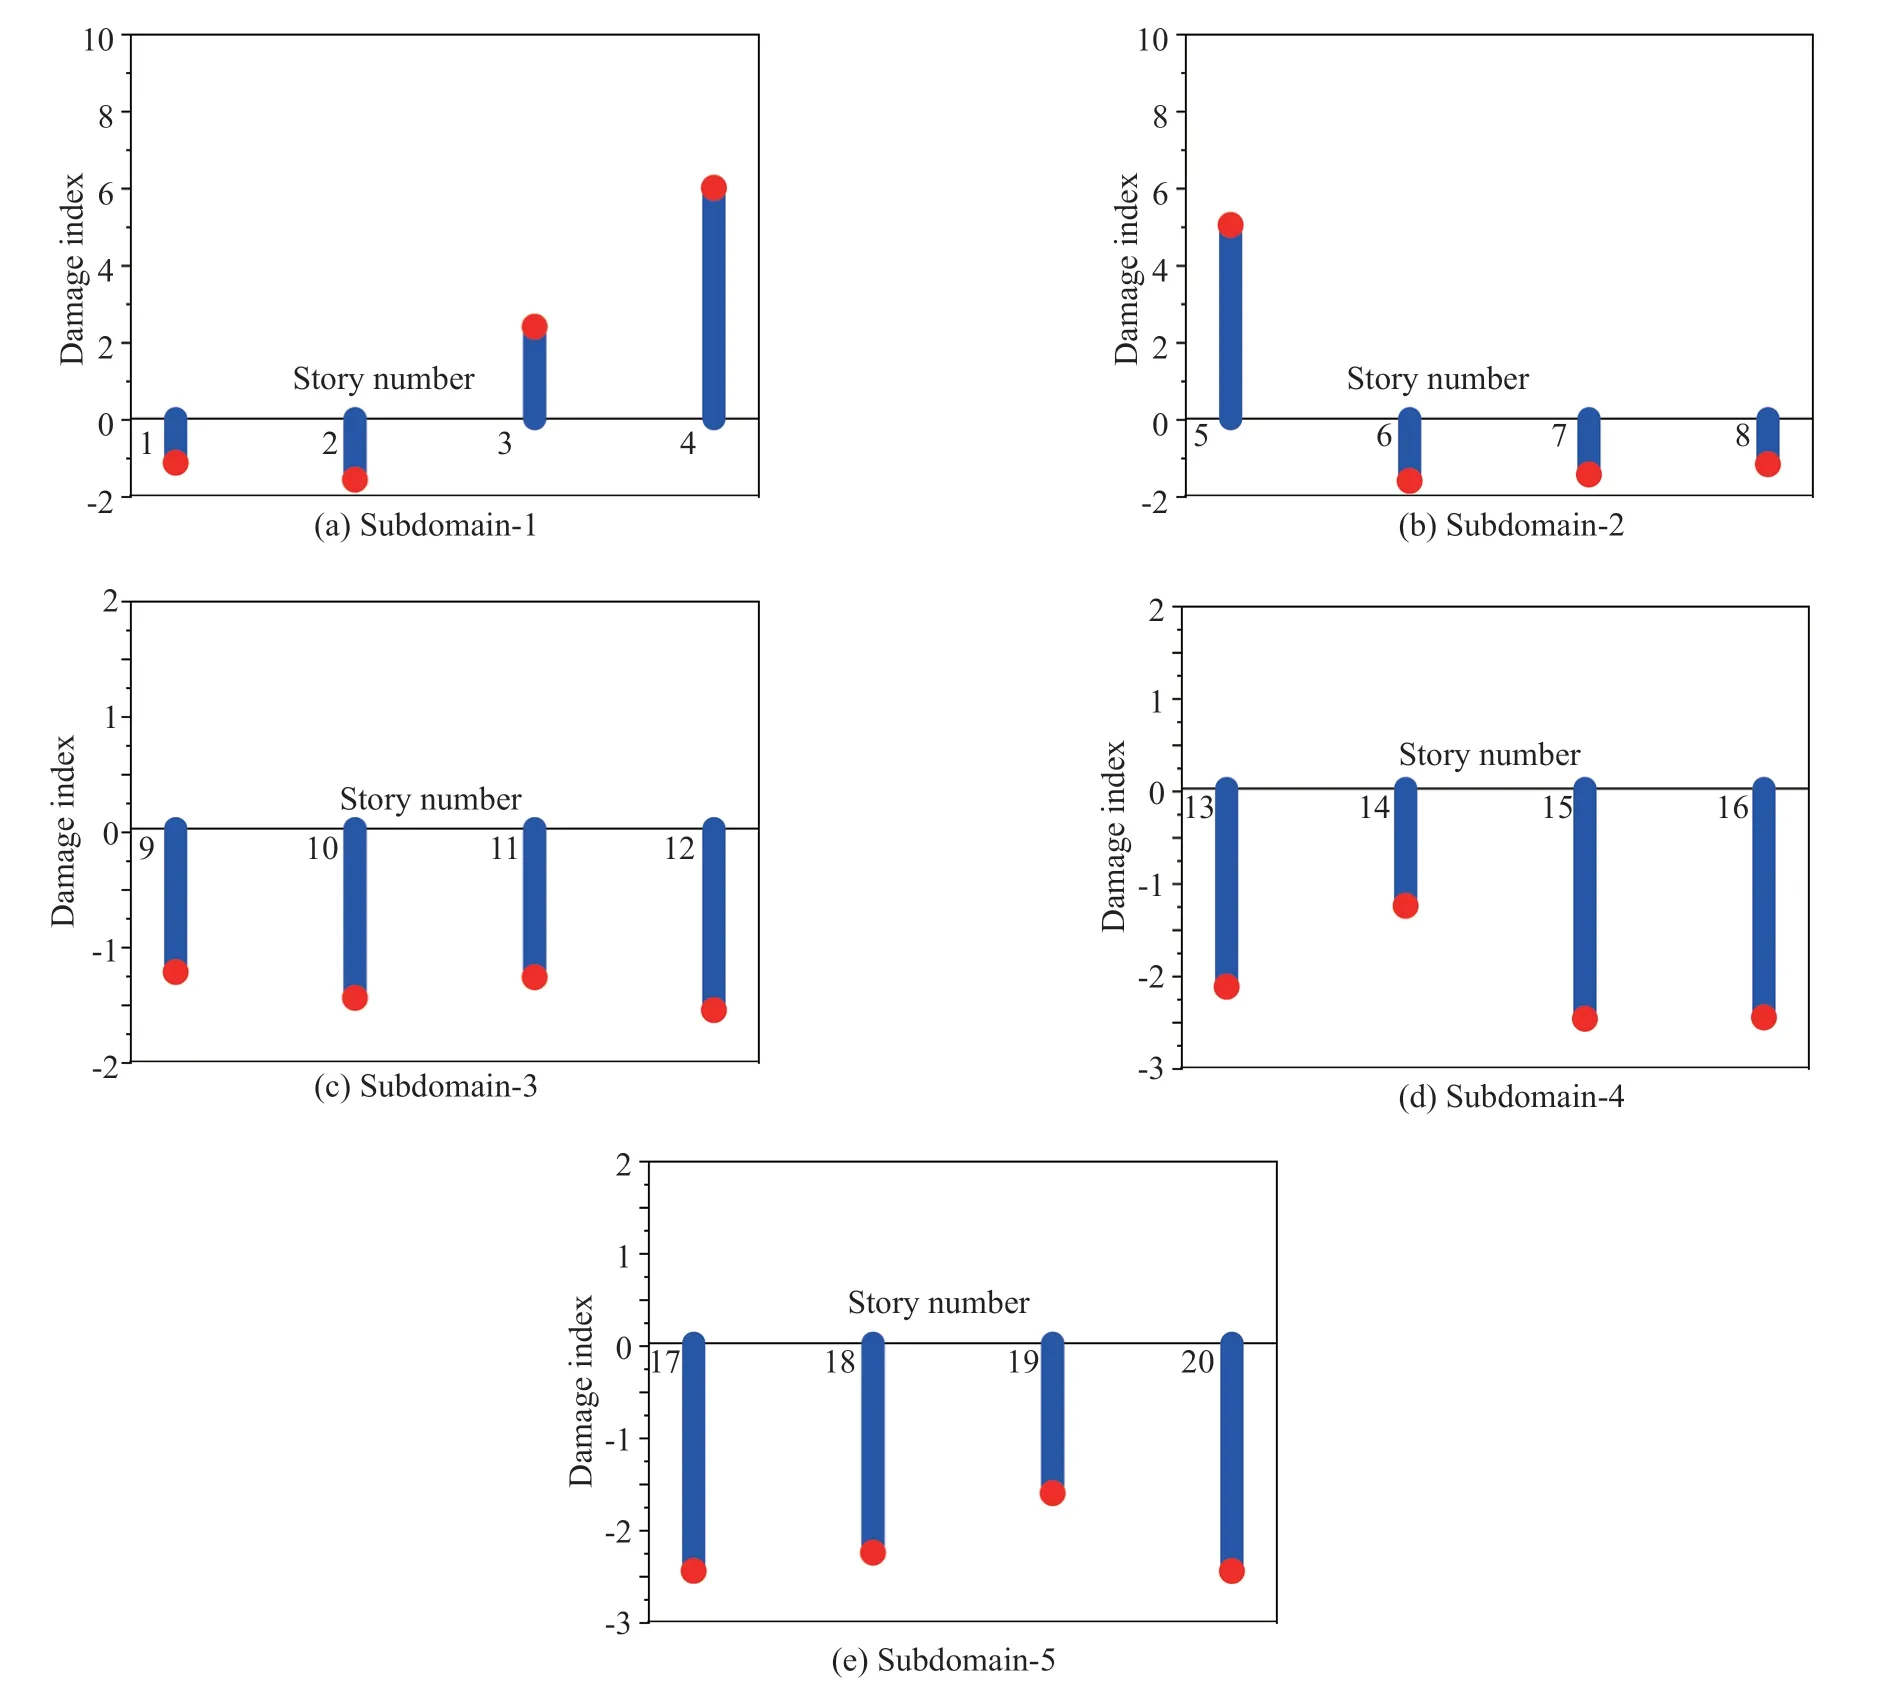
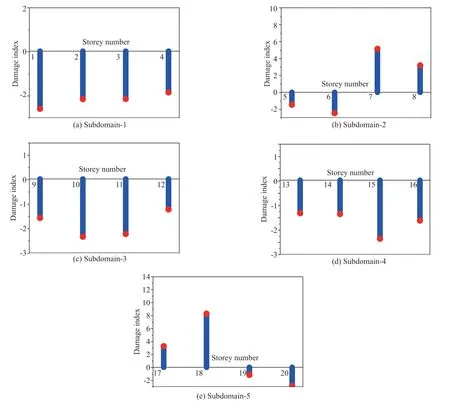
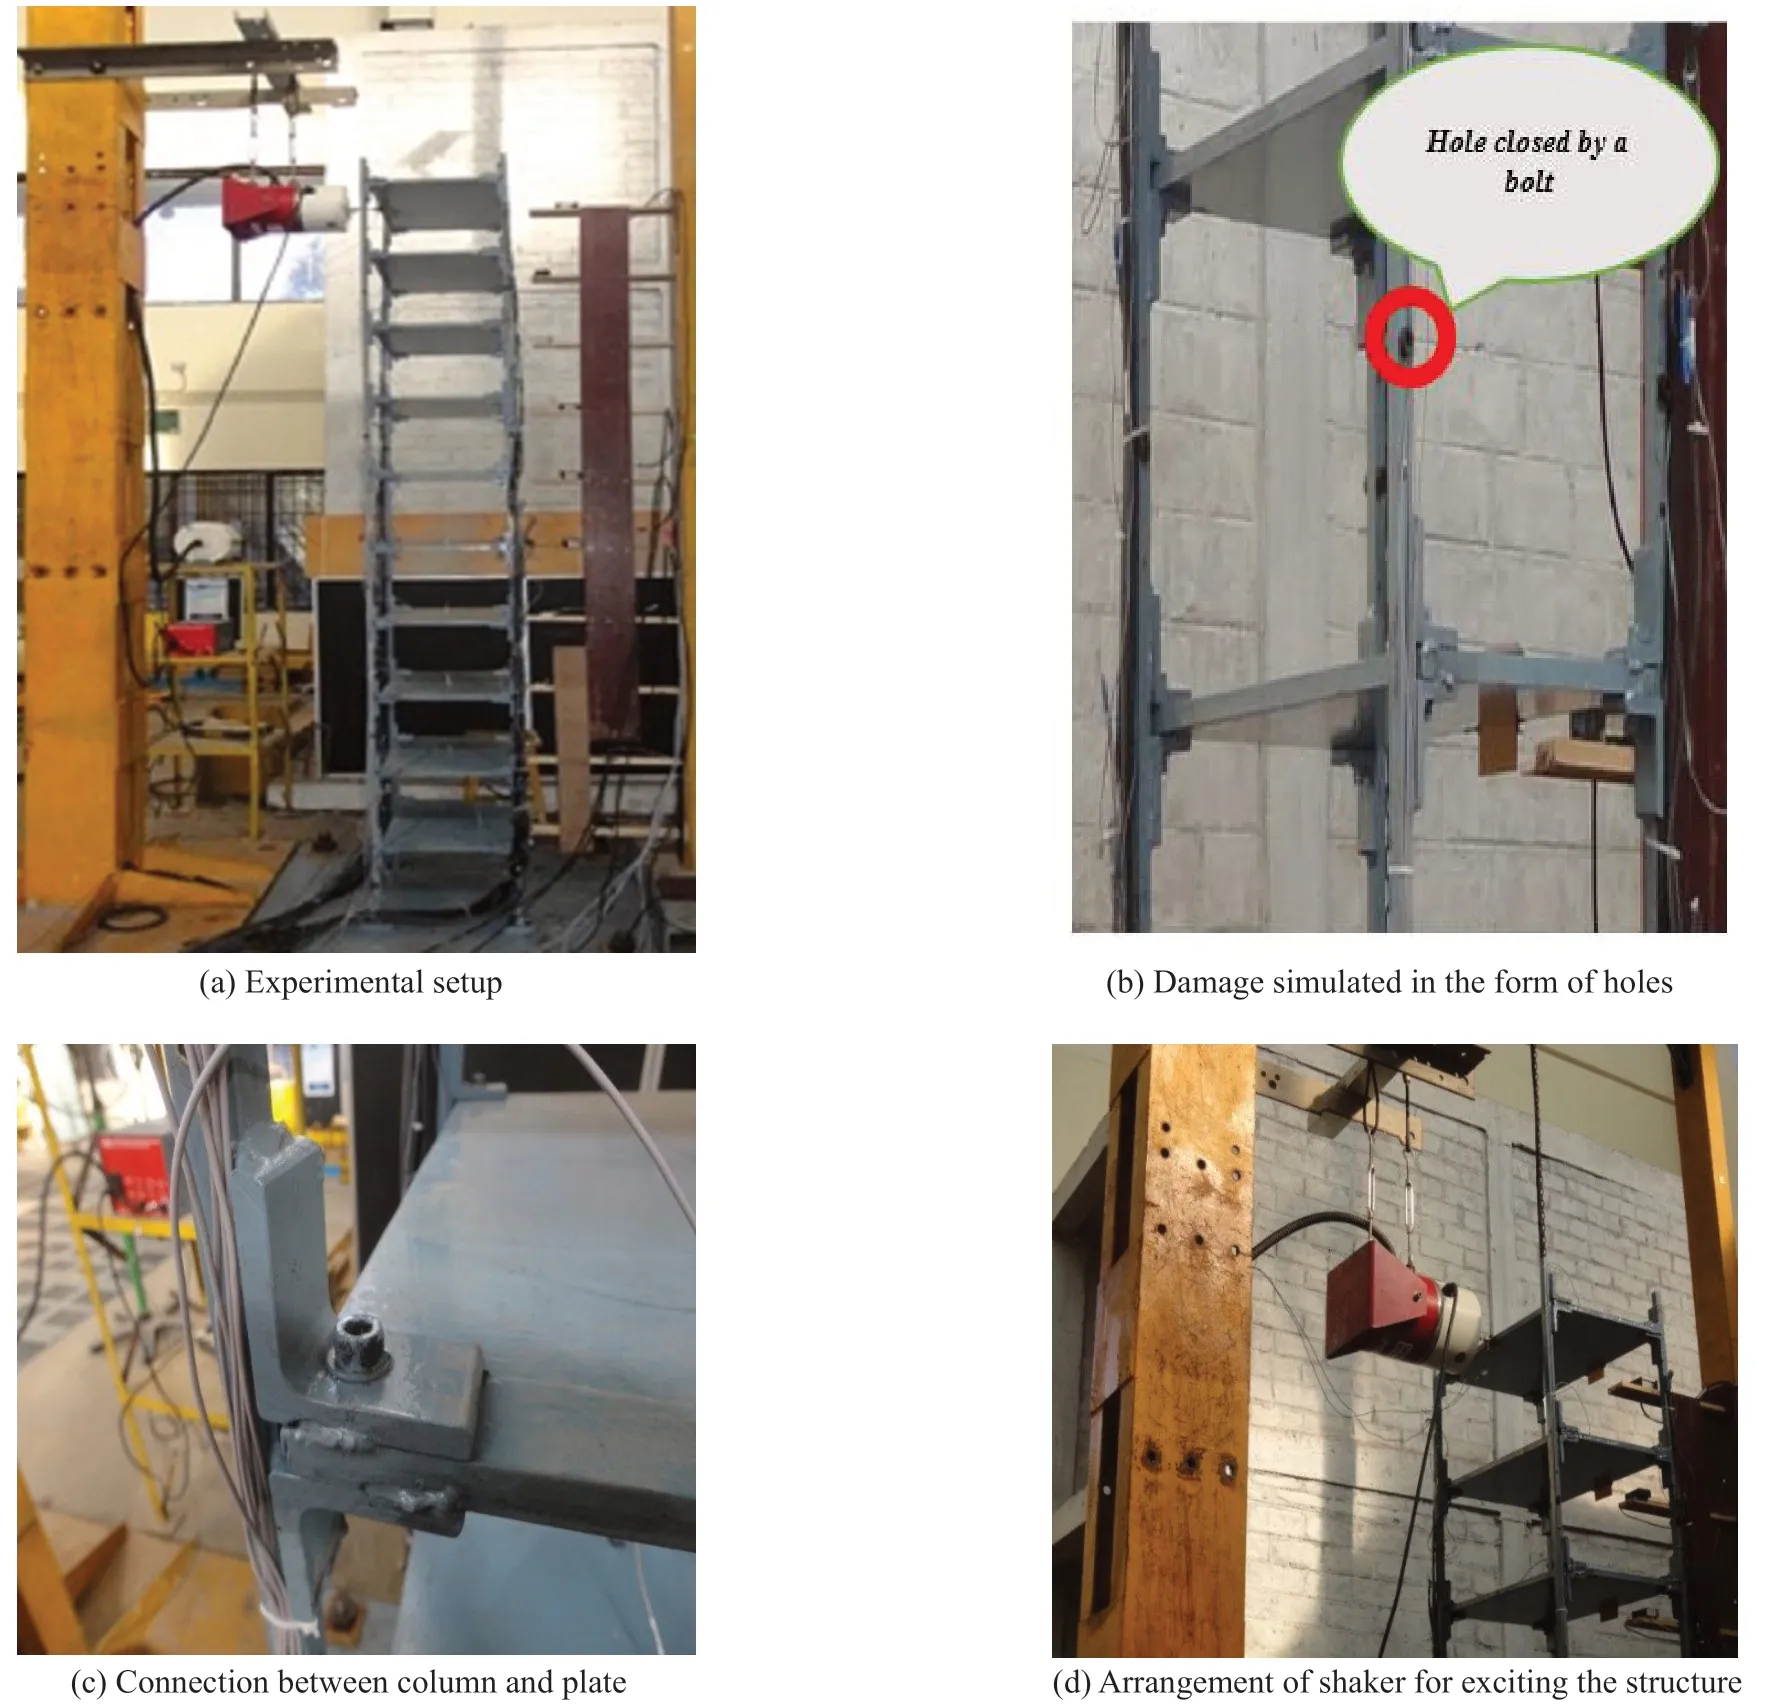
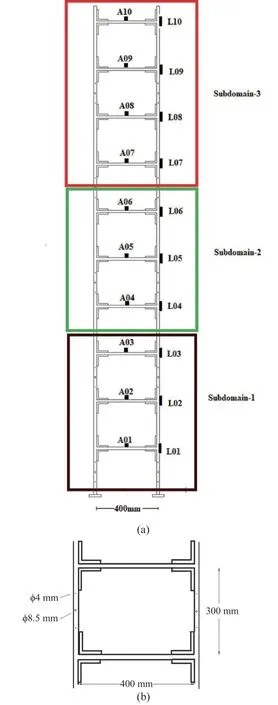
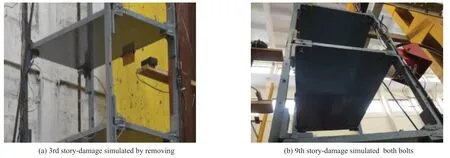
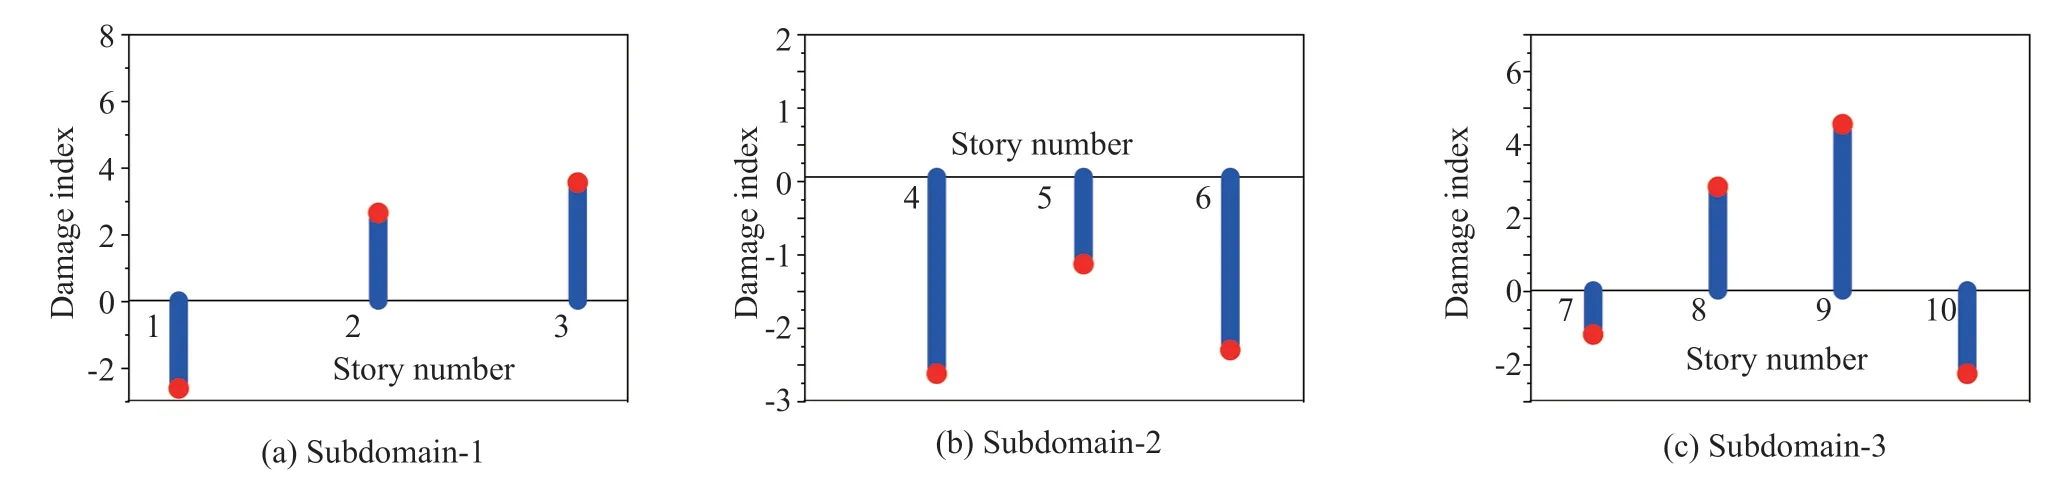
The termtis omitted in Eq. (3) for clarity. Considering only the first ‘p’ DOFs, wherep Considering only the first row of the matrix in Eq. (4), for analysis, it can be written as With the assumption that in a lumped mass model, the mass is distributed at the center of each degreeof-freedom, it can be considered that the off-diagonal entries of the mass matrix are zeros. Therefore, the term related to the mass and acceleration on the right side of Eq. (6) can be eliminated. Accordingly, Eq. (6) can be written in the matrix form as It can be seen from Eq. (7) that the acceleration of 1 topDOFs is related to the displacement and velocities of thepDOFs. It is well-known that the mea surement of the velocities and displacements are difficult in real scenarios and therefore, it is desirable to eliminate those terms. To do so, taking the second derivative of Eq. (7), is of great use, as the displacement terms become the acceleration terms that are amenable for output-only vibration techniques. By considering the time interval ast∆ and applying the forward difference method for a typical degree-offreedomiin Eq. (8), it can be written as Substituting Eq. (9) in typical DOF,i, of Eq. (8), If the terms related to damping and external force can be approximated as a first-order moving average process of white noise, Eq. (10) becomes Note that Eq. (11) consists of only the acceleration terms on both the left and right sides. Finally, after splitting the two terms, in the form of vector and matrix, Eq. (12) becomes: Now Eq. (11) in its full form withpDOFs and using Eq. (13) can be written as: It can be easily verified that Eq. (15) represents the form of the VARMAX model shown in Eq. (1) and similarly, the matrices in Eq. (15) are similar to matricesA,BandCof the VARMX model given in Eq. (1). It can be observed from Eq. (15) that the orders ofnaandncare taken as 1 whilenb=0. The above formulations indicate that in a shear-type structural unit, the responses of a few DOFs can be used as inputs to the VARMAX model to predict the responses of a group of other DOFs. In view of this, in this study, it is proposed that the prediction of the responses of a subdomain from the unknown state of the structure can be realized by using the responses of the subdomain from the known state of the structure as inputs to the VARMAX model. The parameters in the matrix,Q, of the exogenous inputs, which contain the stiffness and mass entries, indicate the structural properties. The changes in the dynamic state of the structure can be identified by tracking the changes in these models. Due to the confounding factors associated with ambient vibration due to wind, temperature, and operational loads, the damage diagnosis may often contain false alarms. To handle the effects of these confounding factors, control limits to absorb the changes in the dynamic state of the structure due to these confounding factors are developed and used in the present work during diagnosis. The complete step-by-step procedure associated with the proposed damage diagnostic algorithm is given in the next section. The proposed subdomain-based damage diagnostic technique is organized into two phases: (1) preparatory and (2) diagnosis. Initially, the entire framed structure idealized as a shear building model is divided into subdomains with a predefined ‘p’ number of DOFs in each subdomain. The details of the two phases associated with the proposed subdomain-based damage diagnostic algorithm with the VRMAX model are presented in the following subsections. In the preparatory phase, the following procedures are performed on each subdomain independently, when the structure is in the pristine state, to effectively organize the pristine measurements for future diagnosis. Primarily, in this phase, the control limits are formed for each subdomain. Basically, this control limit is established in such a way that the changes in the dynamic state of the structure due to environmental and operational variabilities such as temperature, wind loads, operational loads and mild seismic loads are covered. This control limit is essential to distinguish the actual damage from these confounding factors. However, note that the damage intensities within the ceiling limit is difficult to identify when such a control limit is established to handle the operational and environmental variabilities. In other words, this limit can indicate the sensitivity of the proposed technique. i. The acceleration time history responses of ‘p’ DOFs due to ambient loading are measured using accelerometers for each subdomain. These time history responses are measured considering several different rich numbers of instances with varied environmental/operational loads such as varied temperature levels and wind load scenarios. ii. Each dataset is partitioned into several subdatasets, with each sub-dataset consisting of a reasonable number of data points. The total number of sub-dataset is named as ‘nsubsets’. The data is partitioned to create a pool of datasets that represent the signals acquired under varied unknown environmental and operational conditions when the structure is in healthy condition. It also makes each dataset equal in length. iii. A control limit is established for each of the subdomains separately, using the sub-datasets formed in the previous steps. The step-by-step procedure to establish the ceiling limit for each subdomain is as follows: (a) Initially, in a subdomain, the first sub-dataset ‘SET-1’ is considered. It is paired with the next immediate subdataset, ‘SET-2’. The responses of SET-1 are treated as the inputs to the VARMAX model to predict the responses of SET-2. Accordingly, the responses of ‘p’ DOFs of ‘SET-1’ are predicted using the VARMAX model, with the responses of ‘p’ DOFs of the second sub-dataset, ‘SET-2’. The VARMAX parameters are estimated using the conditional maximum likelihood (CML) estimation method (SAS, 2017). The (conditional) log-likelihood equations are solved by iterative numerical methods such as quasi-Newton optimization. The starting values for the AR and MA parameters are obtained from the least-squares estimates. Although the small-sample properties of CML estimates might not be as good as the ML estimates, the CML method is much faster than the ML method. Depending on the sample size and number of parameters to be estimated, the CML method can be hundreds or even thousands of times faster than the ML method. The ‘p’ diagonal elements of the predicted parameters of the exogenous inputs, which consist ofKandMvalues of the respective floors, are extracted and represented asi=1:p. (b) Reversing the roles of ‘SET-1’ and ‘SET-2’, the VARMAX parameters are estimated similar to step (i). In other words, the responses of ‘p’ DOFs of ‘SET-2’are predicted using the VARMAX model, constructed with the responses of ‘p’ DOFs of ‘SET-1’ as inputs to the model. Similar to step (a), the diagonal elements of the coefficients matrix of exogenous inputs are extracted and thepnumber of diagonal elements are denoted as (c) An index vectorEis formed for each subdomain,j, with the normalized differences between theBvectors of each paired (SET-1 and SET-2) sub-datasets. (d) Step (a) to step (c) are repeated by using the ‘SET-1’ against the rest of the other available sets, i.e., (nsubsets-2) sub-datasets (i.e., excluding subdataset1 and sub-dataset2) in the baseline pool to fit two VARMAX models with each sub-dataset. The diagonal elements of the corresponding coefficient matrices of exogenous input are extracted and the index in Eq. (16) for each combination are evaluated. (e) In this way, each sub-dataset will form (nsubsets-1) combinations and thereby gives rise to (nsubsets-1) values of the index vectors,E, with a length equal topdegrees of freedom in the subdomain under consideration. With this, the total number ofEvectors for all the sub-datasets results in [nsubsets×(nsubsets-1)×p]. (f) The control limit of a subdomain is established with the assumption that changes in the dynamic state due to environmental and operational variabilities follows the normal distribution. For a typical subdomain ‘s’, the control limit vector,Vs, can be established as (g) Similarly, the procedures of the preparatory phase are carried out for all the pre-defined subdomains and control limits for each subdomain are established. These control limits are further used during the next phase, i.e., the diagnosis phase, to evaluate damage indices for each degree-of-freedom in a subdomain. In this phase, a new unknown (current) state of the same shear building is diagnosed by the following steps. i. The new recordings of time history acceleration responses from a subdomain are partitioned into several sub-datasets. The length of a sub-dataset must be kept equal to the sub-dataset created at the preparatory phase. ii. Each newly recorded current sub-dataset is paired with a randomly chosen sub-dataset in the baseline pool of the specific subdomain being investigated for damage. iii. The responses of ‘p’ DOFs of the baseline subdataset is given as input to the VARMAX model and the ‘p’ responses of the current sub-dataset are predicted using the VARMAX model and vice versa. iv. After VARMAX predictions, the diagonal elements of the coefficient matrices of the exogenous inputs are obtained as discussed in the earlier phase and the damage indexis computed for every DOF of the current data sub-dataset. i. In a subdomain, when the state of the structure is healthy and in the presence of environmental/operational variability, the damage indices of all the DOFs are expected to be within the established control limit of the subdomain. When damage is present in any particular story of a typical subdomain, the damage index of the corresponding DOF will indicate a positive value signifying the damage, while the damage indices of the rest of the DOFs of the subdomain will either be zero or negative. Therefore, positive damage index values of a typical story (DOF) in the subdomain under consideration indicates the spatial location of the damage. The time instant of the damage can be arrived at by counting the current sub-dataset number indicated by superscript c of the damage indexDIof the current data in which the damage is identified. Further, it is shown through numerical investigations (see Section 4) that with the proposed damage index,DI, the damage present in any typical story of a subdomain will not propagate to the adjacent stories or subdomains. Also, as the damage index is built using the parameters involving the stiffness values, the magnitude of the damage index helps to characterize the severity of damage, which is discussed in the numerical and experimental investigations presented later in the study. The complete damage diagnostic procedure using the proposed technique is shown in Figs. 1(a) and 1(b), in the form of a flowchart. The effectiveness of the proposed subdomains-based damage diagnostic technique is validated using both the numerical and experimental investigations presented in the following sections. To establish the compatibility of the VARMAX time series model with the vibration response (acceleration time-history), an attempt to predict the acceleration time-history data of a typical subdomain of the structure under consideration using the VARMAX time series is made and compared with the true response. Next, to establish the main motivation behind the proposed work, i.e., the need for a subdomain-based method and the ability of the VARMAX model to account for the subdomain-based technique is illustrated. Later, the ability of the VARMAX model-based subdomain technique to identify and characterize the damage in the presence of confounding factors such as environmental and operational variability as well as measurement noise is presented. A twenty-story framed structure, shown in Fig. 2, is considered for the numerical investigation. The framed structure is modelled as a shear-type building with the mass and stiffness of the first ten stories as 3000 kg and 4500 kN/m respectively. The mass and stiffness of the remaining top ten stories are considered as 2500 kg and 4000 kN/m, respectively. The first seven natural frequencies of the structure are 3.141 Hz, 9.403 Hz,15.598 Hz, 21.683 Hz, 27.620 Hz, 33.373 Hz and 38.913 Hz.Rayleigh damping is used to model the damping by applying a damping ratio of 1% to the first two modes of the structure. The random input force is applied on the 20th story of the framed structure. Newmark′s time integration technique is used to generate the acceleration time history responses of the framed structure. Both noise-free responses and noise-corrupted responses with measurement noise of 2%, 5% and 7%, respectively, are synthetically simulated with a sampling frequency of 1000 Hz. A typical random load and the response of the top story is shown in Fig. 3. Fig. 1(a) Flowchart of the preparatory phase of the proposed technique using the VARMAX model Fig. 1(b) Flowchart of the diagnosis phase of the proposed technique using the VARMAX model Fig. 2 20-story shear building model and identified subdomains To show the accuracy and compatibility of the VARMAX model with the acceleration time series, the first four DOFs are considered as one single subdomain and their measured acceleration time history responses are considered. The measured and predicted time history responses using the VARMAX model of the four DOFs with 2% noise are presented in Figs. 4(a)–4(d). It can be observed from Fig. 4 that the acceleration time history responses predicted using the VARMAX model show good agreement with the actual measured responses for all four DOFs. Also, to demonstrate the quality of fit by the model, a statistic that provides the measure of how well the response of the model fits the estimation data is used as shown in Eq. (19) Fig. 3 (a) Typical random load; (b) acceleration response in the top floor Fig. 4 Validation of the estimated model: one-step ahead prediction of acceleration response of (a) DOF-1 (b) DOF-2 (c) DOF-3 (d) DOF-4 where NRMSE is the normalized root mean square error measure given by: The fit percentages are evaluated for measured and predicted responses with varying noise levels and are shown in Table 1. It can be seen from Table 1 that the VARMAX model is compatible and accurately predicts the acceleration responses of the subdomain even with measurement noise. Table 1 Values of fit percentage metric Table 2 Diagnostic results of scenario-1- whole structure with sensors at all 20 DOFs To illustrate the need for a subdomain-based technique and suitability of the VARMAX model to account for the subdomain-based diagnosis, the following test scenarios are considered. I. Scenario-1: Damage diagnosis of the entire structure with sensors on all DOFs using both the scalar and Vector ARMAX models. II. Scenario-2: Damage diagnosis of entire structure using the both scalar and Vector ARMAX models with a reduced sensor-set using optimal sensor placement. III. Scenario-3: Damage diagnosis using the proposed VARMAX-based subdomain technique. In these studies, the damage is simulated in the 5th story by reducing the stiffnesses by 8%. For all three scenarios, irrespective of the time series model used, the procedure discussed in Section 3 is followed in the preparatory phase to evaluate the control limits and in the diagnostic phase to evaluate the damage index. In the preparatory process, the data is partitioned into small sub-datasets of 500 samples each. The partitioning of the data is primarily to create a pool of datasets that represent the signals acquired under varied unknown environmental and operational conditions. These subdatasets in the preparatory phase are used to evaluate the control limits of subdomains. The current data is initially generated without simulating any damage. After three seconds, the damage is simulated in the 5th story by reducing the corresponding story stiffness by 8%. The time history responses are generated, and the current data is divided into sub-datasets and are referred to as current subdatasets. The damage indices for all the current subdatasets are established, using the procedure outlined earlier in Section 3. The presence of damage can be established from the evaluated damage indices with positive magnitudes. In test scenario-1, the entire structure is chosen as a single domain and the proposed technique using scalar ARMAX and vector ARMAX models is employed for diagnosis. While using scalar ARMAX, each DOF is predicted by considering the response of the same DOF in the paired sub-dataset, as input to the ARMAX model. Accordingly, in scenario-1, the ARMAX model uses 20 trials to cover the whole building. In the case of VARMAX, the number of trials to cover the whole building is one. However, a VARMAX model predicts 20 output series, with 20 input series from all DOFs of the structure. The control limit and the damage indices are evaluated as discussed in Section 3. The results of the diagnosis of scenario-1, are presented in Table 2. The table provides details about the model used, the number of trials required to cover the whole structure, the number of inputs and predicted outputs for each model, the number of sensors required and the evaluated damage indices. From Table 2, it can be seen that if ARMAX is used for damage diagnosis, 20 trials need to be carried out, as the scalar model can predict only one response time series in each trial. Although ARMAX helps to diagnose the complete structure using a single sensor, the sequential process is tedious and timeconsuming. When the VARMAX model is used, the number of trials required to cover the whole structure is reduced to one, but the number of sensors required is 20. Even though the VARMAX model takes a single trial to assess the overall structure, the computational burden is enormous since the vector model predicts 20 separate response series, using 20 input series, at any instant. However, both the scalar and vector models of ARMAX can precisely identify the location of damage. It can be seen from scenario-1 that when the structure is large and considered as a single unit, the diagnosis with the scalar model is tedious and time-consuming, whereas the diagnosis with vector model is computationally costlier. In general, it is known that if the number of sensors placed on a structure are increased, the obtained information is more detailed, which helps in precisely localizing even subtle damage present in the structure. However, in many instances, the high cost of data acquisition systems and accessibility limitations constrain the use of a large number of sensors on a structure. To account for this, the limited sensors are placed judiciously on the structure so that the data collected can provide adequate information for the identification of the structural behavior (Rao and Anandakumar, 2007). For this purpose, optimal sensor placement algorithms are commonly used to provide optimal locations for judicially placing the available number of sensors such that the data collected can provide the maximum information with less or zero redundancy to identify the structural behavior. Different techniques can be employed to evaluate the suitability of sensor locations. Popular among them are energybased methods (Kammer and Brillhart, 1996; Rao and Anandakumar, 2007, 2008), information entropy or mutual information-based methods (Papadimitriouet al., 2000). Similarly, techniques based on structural modes (Kammer and Brillhart, 1996; Rao and Anandakumar, 2007, 2008; Papadimitriouet al., 2000) or proper orthogonal modes (Raoet al., 2014) can be employed in conjunction with the above methods to arrive at optimal sensor placement. In scenario-2, two tests are performed with a reduced set of sensors, where the number of sensors is limited to nine in the first test (scenario-2(a)) and five in the second test (scenario-2(b)). Accordingly, the optimal sensor locations are determined (Rao and Anandakumar, 2008) as [20, 17, 15, 13, 11, 8, 6, 4, 2] and [20, 15, 11, 6, 2] for the first and second tests, respectively. Both scalar ARMAX model and vector ARMAX model are constructed for the reduced sensor sets and the damage indices are evaluated. The results of the diagnosis of scenario-2(a) and 2(b) are presented in Table 3. It can be observed from Table 3 that the damage is identified using both the scalar and vector ARMAX models, in scenario-2(a), with nine optimally placed sensors at locations [2, 4, 6, 8, 11, 13, 15, 17 and 20]. However, the scalar model requires nine independent trials while the vector model employs a single trial to assess the whole structure. In scenario-2(b), both the scalar and vector ARMAX model-based techniques fail to identify the damage due to the sparsity of sensors. The lack of sensors near the damage location to capture the dynamic changes due to the damage affects the diagnosis. From the results of Table 3, it can be seen that limited sensors, optimally placed on the whole structure, reduce the computational burden, but both the scalar and vector ARMAX models fail to capture the complete damage information and corresponding locations when there is a sparsity of the sensors. In test scenario-3, the whole structure is divided into five subdomains with four DOFs in each subdomain. Accordingly, the first subdomain consists of DOFs 1-4, the second subdomain consist of DOFs 5-8, the third subdomain contains DOFs 9-12, the fourth subdomain consists of DOFs 13-16 and the last subdomain consists of DOFs 17-20. Note that the total number of sensors required to analyze all the subdomains, sequentially or independently, is four. The preparatory and diagnosis phases are executed to evaluate the damage indices for the DOFs in five subdomains. The results of the diagnosis of scenario-3, are presented in Table 4. The results in Table 4 show that under scenario-3, the subdomain-based technique using the VARMAX model can identify the damage using four sensors at every trial. Also, due to the formation of the subdomains, the computational burden is tremendously reduced per trial when compared to that of the whole structure. Additionally, the vector model is advantageous with a smaller number of DOFs to be predicted when compared to the total DOFs, especially when the structure is tall with a large number of degrees-of-freedom. Table 3 Diagnostic results of scenario-2- whole structure with optimally placed sensors Table 4 Diagnostic results of scenario-3- five subdomains on the structure From the results of scenarios 1-3, it can be concluded that in tall structures, an efficient way to capture the damage locations with reduced computational effort is to organize the structure into a convenient number of subdomains and operate a dense sensor network within each subdomain. Also, the vector model reduces the number of trials needed to assess the whole structure.This clearly illustrates the need for and the superior performance of the subdomain-based technique using the vector version of the ARMAX model for damage diagnosis of tall shear-type structures. The damage index plots shown in Table 2 correspond to the current sub-dataset with countcas 7, so the time instant of damage can be easily determined from the count of the current sub-datasets and the sampling frequency. This works out to be three seconds and is an exact match with the time of simulation of damage in the numerical example. To evaluate the proposed VARMAX algorithm with measurement noise, the time history responses are corrupted with varied levels of measurement noise ranging from 2% to 7%. The damage diagnosis is carried out as outlined earlier. The damage indices evaluated for every DOF of the subdomain-1 are indicated in Figs. 5(a)–5(c) for three noise levels. It can be observed from the damage index plots shown in Fig. 5 that the proposed technique can identify the damage, even with measurement noise, without any false positive indications. It is clear from the results of scenario-3 that the proposed subdomain-based technique with the VARMAX model identifies the damage with a minimum number of sensors, focused on the interesting portions of the whole structure. Also, the VARMAX model helps the prediction of more than one DOF at a time during diagnosis. To investigate the ability of the proposed damage diagnostic technique to identify multiple damage locations within a subdomain, damage is simulated in the 6th and 8th stories by reducing the corresponding story stiffnesses by 8% and 10%, respectively. It can be verified from Fig. 2 that both the 6th and 8th stories, where damage is simulated, belong to subdomain 2. Damage diagnosis is carried out using the procedure outlined in Section 2 and the damage indices of all four stories of subdomain-2, are shown in Figs. 6(a) and 6(b) considering measurement noise as 3% and 5%, respectively. The damage indices of other subdomain are not plotted as no positive magnitudes were observed. It can be seen from the plots shown in Fig. 6 that the proposed VARMAX model-based damage diagnostic algorithm can identify multiple damage locations within a subdomain, even with noise corrupted data. In this test case, the performance of the proposed technique to capture the presence of multiple damage locations in different subdomains is verified. Accordingly, the damage is simulated in two adjacent subdomains of the structure. Alternatively, another test case with damage simulated in the stories belonging to two non-consecutive subdomains is also considered in the investigation. First, the damage is simulated in the 4th story belonging to subdomain-1 and 5th story belonging to subdomain-2 with 10% and 8% of stiffness reduction, respectively. The time history measurements are corrupted with a measurement noise of 5%. The damage indices of all five subdomains are shown in Fig. 7. From Figs. 7(a) and 7(b), it can be observed that damage is present in the 4th and 5th story in subdomain-1 and subdomain-2, respectively, while the other stories remain intact. Further, the damage index of the 4th story of subdomain-1 (Fig. 7(a)) is higher when compared to the damage index of the 5th story of subdomain-2 (Fig. 7(b)), indicating that the severity of damage in the 4th story is higher than in 5th story of the structure. Fig. 5 Damage diagnosis of 20-story framed structure using the proposed VARMAX model-based algorithm: (a) damage indices of subdomain-1 with 2% measurement noise; (b) damage indices of subdomain-1 with 5% measurement noise; (c) damage indices of subdomain-1 with 7% measurement noise; (d) damage indices of subdomain-2 with 2% measurement noise;(e) damage indices of subdomain-2 with 5% measurement noise; (f) damage indices of subdomain-2 with 7%measurement noise Fig. 6 Damage indices of subdomain-2 of 20-story framed structure with multiple simulated damages, using the proposed VARMAX-based algorithm To verify the ability of the proposed damage diagnostic technique to identify the location of damage in non-consecutive subdomains, the damage is simulated in story number 7 belonging to subdomain-2 and story number 18 of subdomain-5 by reducing the corresponding story stiffnesses by 9% and 12%, respectively. The damage indices of all five subdomains are shown in Fig. 8. The spatial locations of damage can be clearly identified from the plots shown in Figs. 8(b) and 8(e) corresponding to subdomain-2 (7th story) and subdomain-5 (18th story), respectively, and these spatial locations are an exact match exactly with the stories where the damage was originally simulated. Further, it can also be observed from Fig. 8 that the damage index corresponding to the 18th story in Fig. 8(e) was higher when compared to the damage index of the 7th story shown in Fig. 8(b). It can be concluded from these investigations that multiple areas of damage located in a single subdomain or multiple subdomains can be identified using the proposed VARMAX-based damage diagnostic technique. Further, the proposed technique is also useful in characterizing the damage intensities of the structure located in different stories either belonging to adjacent or nonadjacent subdomains. Fig. 7 Damage diagnostics of 20-story framed structure using the proposed subdomain-based technique using VARMAX model,with multiple simulated damages in subdomain-1 and subdomain-2 The proposed subdomain-based damage diagnostic technique is validated using the results of laboratory experiments conducted on a 10-story steel-framed structure. The complete experimental setup is shown in Fig. 9. The structure is made up of steel plates of 400 mm × 300 mm × 16 mm connected to steel columns of 20 mm × 20 mm cross-section. The experimental setup of the steel-framed structure, locked in the testbed is shown in Fig. 9(a). An L-angle with a dimension of 75 mm × 75 mm × 10 mm is used to connect the column and slab as illustrated in Fig. 9(b). All the connections between the column and slab are welded to avoid torsion effects. The inner to inner slab height is 300 mm. The damage in the framed structure is simulated by drilling 4 mm and 8.5 mm diameter holes in all the columns of the 3rd and 9th story. One typical story of the experimental frame, with holes of 4 mm and 8.5 mm diameter in its columns and with the bolts covering these holes is shown in Fig. 9(c). The framed structure is instrumented using biaxial accelerometers to measure the floor accelerations along with the two horizontal directions. These biaxial accelerometers are placed in the center of the plates of each story to avoid the torsional modal responses. The excitation is given in the top story using the hydraulic shaker with a stringer arrangement. The experimental arrangement for excitation using the shaker is shown in Fig. 9(d). Random white noise excitation is used in the present experimental evaluation to simulate ambient vibration. Fig. 8 Damage diagnostics of 20-story framed structure using the proposed subdomain-based technique using VARMAX model, with multiple simulated damages in subdomain-1 and subdomain-2 and with measurement noise of 5% To demonstrate the proposed VARMAX-based subdomain damage diagnostic technique, the whole ten story framed structure is divided into three subdomains with DOFs 1-3 in the first subdomain, DOFs 4-6 in the second subdomain and DOFs 7-10 in the third subdomain. The schematic diagram of the steel frame with the locations of accelerometers and divisions of subdomains are shown in Fig. 10(a). As mentioned earlier, the damage simulation with 4 mm and 8.5 mm diameter holes in all the columns of the 3rd and 9th stories is also shown schematically, in Fig. 10(b). These holes are initially closed by bolts of respective sizes to represent a healthy baseline scenario. Fig. 9 10-story framed structure: (a) instrumented 10-story steel frame (b) healthy condition – 4 mm and 8.5 mm holes in columns closed with bolts (c) connection between column and plate (d) arrangement of shaker for exciting the structure The healthy acceleration time history data is generated by exciting the frame on the top floor with varying levels of input excitation. The sampling rate is considered as 2000 Hz. The acceleration timehistory data is collected and pooled after forming into subsets. After data acquisition, the feature extraction process is initiated. As the excitation is given in the long axis direction, the acceleration response along the same direction is considered for analysis. Initially, the preparatory phase as detailed in Section 3 is carried out and control limits are established for all the subdomains. Each sub-dataset consists of 500 samples. Once the control limits are established for each subdomain, the process of diagnosis is initiated. A single damage scenario is simulated by removing the bolts of both the holes in the 3rd story and exciting the frame along the direction of the longer axis. The acceleration time history data is collected from all 10 DOFs. The pristine and current measurements of the experimental framed structure are combined in such a manner that a current dataset is formed to simulate a scenario such that the damage has initiated after 5 s. Also, subdatasets are formed from the current dataset with 500 samples each. The current sub-datasets are evaluated and the damage indices for all the three subdomains are obtained following the procedure outlined in Section 3 under the diagnosis phase. The damage indices of all three subdomains of the experimental framed structure corresponding to the 11th sub-dataset, when the first positive valued damage indices are witnessed, are shown in Fig. 11. It can be verified from Fig. 11(a) that the damage indices of DOFs 2 and 3 show positive values of damage indices, which is a clear indication of the presence of damage in the 3rd story. Similarly, it is observed that the damage indices of the rest of the DOFs in subdomain-2 and subdomain-3 are negative, clearly indicating that these subdomains are free from damage. Also, from the sub-dataset number, the time instant of simulated damage is evaluated as in the previous example and found to be 5 s. Further, also it can be concluded from the plots shown in Figs. 11(b) and 11(c) that the damage in subdomain-1 will not propagate to the neighboring subdomains. Fig. 10 Schematic diagram of 10-story steel frame:(a) locations of accelerometers (A01-A10) and subdomains along the ten levels L1-L10 (b) damage in the form of holes of diameters 4 mm and 8.5 mm on the columns To investigate the effectiveness of the proposed algorithm with multiple damage in different subdomains, the damage is simulated by removing both the larger and smaller bolts in the 3rd story and the smaller bolts in the 9th story as shown in Fig. 12. The acceleration time history responses of all DOFs are collected from all the 10 stories of the experimental framed structure with simulated multiple damage of varying magnitude. The damage indices of all three subdomains are shown in Fig. 13. It can be observed from Fig. 13 that the damage index corresponding to the 3rd story in subdomain-1 presented in Fig. 13(a) and the damage index corresponding to the 9th story of subdomain-3 presented in Fig. 13(c) have positive values, clearly indicating the presence of damage in the respective spatial locations. Further, the damage indices of all the stories belonging to subdomain-2, presented in Fig. 13(b) are negative, indicating the healthy state of the corresponding stories of the experimental framed structure. This experimental investigation also gives a clear indication that the damage present in two subdomains (i.e., subdomain-1 and subdomain-3) does not propagate to subdomain-2. The magnitudes of the damage indices corresponding to the 3rd story of subdomain-1 shown in Fig. 13(a) and the 9th story of subdomain-3 presented in Fig. 13(c) clearly indicate that the severity of damage is higher in the 3rd story when compared to 9th story. This confirms the experimental simulation of larger damage inflicted in the 3rd story by removing the bolts of both larger and smaller holes and less damage by removing the bolt of a smaller hole in the 9th story. Fig. 12 Simulation of damage in the ten-story experimental framed structure by removing bolts in 4 mm and 8.5 mm holes Fig. 13 Damage diagnostics of ten story experimental framed structure: damage indices of all three subdomains with damage simulated in 3rd story and 9th story From the experimental investigations carried out on a ten-story framed structure, it can be concluded that the proposed VARMAX-based damage diagnostic technique can be effectively employed for damage diagnostics of framed structures by considering only a few stories at a time with a fewer number of sensors. Further, it can also be concluded that in addition to determining the time instant of damage and the spatial location of damage, the severity of damage in the structure can also be characterized. A decentralized damage diagnostic technique employing the VARMAX model is presented herein, which can be employed in tall buildings to identify and locate damage due to a number of factors including aging and after the occurrence of a natural event such as an earthquake. It is shown that the dynamic equilibrium equations associated with multi-degrees of the system of an idealized shear-building model of a framed structure can be partitioned into a set of subsets of equations. Each subset of dynamic equilibrium equations (i.e., submatrices) can be recast into a standard form of the VARMAX model by carrying out appropriate numerical manipulations. Using these theoretical formulations, a subdomainbased damage diagnostic algorithm using the VARMAX model is proposed. A new damage index to detect the presence of damage as well as the spatial location of the damage is also proposed. The proposed damage diagnostic technique is verified with two examples: a numerically simulated example of a twenty story framed structure and a laboratory-scale structure of a ten story frame. Based on the investigations, the following conclusions are drawn. i. The proposed subdomain-based damage diagnostic technique is formulated using the VARMAX model and therefore invariably inherits all the merits associated with this time series model over other popular time series models. ii. The technique uses the output-only responses arising from the ambient vibrations on high-rise structures and therefore does not require input excitation records. iii. The computational complexities can be drastically reduced during the diagnosis process as only a limited number of degrees of freedom in each subdomain are considered and the diagnosis is independently carried out. Therefore, the proposed damage diagnostic technique can be highly adaptive to handle spatially large high-rise buildings, with fewer sensors and data handling/processing issues. iv. The proposed damage diagnostic technique can be used for only a portion or selected stories of a tall building, such as an area that has been identified as a critical or vulnerable portion, leaving out the rest of the stories of the structure. v. Both the numerical and experimental studies confirm the effectiveness of the method and its robustness to measurement noise. vi. The newly proposed damage index can effectively handle the confounding factors associated with operational and environmental variabilities to avoid a false-positive diagnosis. vii. The proposed algorithm can detect the presence of damage, i.e., the exact time instant of damage as well as the spatial location of the damage. In addition, the proposed algorithm can also characterize the damage intensity, especially during multiple damage scenarios. viii. Both numerical and experimental investigations clearly indicate that the damage present in one subdomain will not propagate or affect the healthy state of an adjacent subdomain ix. The proposed decentralized damage diagnostic technique can only be applied in tall buildings that can be idealized as a shear building model. Acknowledgement This study is being published with the permission of the Director, CSIR-SERC, Taramani, Chennai-600113, Tamilnadu, India.


3 Damage diagnostic methodology
3.1 Preparatory phase


3.2 Diagnosis phase
4 Numerical investigations

4.1 VARMAX model prediction accuracy with acceleration data
4.2 Need for subdomain-based method and the suitability of the VARMAX model for ubdomain-based methods
4.3 Scenario-1: Damage diagnosis of whole structure with sensors on all DOFs using both scalar and vector ARMAX model
4.4 Scenario-2: Damage diagnosis of whole structure using both scalar and vector ARMAX model with the reduced sensor-set using optimal sensor placement
4.5 Scenario-3: Damage diagnosis using the proposed VARMAX-based subdomain technique
4.6 Multiple damage within a subdomain
4.7 Multiple damage in different subdomains


5 Experimental verification of a 10 story framed structure
5.1 Single damage scenario
5.2 Multiple damage scenario
6 Conclusions
杂志排行

Earthquake Engineering and Engineering Vibration的其它文章
- Dynamic shear modulus and damping ratio characteristics of undisturbed marine soils in the Bohai Sea, China
- Geotechnical engineering blasting: a new modal aliasing cancellation methodology of vibration signal de-noising
- Response prediction using the PC-NARX model for SDOF systems with degradation and parametric uncertainties
- Probability-based analytical model for predicting the post-earthquake residual deformation of SDOF systems
- Seismic behavior of multiple reinforcement, high-strength concrete columns: experimental and theoretical analysis
- Numerical study of a multiple post-tensioned rocking wall-frame system for seismic resilient precast concrete buildings