Seismic behavior of multiple reinforcement, high-strength concrete columns: experimental and theoretical analysis
2022-04-15XingGuohuaWangHaonanandOsmanOzbulut
Xing Guohua, Wang Haonan and Osman E. Ozbulut
1. School of Civil Engineering, Chang′an University, Xi′an 710061, China
2. Department of Engineering Systems and Environment, University of Virginia, VA 22904, USA
Abstract: This study investigates the seismic performance of multiple reinforcement, high-strength concrete (MRHSC) columns that are characterized by multiple transverse and longitudinal reinforcements in core areas. Eight MRHSC columns were designed and subjected to a low cycle, reversed loading test. The response, including the failure modes, hysteretic behavior, lateral bearing capacity, and displacement ductility, was analyzed. The effects of the axial compression ratio, stirrup form, and stirrup spacing of the central reinforcement configuration on the seismic performance of the columns were studied. Furthermore, an analytical model was developed to predict the backbone force-displacement curves of the MRHSC columns. The test results showed that these columns experienced two failure modes: shear failure and flexure-shear failure. As the axial compression ratio increased, the bearing capacity increased significantly, whereas the deformation capacity and ductility decreased. A decrease in the spacing of central transverse reinforcements improved the ductility and delayed the degradation of load-bearing capacity. The proposed analytical model can accurately predict the lateral force and deformations of MRHSC columns.
Keywords: high-strength concrete; multiple reinforcement columns; seismic behavior; theoretical model; cyclic loading test
1 Introduction
Numerous studies have indicated the significance of confinement reinforcement for the bearing capacity and ductility of reinforced concrete (RC) columns (Martinezet al., 1984; Sakai and Sheikh, 1989; Sheikh and Toklucu, 1993; El-Tawil and Deierlein, 1999; Kim and Park, 1999; Lambert-Aikhionbare and Tabsh, 2001; Hindiet al., 2005; Honget al., 2006; Marvelet al., 2008; Shihet al., 2013; Chenet al., 2017). Previous studies have indicated that the configuration of multiple spiral stirrups and new composite stirrups inside traditional RC columns can effectively constrain core concrete and longitudinal reinforcement, and significantly improve axial load-bearing capacity and ductility (Marvelet al., 2014; Lianget al., 2014; Jinget al., 2016; Liet al., 2017).
Many researchers have investigated the seismic performance of members or structures equipped with various complex stirrups (Thomson and Wallace, 1994; Watsonet al., 1994; Tanakaet al., 1996; Saatcioglu and Grira, 1999; Yashiroet al., 2000; Paultreet al., 2001; Budeket al., 2002; Bayrak and Sheikh, 2004; Hwang and Yun, 2004; Hindi and Turechek, 2008; Yinet al., 2012; Hindi, 2013). Results showed that these columns demonstrate good ductility and energy dissipation capacity. This indicates that the complex stirrup form can significantly influence the seismic behavior of RC columns under different axial compression ratios. Hindi and Turechek (2008) conducted a reversed cyclic loading test on circular concrete columns constrained by cross spiral stirrups and explored the effect of stirrup spacing and stirrup forms on lateral bearing capacity and ductility. Their results showed that the stirrups in the core areas did not fracture until the end of the test and that stirrup configurations can improve the ductility of concrete columns. Yinet al.(2012) proposed an innovative multispiral confinement to enlarge the confined area of an RC column containing a rectangular section. Through reversed cyclic loading tests, they observed that the interlocking, multi-spiral confinement design exhibited higher lateral bearing capacity and ductility than a rectilinear hoop confinement design. Wanget al.(2011) developed a novel reinforcement arrangement called “S-Clip.” They studied the seismic performance of bridge piers designed with conventional combined stirrups and with the “S-Clip” stirrups. The results indicated that the novel reinforcement arrangement can improve ductility while maintaining a similar load-carrying capacity as a conventional design.
High-strength concrete (HSC) has been conveniently available for various types of practical engineering applications such as high-rise buildings, bridges, and special structures (Sheikhet al., 1994). However, the use of HSC in earthquake-resistant components may reduce ductility owing to its inherent brittleness (Azizinaminiet al., 1994). Therefore, the application of multiple reinforcement, high-strength concrete (MRHSC) in the core areas can be an effective method for improving the overall seismic performance of a traditional RC column. MRHSC columns are characterized by a multiple composite arrangement of longitudinal reinforcements and complex transverse reinforcements for confining core concrete.
The need for columns with higher axial load-carrying capacity and a minimal cross-sectional area has increased owing to limitations on space for high-rise or largespan frames. Considering this, the authors proposed a new multiple reinforcement configuration in core areas for MRHSC columns. This configuration consists of transverse reinforcements, with rectangular or circular shapes in core areas. Several longitudinal bars are placed inside transverse reinforcements so that these can be confined by surrounding transverse reinforcements. Information on the seismic behavior of MRHSC columns from previous studies is limited. The confining effects of various stirrup forms on core concrete are not well understood. This study experimentally investigated the seismic behavior of innovative MRHSC columns with different design parameters, such as axial compression ratio, stirrup form, and stirrup spacing. In addition, a computational prediction model was established to calculate backbone curves of MRHSC columns, based on test results.
2 Experimental programs
2.1 Specimen details
Eight reduced-scale MRHSC columns were designed and fabricated according to Chinese code (GB 50011-2010, 2016). These were then tested under a combination of constant axial and cyclically reversed horizontal loads. The columns had a square crosssection of 400 mm × 400 mm. The distance from the stub top to the point of lateral loading was 1200 mm, which amounted to an aspect ratioλof three. Figure 1 presents the geometrical and reinforcement layout for the test columns whose cross-sections were divided into four parts: the unconfined area, the single confinement area, the double confinement area, and the triple confinement area. The single confinement area was square shaped, with dimensions of 352 mm × 352 mm. The circular double and triple confinement areas had diameters of 280 mm and 140 mm, respectively, whereas the rectangular double and triple confinement areas were maintained constantly at 280 mm × 280 mm and 140 mm × 140 mm, respectively. The outer longitudinal reinforcements of each specimen consisted of forty bars, with a diameter of 12 mm. Meanwhile, the longitudinal reinforcements of the double and triple confinement areas diameters of 8 mm. Similarly, the transverse reinforcements of the single confinement area consisted of bars with diameters of 8 mm each, whereas the inner confinement reinforcements had diameters of 6 mm.
Table 1 presents in detail the physical parameters of the test columns. The first specimen is a control specimen (called CC). It has a single confinement area that is provided by rectangle stirrups. The remaining specimens were named as follows: The first character “C” represents “column”. The second group of characters signifies the confinement type in the inner core areas. Herein, “C” represents a single circular hoop, “DC” represents a double circular hoop, “SC” denotes a combination of spiral and circular stirrups, “DR” denotes a double rectangular hoop, and “RC” represents a combination of rectangular and circular stirrups. In addition, “HA” represents a high axial compression ratio. The final number in each specimen name (100 or 200) indicates the stirrup spacing of double and triple confinement areas.
Figure 2 demonstrates the main construction process of the specimens. First, all the steel reinforcements, including stirrups and longitudinal reinforcements, were fabricated. Next, the steel reinforcements were arranged and banded accurately based on the design details of test specimens. Finally, the MRHSC columns were integrally cast with the footings. It should be noted that the formwork and reinforced cages were tapped with hammers to generate vibration to help fill the voids during pouring.
2.2 Material properties
Strength grade C50 concrete was used in the test columns. In compliance with the Chinese code GB/T 50081-2019 (2019), three groups of 150 mm × 150 mm × 150 mm cubes were fabricated and stored in a laboratory along with the columns. Compressive tests on the collected cubic specimens were conducted before the cyclic reversed loading test on the column specimens was carried out. The average compressive strength of the standard cubic specimens was 54.3 MPa. The compressive strength of the concrete cylinders was estimated to be 43.4 MPa by multiplying cubic compressive strength with a coefficient of 0.8. Three types of steel reinforcements were used in the test columns. The mechanical properties of these reinforcements are provided in Table 2.

Table 1 Physical parameters of the specimens

Table 2 Mechanical properties of steel reinforcements
2.3 Test instrumentation
Figure 3 presents the schematic diagram of the test instrumentation. A vertical constant axial load was applied on all columns via a hydraulic jack with a capacity of 5000 kN. The jack was installed beneath the rigid girder so that it could move smoothly along a sliding plate in a horizontal direction. Moreover, reversed lateral displacements were applied through a 1000 kN MTS actuator that recorded and monitored the applied horizontal force. Two rigid anchorage beams and four threaded bolts were fixed on the upper surface and both sides of the footing stub, respectively, for each column, to prevent sliding and overturning of the column footing relative to the ground. Three linearly variable differential transducers (LVDTs) were fixed at specific positions to measure horizontal displacements of the test column. Another LVDT was fixed on the footing stub throughout the test to monitor the sliding of the column relative to the ground. The arrangements of these four LVDTs are displayed in Fig. 4.

Fig. 1 Design details of test specimens

Fig. 2 Photographs showing the main construction process
2.4 Test procedure
An increasing displacement-controlled loading protocol was used to conduct the test, in accordance with the Chinese seismic testing standard JGJ/T 101-2015 (2015). The axial compression load was increased at a rate of 2 kN/s to the targeted value and maintained at this level for the remainder of the test. To inspect the stability of the axial force during test loading, a force transducer was used to constantly monitor the axial force that could have a substantial influence on test results.
Based on the Chinese Code JGJ/T 101-2015 (2015) and research by Hindiet al. (2008), four single loading cycles with displacement amplitudesΔof 2 mm, 4 mm, 6 mm, and 8 mm were initially applied. Then, three cycles at each level of increasing displacement were applied when displacement attained 10 mm. The loading protocol is shown in Fig. 5. The tests were terminated when the lateral load-bearing capacity of a specimen in the first cycle decreased to below 85% of the experienced maximum load in both loading directions.

Fig. 3 Test setup

Fig. 4 Layout of LVDTs

Fig. 5 Loading program
3 Experimental results and analysis
3.1 Overall process and failure modes
The crack distributions and failure modes for the tested columns are shown in Fig. 6. The eight MRHSC columns experienced two typical failure modes: the flexural-shear failure mode and the shear failure mode (Xinget al., 2020).

Fig. 6 Crack distributions and failure modes
For the specimens that experienced the flexural-shear failure mode, horizontal bending cracks and diagonal shear cracks were observed on the side face of the column specimen. In addition, yielding of longitudinal reinforcements and crushing of concrete in compression occurred when the column failed. Meanwhile, no diagonal shear cracks were observed before the corresponding peak loads were attained for the specimens that failed in shear failure mode. However, diagonal shear cracks developed rapidly after peak loads, until the specimen completely failed.
The MRHSC columns subjected to a low axial force (tN=1270 kN) experienced the typical flexural-shear failure mode. In the early stage of the testing, several minute horizontal cracks appeared at the bottom of the column. With an increase in applied tip displacement, the initial flexural cracks developed horizontally on the tension side in the plastic hinge and widened. As tip displacement continuously increased, the initial horizontal cracks propagated diagonally. Meanwhile, the diagonal cracks widened and propagated faster than the flexural cracks. X-shaped cross crack bands were observed on the side face owing to reversed loading. Eventually, diagonal and transverse cracks adequately widened. Meanwhile, extensive crushing of the concrete cover and marginal buckling of exposed longitudinal rebars were observed. This indicated that the columns subjected to a low axial force (tN=1270 kN) failed in the flexural-shear mode. No apparent difference in the failure process could be observed for the specimens C-DC-100, C-DR-100, C-RC-100, and C-SC-100 with different stirrup forms. Furthermore, their crack patterns were similar. This indicated that the confined form of stirrups in the core area had a negligible effect on the failure mode of the MRHSC columns.
The specimen C-DC-HA-100 subjected to a high axial force (tN=3180 kN) experienced the shear failure mode. At the beginning of the testing process, the shearcritical column displayed a hysteresis response and crack distribution in a manner like those of the columns that underwent bending-shear failure. The cracking displacement of C-DC-HA-100 was larger than that of C-DC-100. This indicated that a larger axial force could more effectively constrain the cracking of the column. As imposed displacement increased, the existing cracks widened, propagated obliquely, and formed diagonal cracks until maximum lateral force was attained. Subsequently, the diagonal cracks widened continually and penetrated through the entire cross-section. Finally, spalling of concrete occurred at the bottom of the column, and several stirrups underwent fracture when the column failed in the typical shear failure mode. Meanwhile, buckling of the exposed longitudinal rebars was observed.
3.2 Hysteresis and skeleton curves
3.2.1 Hysteresis curves
The lateral load versus displacement curves of each tested MRHSC column are shown in Fig. 7. The slopes of the hysteresis curves of the MRHSC columns were similar to each other prior to the yielding of the longitudinal rebars. Furthermore, no residual deformation was observed in the elastic phase. Meanwhile, the specimens displayed high stiffness, and no apparent degradation in the horizontal load carrying capacity was observed. The hysteresis curves of all the columns displayed spindle shapes without pinching. This indicated that the MRHSC columns exhibited favorable hysteresis behavior.
Compared with the specimen C-DC-100 subjected to a low axial compression force (tN=1270 kN), C-DCHA-100, subjected to a high axial force (tN=3180 kN), exhibited steeper and narrower hysteretic loops. This indicates that an increase in axial compression force on the column resulted in a lower ductility.
Comparing C-DC-100 and C-DC-200 (which have an identical reinforcement configuration except for stirrup spacing), C-DC-100 exhibited wider hysteretic loops. This indicates that an increase in transverse reinforcement spacing could have a negative effect on the cyclic response of MRHSC columns.
C-DC-100 displayed the highest lateral load carrying capacity among CC, C-C-100, and C-DC-100. This indicates that the combination of the central longitudinal rebars and stirrups plays a pivotal role on the cyclic behavior of MRHSC columns.
Among the specimens with different distributions of multiple reinforcing steel bars, C-DC-100 and C-SC-100 exhibited larger hysteretic loops owing to a more gradual decrease in lateral loads. This indicates that these two types of transverse reinforcements (DC and SC) could be more favorable to the seismic behavior of MRHSC columns.
3.2.2 Skeleton curves
The skeleton curves are illustrated in Fig. 8. These were obtained by connecting the peak points in the first cycle of the hysteresis curves. This figure shows that the lateral load versus displacement (P–Δ) curves had a linear relationship at the beginning of the test. As the imposed displacement increased, the stiffness of the MRHSC columns decreased, and the degradation of the horizontal bearing capacity accelerated gradually owing to the extension and development of cracks. Once maximum loads were attained, the skeleton curves appeared to soften until the lateral loads decreased to below 85% of the peak loads experienced in each direction.
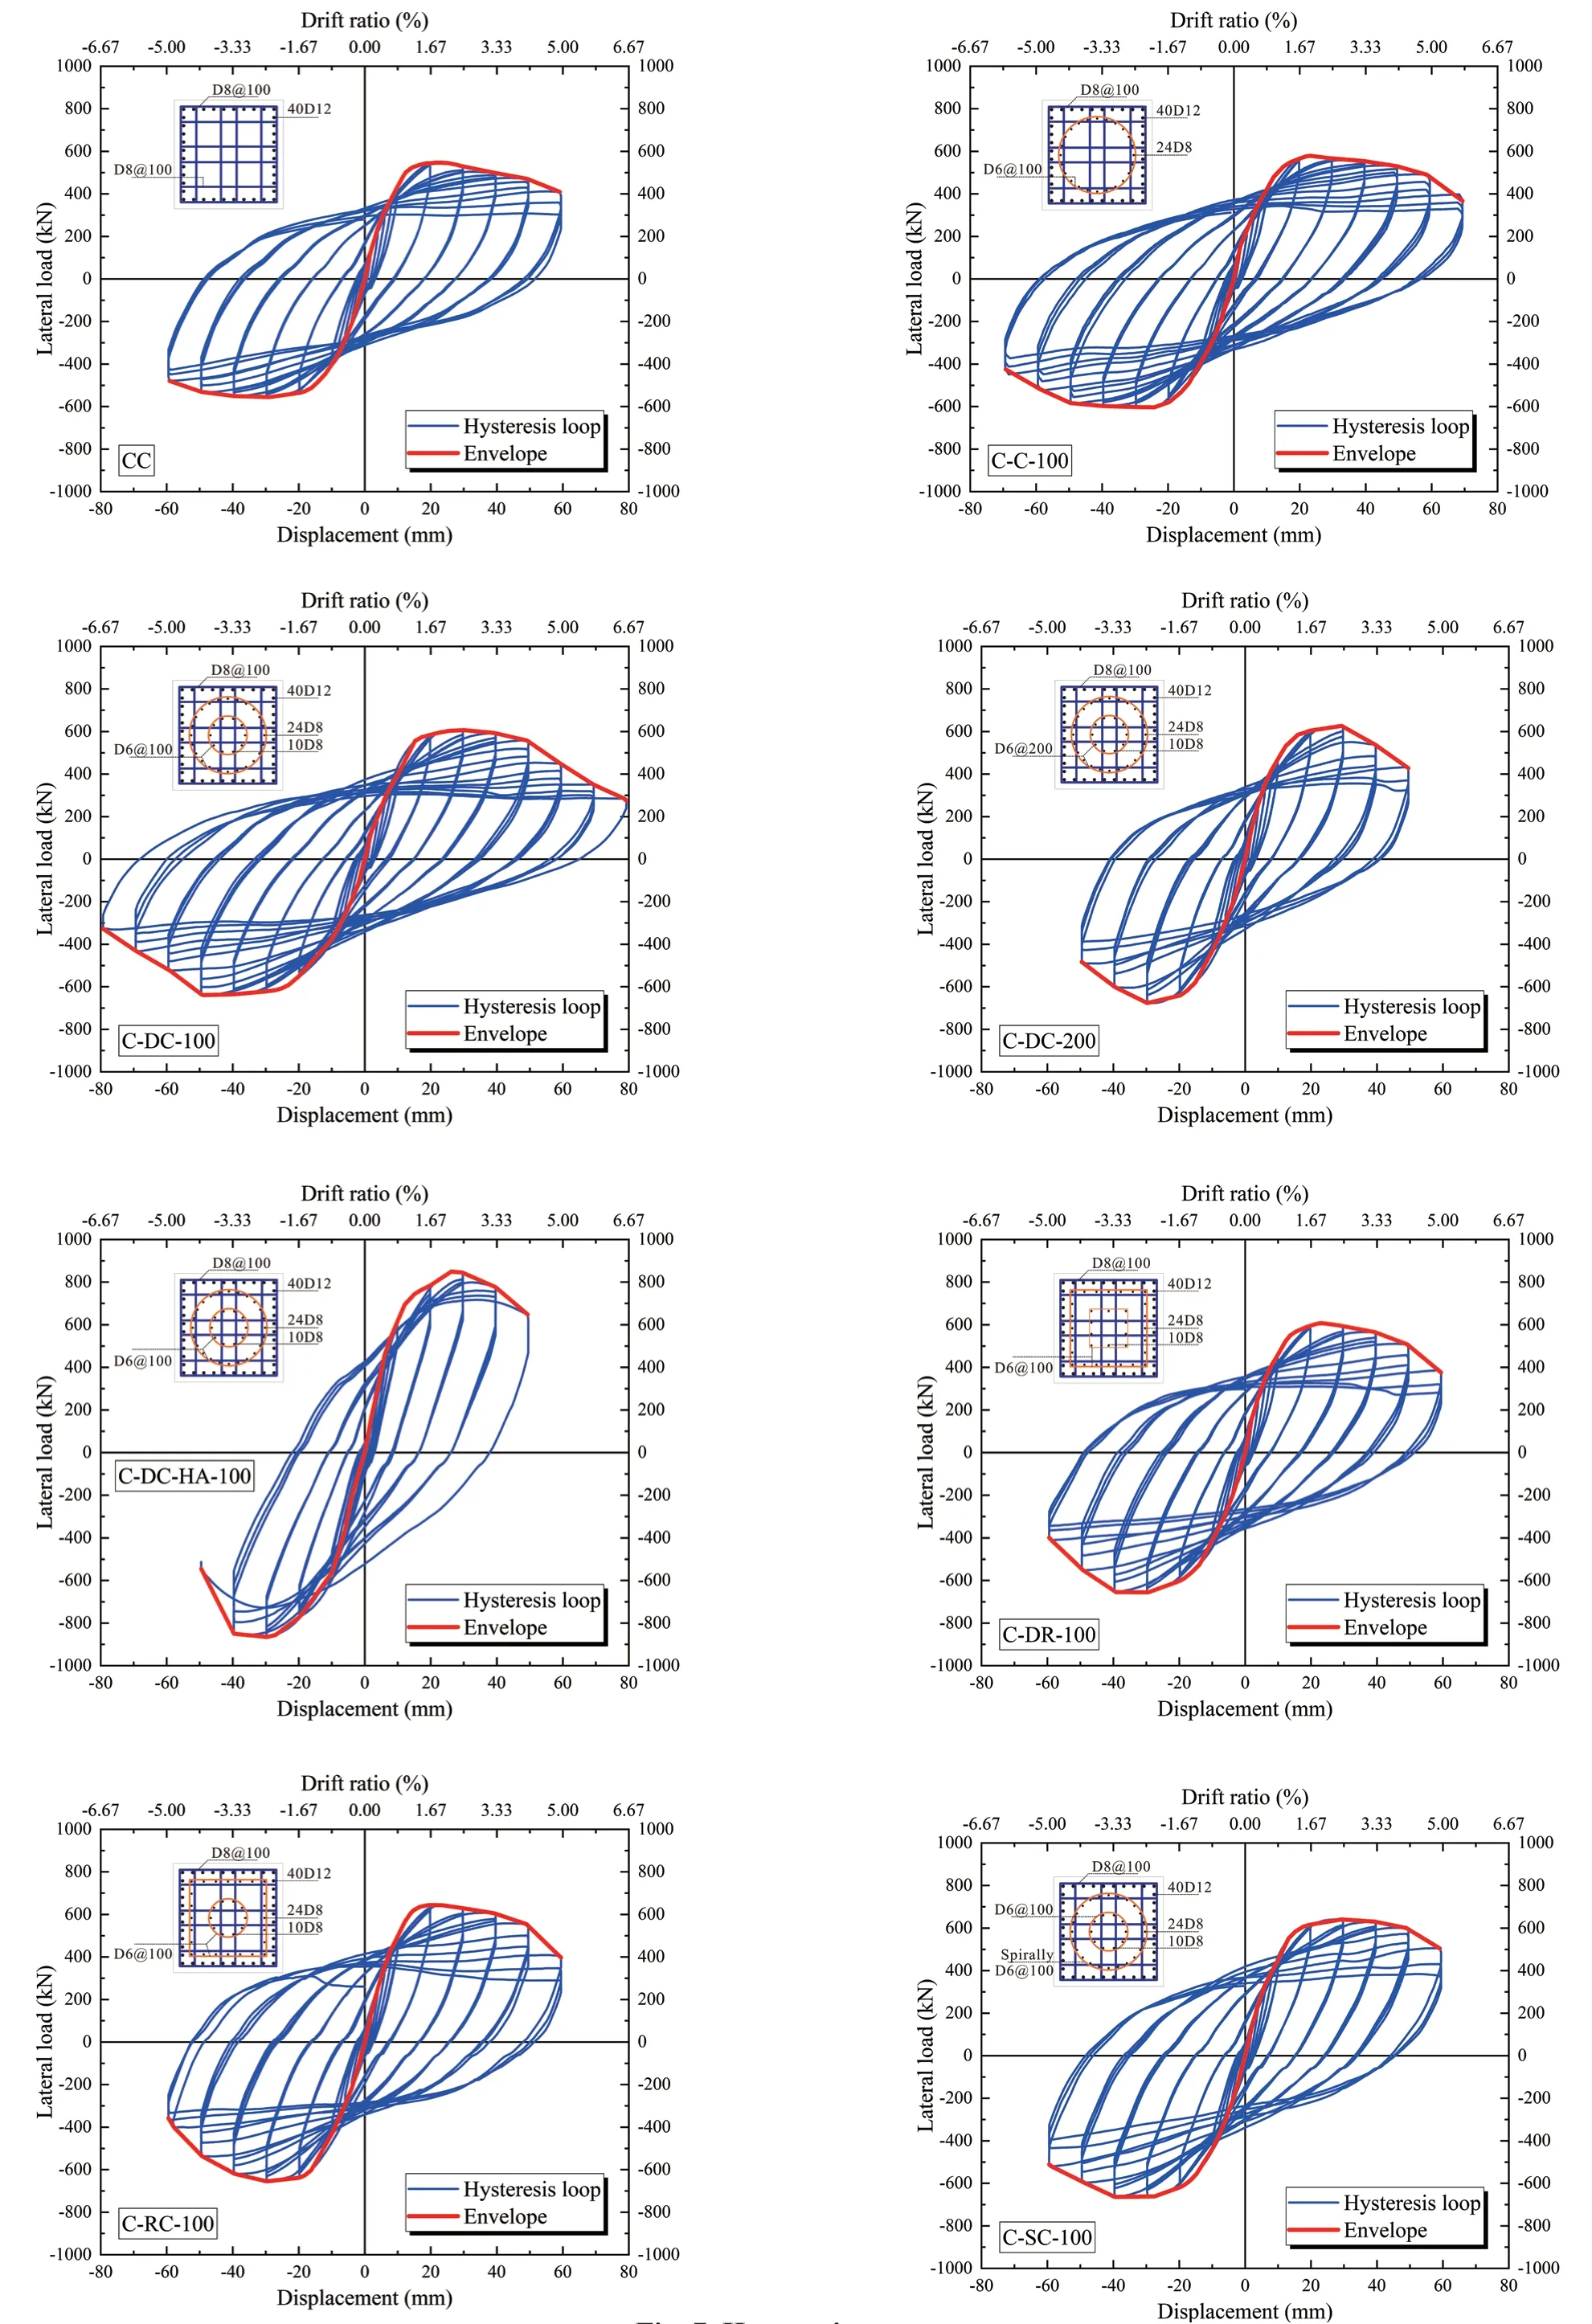
Fig. 7 Hysteretic curves
The yield loadyPand yield displacementΔywere calculated using the energy method (Caiet al., 2016; Zhenget al., 2017), as illustrated in Fig. 9. Based on the envelop curves, the peak loadsmP, ultimate loadsuP, peak displacementsΔm, and ultimate displacementsΔuare summarized in Table 3. In addition, to study the ductility and deformation capacity of the MRHSC columns, the displacement ductility coefficientµand ultimate drift ratiouθwere calculated using Eqs. (1) and (2), respectively (Zenget al., 2019; Hanet al., 2013):

Fig. 8 Skeleton curves


Fig. 9 Definition of yielding point
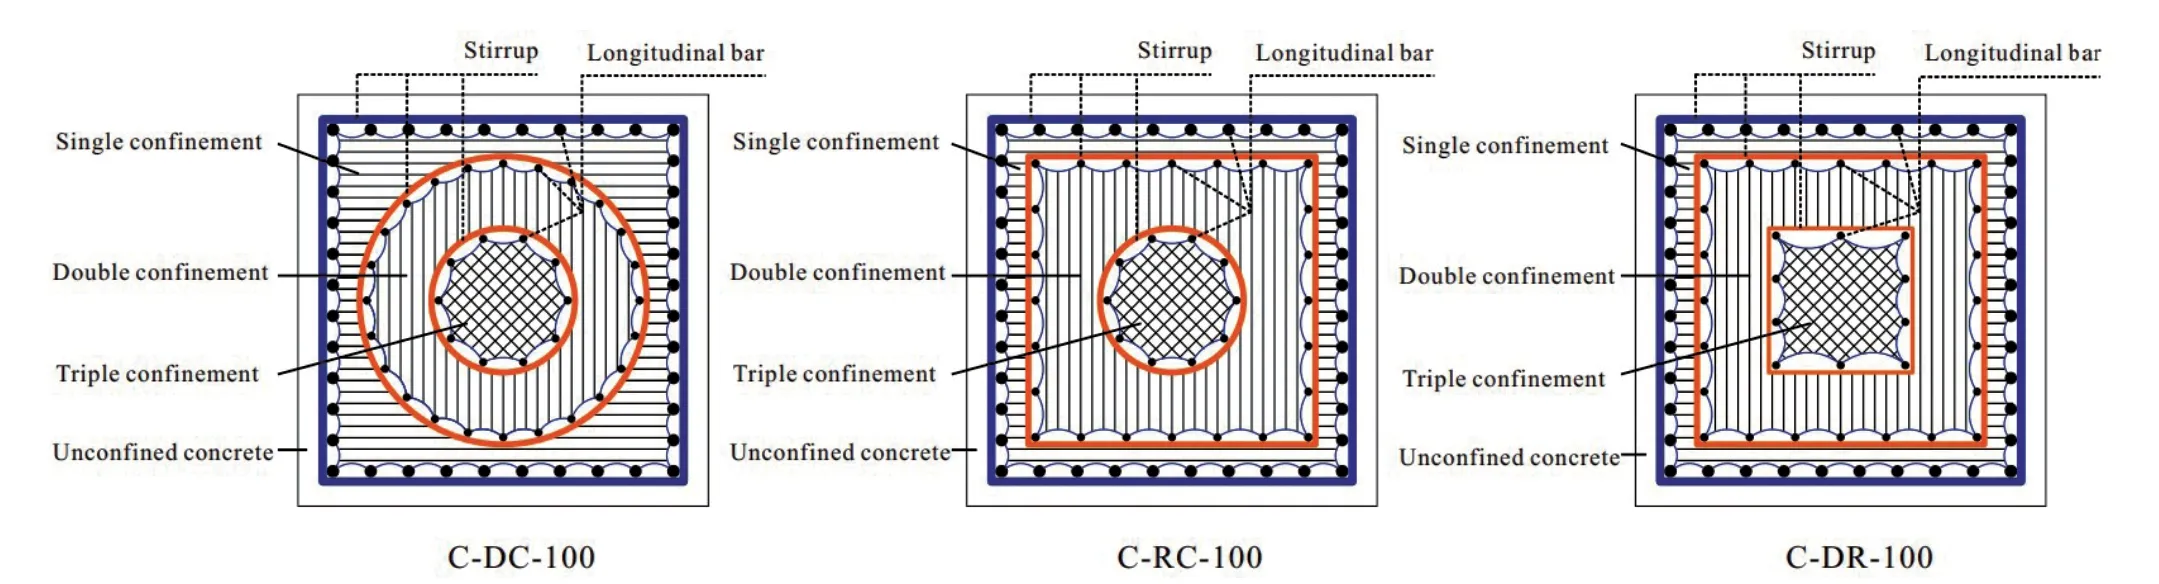
Fig. 10 Partition in a cross-section of MRHSC columns
As shown in Table 3, the lateral load-carrying capacities of the MRHSC columns under identical axial force were 7%–18% higher than that of the control column. This indicates that the configuration of multiple reinforcing steel bars in the core areas could increase the lateral load-carrying capacity.
The yield load and peak load of C-DC-HA-100 were higher than those of C-DC-100 by 34% and 38%, respectively. This indicates that an increase in the axial compression force on MRHSC columns could result in an increase in their lateral load-carrying capacity. Furthermore, it should be observed that C-DCHA-100 experienced more rapid degradation after peak displacements when compared to C-DC-100. However, the ductility ratio of C-DC-100 was 15% higher than that of C-DC-HA-100, which indicates that an increase in the axial compression force negatively impacts ductility.
The peak displacement and ultimate displacement of C-DC-100 were 34% and 35% higher than those of C-DC-200, respectively. Meanwhile, the displacement ductility coefficient of C-DC-100 was 15% more than that of C-DC-200. This indicates that the deformation capacity and ductility of the MRHSC columns could be considerably increased by decreasing the spacing of transverse reinforcements in the core areas.
Both yield load and peak load of C-C-100 were 7% larger than those of CC. The yield load and peak load of C-DC-100 were larger than those of C-C-100 by 7% and 5%, respectively. However, similar ultimate displacements were observed for these three columns. This indicates that the use of multiple reinforcing bars in the core areas can increase the bearing capacity and that the ultimate deformation capacity is not markedly decreased.
The lateral load-deformation skeleton curves of C-DC-100, C-RC-100, C-DR-100, and C-SC-100 are significantly close to one another. It could be concluded that the alteration of the multiple reinforcing bars in the core areas exerted a negligible influence on the lateral load-bearing capacity. The ultimate displacements of C-DC-100 and C-SC-100 were highly similar to that of CC, whereas those of C-DR-100 and C-RC-100 were lower than that of CC. These findings indicate that the multiple reinforcing configurations (DC and SC) can effectively increase the lateral bearing capacity of MRHSC columns without reducing their deformation capacity. The displacement ductility coefficient of C-SC-100 is the highest among the four columns with different configurations of multiple reinforcing steel (DC, RC, DR, and SC). This indicates that the central reinforcement configuration (SC) may more effectively confine the core concrete while simultaneously maintaining member ductility.
To investigate the influence of the confinement index on the peak loads of the MRHSC columns, the confinement indexes of all the specimens in this study were calculated based on the procedure for computing confinement index, as proposed by Jing and Huang (2019) (see Table 4). It can be observed that the ratio of the confinement index of internal stirrups to that of outer rectangular hoops (λv2λv1) could significantly influence the peak loads of the MRHSC columns. For MRHSC columns with an identical spacing of stirrups under a matching axial compression ratio, an increase inλv2/λv1could result in a rise in peak loads.

Table 3 Summary of experimental results

Table 4 Computation of confinement indexes
4 Analytical model
A numerical calculation model based on a sectional analysis method was proposed to predict lateral load versus displacement curves for the MRHSC columns. The following assumptions were adopted in the model: (1) the strain in the longitudinal reinforcing steels and concrete is proportional to their distance from the neutral axis in a plane section, and (2) the stresses pertaining to various materials can be determined based on the corresponding uniaxial constitutive laws.
4.1 Constitutive laws
4.1.1 Compression response of concrete
As shown in Fig. 10, the cross-sections of the MRHSC columns were assumed to be divided into four regions: (1) the triple confinement region was simultaneously limited by all the transverse reinforcements, (2) the double confinement region was simultaneously restricted by the use of two groups of stirrups, (3) the single confinement region was curbed only by the outer rectangular hoops, and (4) the unconfined part was located outside the transverse reinforcements. Therefore, the concrete can be divided into four levels based on confining pressure levels: highly confined concrete (HCC), doubly confined concrete (DCC), singly confined concrete (SCC), and unconfined concrete (UCC).
A widely accepted constitutive model for confined concrete proposed by Manderet al.(1988) was adopted after considering the effect of various transverse confinements. The uniaxial confined concrete strength for each area can be calculated by Eqs. (3)–(13):

whereccf′ is the compressive strength of confined concrete;cof′ is the cylinder compressive strength of UCC, and is determined to be 43.4 MPa by multiplying the cubic compressive strength with a coefficient (0.8);Kis the confinement factor of confined concrete;is the effective confining stress provided by lateral reinforcements, and is calculated based on the superposition principle for each area; andel,sf′,are the single, double, and high lateral pressures provided by the corresponding transverse reinforcements.
The uniaxial stress–strain (cf′–cε′) relationships for confined concrete are given by the following formulas:


whereεcis the uniaxial compressive strain of concrete, ccεis the peak strain of confined concrete,coεis the peak strain corresponding to the maximum stress of UCC and herein is assumed to be 0.002,cE′ is the elastic modulus of UCC, andsecE′ is the secant modulus of confined concrete.
The confinement factorssK,dK, andhKrepresent singly, doubly, and highly confined concrete, respectively. Table 5 tabulates thesK,dK, andhKvalues of various areas as well as the corresponding confined concrete strength. It can be observed that the values ofsKfor all the specimens are identical because of the similar outer stirrup arrangements. Next, a comparison of C-DC-100 and C-DC-200 reveals thatdKcan be considerably affected by the spacing of stirrups in the core areas. The value ofhKfor highly confined concrete is determined according to the transverse reinforcements. Therefore,Khhas the maximum value among these confinement factors.

Table 5 Confinement factors and strength of confined concrete
The compressive stress-strain curves of confined concrete in various areas calculated by using the aforementioned formulas are illustrated in Fig. 11. It is evident that the peak strength and post-peak response of the confined concrete in each area are substantially influenced by the confinement factors.

Fig. 11 Stress-strain relations of concrete in various regions
4.1.2 Tensile response of concrete
The stress-strain curve of concrete subjected to tensile force (cf–cε), based on the concrete model proposed by Belarbi and Hsu (1994), is, for simplification, expressed by Eqs. (14)–(15) for all the areas:

wherecEis the elastic modulus of concrete,cεis the tensile strain of concrete, andcrεis the cracking strain of concrete (set as 0.00008).
4.1.3 Tensile response of reinforcing steel
Sezen and Setzler (2008) modified the steel tensile stress law proposed by Park and Paulay (1975) by considering a tangential slope of 0.02Esfor the yield plateau. Therefore, the reinforced steel tensile law used in the analytical model can be expressed as follows:

wheresfis the tensile stress of steel reinforcements;Esis the elastic modulus of steel reinforcements;εsis the tensile strain of steel reinforcements;yfandyεare the yield stress and the corresponding yield strain, respectively;shεis assumed to be 4εy;suεis the ultimate strain;shfis the stress at the strain ofshε; andsufis the ultimate stress.
4.1.4 Compression response of reinforcing steel
Based on the tensile stress law, Dhakal and Maekawa (2002) proposed a stress-strain relationship of compressive longitudinal reinforcements with certain modifications that considered the effect of steel buckling. The stress-strain relationship of longitudinal reinforcements in compression is presented by Eqs. (17)–(21).
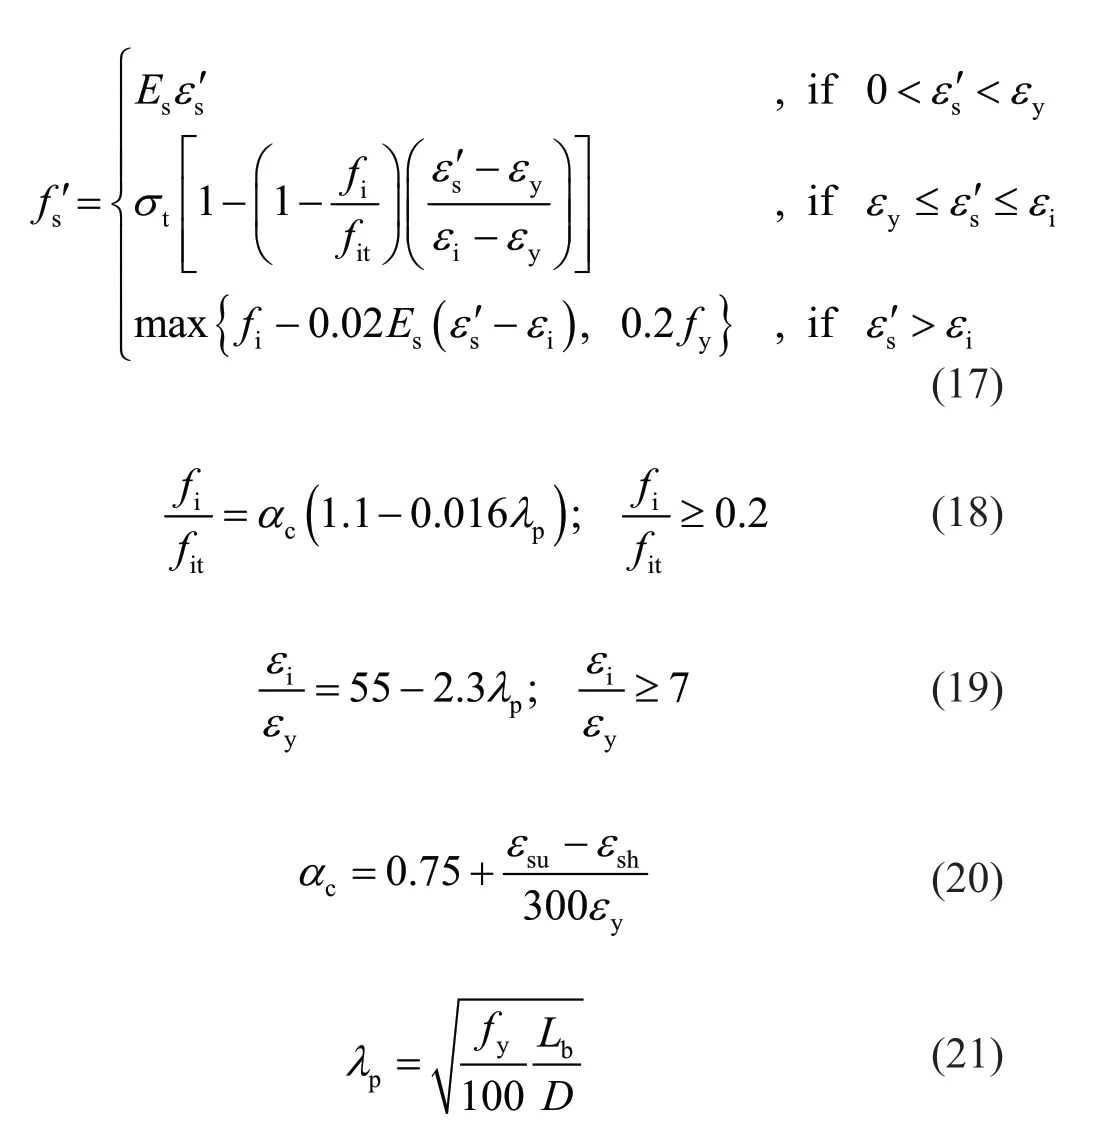
wheresf′ is the stress of reinforcements in compression;sEis the young modulus;sε′ is the strain of reinforcements in compression;tσanditfare the stresses in the tension envelope corresponding tosε(current strain) andiε(strain at the intermediate point), respectively;bLis the bucking length of longitudinal reinforcements; andDis the diameter of longitudinal reinforcements.
4.2 Equilibrium conditions
As shown in Fig. 12, the axial strain at arbitrary points in the cross-section can be calculated by Eq. (22) if the strain of the cross-section center0εand sectional curvatureφare assumed. Meanwhile, the location of the neutral axis (NA) can be determined. Here, (,)yzεis a function of they- andz-coordinates, andhis the height of the cross-section:

Based on the above geometric conditions and the constitutive relationships of all the materials, the axial bearing capacityNand bending moment capacityMcan be calculated from the equilibrium conditions of all internal forces in the cross-section. The specific calculation formulas can be expressed by Eqs. (23)–(24). Here, the resultant force and moment of longitudinal reinforcements are obtained by summing. Meanwhile, the resultant force and moment of concrete in tension and compression are obtained by using a numerical integration method:

wherei= 1, 2, 3 represent longitudinal reinforcements for the single, double, triple confinement, respectively;jdenotes the serial number of the longitudinal reinforcing rebars;σis the stress of the longitudinal reinforcing rebars;nis the amount of longitudinal reinforcements with identicalycoordinates;sAis the cross-sectional area of the longitudinal reinforcements;cf′ andcfare the stresses of the compressive and tensile concrete, respectively;his the height of the cross-section; andyandzrepresent the corresponding coordinates.
4.3 Deformation components
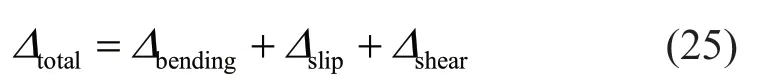
For a conventional RC column, the lateral total deformationΔtotalcaused by a combination of horizontal and axial loads consists of the bending deformationΔbending, reinforcement slip deformationΔslip, and shear deformationΔshear(Sezen and Setzler, 2008; Wanget al., 2019). Similarly, the total tip deformation of an MRHSC column can be expressed by Eq. (25), as illustrated in Fig. 13:

Fig. 12 Strain distribution at the base of columns

Fig. 13 Different components of lateral deformation of columns
4.3.1 Bending deformation
The bending deformation along the column height is a pivotal component of the total deformation for a column. It can be obtained by integrating the curvature along the column height based on Eq. (26):

whereHis the column effective height, ()xφrepresents the curvature distribution at an arbitrary section, andxdenotes the distance from the section to the upper surface of the column footing.
Considering the transition from elastic to plastic, a simplified plastic hinge length mode proposed by Priestley and Park (1987) can be calculated using Eq. (27):

whereyφis the curvature corresponding to the yielding of the extreme longitudinal reinforcement;pLis the equivalent plastic hinge length, and is assumed to be 0.5has proposed by Moehle (1992).
4.3.2 Slip deformation
The slip deformation contribution is produced by a rigid slip rotationslipθcaused by the slipping of longitudinal reinforcing bars out of the column foundation. In accordance with the model proposed by Sezen and Setzler (2008), and to simplify the calculation, the slip is assumed to occur in extreme tensile longitudinal reinforcements. Therefore, the slip rotationslipθcan be expressed by Eq. (28) (Tenget al., 2016; Chenget al., 2019):

whereslipuis the slip displacement of an extreme tensile longitudinal reinforcement,0hrepresents the distance from the extreme tensile longitudinal reinforcement to the extreme compression fiber of concrete, andcis the distance from the neutral axis to the extreme compression fiber of concrete and is determined from the aforementioned section analysis.
The slip model proposed by Sezen and Setzler (2008) can be expressed by Eq. (29):
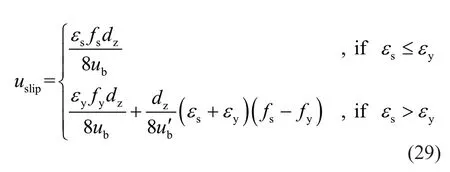
wheresεis the strain of an extreme tensile reinforcing bar obtained from Eq. (22),sfis the stress of the extreme tensile reinforcing bar obtained from the constitutive laws mentioned above, andzdis the diameter of the extreme tensile longitudinal reinforcement. In accordance with research done by Lehman and Moehle (2000), the average effective bond stressbuand residual bond stressbu′ are determined by Eqs. (30) and (31), respectively:

In conclusion, the top slip deformation owing to the slip between the longitudinal reinforcements and concrete can be calculated by using Eq. (32) (Chenget al., 2019):

4.3.3 Shear deformation
The shear deformation contribution is a pivotal component of the total deformation. This is particularly so for the columns that failed in either the flexural-shear failure mode or shear failure mode. In this section, an intricate shear model proposed by Lehman and Moehle (2000) is applied using an integration method along the whole column height to accurately calculate the shear deformation of the MRHSC columns. This is illustrated in Eqs. (33)–(37):

wherePdemandrefers to the lateral force at the loading point without considering the second-order effect;Geff(x),Aeff(x), andEc(x) represent the bulk modulus, effective shear area, and secant modulus, respectively; the Poisson ratioµis approximated to be 0.3;c()fx′ andc()xε′ are the normal compressive stress and strain, respectively, in the extreme fiber of compressive concrete;bis the cross-sectional width; and ()xφis the sectional curvature.
4.4 Calculation approach for force–displacement curves
In this section, a detailed calculation approach (see Fig. 14) is implemented in MATLAB to calculate the force-displacement curves of all specimens. In the flowchart,ϕ(i) andε0(i) are the curvature and central strain of the cross-section at the bottom of the column for each Stepi;φ∆ is the increment in sectional curvature;0ε∆ is the increment in the strain at the sectional center; (,,)yziεand (,,)yziσare the strain and stress, respectively, at arbitrary points on the crosssection for each Stepi;N(i) andM(i) are the resultant force and resultant moment, respectively, of all the materials for each Stepi; andζis the permissible error. The remaining symbols are mentioned above.
It should be noted that with increasing displacements, the high axial force on a column top can produce a larger moment at the bottom of the column. Therefore, in terms of the computational model, the second-order effects (Zhanget al., 2019) should be considered using Eq. (38), which can considerably influence the forcedisplacement curves (particularly in the post-yield stage) of the MRHSC columns.

whereMandNum.Pare the calculated resultant moment and calculated lateral-bearing capacity, respectively.
Two failure criteria are adopted to terminate the computational process in MATLAB: (1) The strain of the longitudinal reinforcements in tension attains an ultimate tensile strain. (2) The lateral-bearing capacity of the column decreases to below 85% of the maximum carrying capacity.
5 Predicted results
5.1 Validation with experimental tests
Table 6 presents the experimental and predicted results at characteristic points of the MRHSC columns. The predicted results, including the lateral load bearing capacity and displacements of the specimens, were obtained by the above theoretical model to quantify the accuracy of the proposed analytical model.

Table 6 Comparison between calculated and measured results
In terms of the lateral load characteristic, the difference between the measured and calculated responses is below 12%, as shown in Fig. 15(a). It can be observed that most of the predicted load capacities are marginally less than the measured results. This indicates that this calculation model could be conservative. The mean values ofPy.Num./Py.Exp.,Pm.Num./Pm.Exp., andPu.Num./Pu.Exp.are 0.96, 0.98, and 0.97, respectively, and the corresponding standard deviations are 0.05, 0.02, and 0.02, respectively.

Fig. 14 Flowchart for the theoretical model
The characteristic displacements obtained from the experimental tests and the proposed model are compared in Fig. 15(b). The mean values of∆y.Num./∆y.Exp.,∆m.Num./∆m.Exp., and∆u.Num./∆u.Exp.are 0.88, 0.77, and 0.98, respectively, and the corresponding standard deviations are 0.20, 0.14, and 0.07, respectively. The comparison reveals that the predicted ultimate displacement capacities were largely equal to the measured ultimate displacement, with a maximum difference of 13%. The largest difference between measured and computed displacements was observed for the yield displacement of C-DC-HA-100, where the yield displacement was estimated to be 37% higher. However, its maximum and ultimate displacements were estimated with significant accuracy.
Overall, the proposed computational model can effectively predict the characteristic load-bearing capacities and corresponding displacements. However, the computational model was validated only by the experimental results from this study. Therefore, further research based on extensive test data from other tests is necessary.
5.2 Force-displacement response
To compare the predicted results more intuitively, lateral load versus displacement curves of all the MRHSC columns based on the experimental and predicted results are shown in Fig. 16. It should be noted that the predicted envelope curves are calculated under the monotonic load. Furthermore, these are simultaneously presented in the positive and negative directions, assuming symmetry for a convenient comparison of the backbone curves.
The initial stiffness of certain specimens is marginally overestimated, particularly for C-DC-100 in Fig. 16. Nonetheless, the predicted responses closely follow the experimental results in all the cases. This indicates that the proposed computational model can be used to estimate the seismic response of MRHSC columns.

Fig. 16 Continued
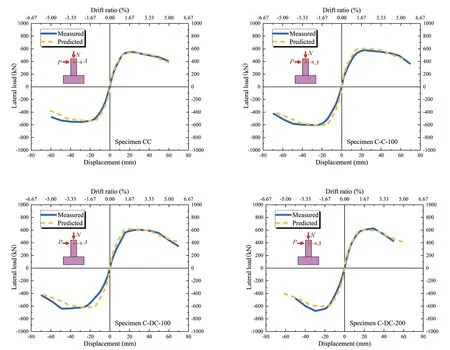
Fig. 16 Measured and predicted load-displacement responses of specimens
6 Conclusions
This paper presents the experimental results of cyclic reversed loading tests on eight reduced-scale MRHSC columns with different design parameters. These parameters included the axial compression ratio, stirrup form, and stirrup spacing. In addition, a numerical calculation model was established to calculate the backbone curves of the MRHSC columns. The following conclusions can be drawn based on the results and observations obtained:
• Under low cyclic repeated lateral loading, the MRHSC columns with a low axial compression ratio (tn=0.18) experienced bending-shear failure, whereas those with a high axial compression ratio (tn= 0.46) exhibited brittle shear failure. The hysteretic curves for all the MRHSC columns display full spindle shapes without pinching. As the axial compression ratio increased, the bearing capacity increased significantly, whereas the deformation capacity and ductility decreased.
• The spacing of inner hoops exerts considerable influence on the seismic behavior of MRHSC columns. An effective method for improving ductility is to decrease the spacing of transverse reinforcements in the core areas. It also delays degradation of load-bearing capacity.
• For the MRHSC specimens with different configurations of multiple reinforcing steels, the hysteretic behavior and deformation capacity of specimens with double circular hoops and a combination of spiral and circular hoops were better than those of the other specimens. This indicates that these two forms of stirrup may be more favorable for this type of MRHSC column.
• The proposed analytical model can accurately predict the lateral force and deformations of MRHSC columns. Nevertheless, the verification of the model is based on limited data stemming from this test. Therefore, further studies are required to assess the accuracy of the model in predicting the load-bearing capacity and deformation behavior of MRHSC columns with different reinforcement configurations.
Acknowledgement
This research was sponsored by the National Natural Science Foundation of China (No. 51868073), Special Funds for Technology Innovation Guidance of Shaanxi (No. 2019CGHJ-06), the Natural Science Foundation of Shaanxi (No. 2018JQ5005), and the Special Fund for Basic Scientific Research of Central Colleges (No. 300102288302). All such support is greatly appreciated.
杂志排行

Earthquake Engineering and Engineering Vibration的其它文章
- Dynamic shear modulus and damping ratio characteristics of undisturbed marine soils in the Bohai Sea, China
- Geotechnical engineering blasting: a new modal aliasing cancellation methodology of vibration signal de-noising
- Response prediction using the PC-NARX model for SDOF systems with degradation and parametric uncertainties
- Optimal design of inerter systems for the force-transmission suppression of oscillating structures
- Range of applicability of real mode superposition approximation method for seismic response calculation of non-classically damped industrial buildings
- Measurement of vibration frequencies of ties in masonry arches by means of a robotic total station