Measurement of vibration frequencies of ties in masonry arches by means of a robotic total station
2022-04-15MarcoGatti
Marco Gatti
Dipartimento di Ingegneria, University of Ferrara, via Saragat 1 44123 Ferrara, Italy
Abstract: Measurement of the vibration frequencies of eight ties set in masonry arches of a church by means of a robotic total station is described. The instrument made continuous recordings (up to ten per second) of the three-dimensional positions of a reflector situated at 1/2 or 1/4 of the length of the tie during vertical oscillation induced by an impulsive load. The recording slips, vibration amplitudes (and their accuracy), hourly diagram and experimental spectra of vibrations, and the corresponding frequencies were calculated.The results were verified by comparing them with the vibration frequencies and indirectly the tension and fixed support constraint calculated from accelerometric measurements. The study provides interesting information on the accuracies of the reflector′s three-dimensional coordinates, but highlighted certain limits in the application of robotized total stations for measuring vibration frequencies of ties in masonry arches.
Keywords: RTS; frequency; vibrations; ties; arches
1 Introduction
A robotic total station (RTS) is a surveying instrument provided with a servomechanism (Kirschner and Stempfhuber, 2008) with a rotation speed up to 180°/s (Kleemaieret al., 2016) which allows automatic collimation of a moving target by continuously recording the positions of the center of a reflector at predetermined time intervals (Cook, 2006; Kontogianniet al., 2007). If collimation is lost, a device mounted on the telescope lens scans an area near the last position, resuming the measurements without intervention by the operator (Erhart and Lienhart, 2017).
For some years, RTS has been used, either alone or in conjunction with other geodetic measuring devices such as GPS (Radovanovic and Teskey, 2001; Cosseret al., 2003; Liet al., 2004; Psimoulis and Stiros, 2008; Casciati and Fuggini, 2009; Brownjohnet al., 2012; Psimouliset al., 2016), in the monitoring of road bridges (Ehrhartet al., 2016; Yuet al., 2017), railway bridges (Psimoulis and Stiros, 2011, 2012a and 2013; Psimoulis and Stiros, 2007; Moschas and Stiros, 2013 and 2014) and pedestrian walkways (Psimoulis and Stiros, 2012b; Charalampouset al., 2015). In such studies, the vibration frequencies of the structures were measured during the passage of vehicles (Kimet al., 2003) and persons, i.e., in situations in which the vibrations from external loads produced centimetric amplitudes repeated at time intervals of slightly more than one second (<1 Hz). Recently marketed RTS has been equipped with 360° reflectors and has tripled the recording rate (Lackner and Lienhart, 2016). In the opinion of some authors (Frukaczet al., 2017) this would allow continuous recordings of thin rods and ties that oscillate at frequencies greater than 1 Hz and with sub-centimetric amplitudes.
Therefore, the present study tested the use of an RTS to measure the vibration frequencies of eight ties, set in the masonry arches of a deconsecrated church converted into a library, at a recording rate of 10 Hz (0.1 s).
This allowed assessment of the capability of automatic collimation and continuous recording at 10 Hz of the center of a reflector, subjected to an impulsive load, situated at two distinct positions: 1/2 and 1/4 of tie length l. It was possible to determine the accuracy of the three-dimensional coordinates of the moving reflector, as well as the experimental hourly diagram of the reflector′s vertical vibration. The latter allowed extraction of the amplitude spectra and derivation of the vibration frequencies, tension, and fixed support constraint.
Finally, accelerometric measurements made with monoaxial seismic piezoelectric accelerometers mounted at the same positions as the reflectors permitted verification of the reliability of the previously measured frequencies, tension, and fixed support constraint.
The study provides interesting information on the accuracy of the coordinates measured continuously at 10 Hz. However, it also highlights some limits to the extension of RTS to the measurement of vibration frequencies of ties set in masonry arches.
2 The robotic total station
The RTS is equipped with ultrasonic motors that autonomously collimate the center of a moving reflector (automatic target recognition - ATR), with a tracking speed up to 15°/s and a rotation speed up to 180°/s (Wasmeier, 2003; Leica Geosystems, 2003; Chiorboli and Gatti, 2005). Thanks to laser pulses with ever smaller dot size, the accuracies of measurement of the horizontal Hz and vertical V angles (σHzandσV) are ca. ±0.5″ (Kirschner and Stempfhuber, 2008) and that of distance (σd) is less than ±1 mm + 1 ppm, even in the reflectorless version. The station has an autofocus telescope supplemented with wide-angle CCD and CMOS cameras (Ehrhart and Lienhart, 2016a and 2017), biaxial compensators, and temperature and pressure sensors to refine the measurement in real time.
The experiment was performed with a commercially available top-range RTS equipped with 360°-degree reflectors, ATR (automatic target recognition) and Power Search (PS) sensors, a visible red laser and a 5-megapixel CMOS image sensor, field of view (overview/telescope) 19.4°/1.5°, and a frame rate of up to 20 frames.
3 The experiment and preliminary verifications
The experiment was conducted on eight ties set in four masonry arches of a deconsecrated church after transformation of the matronea on the upper floor into a library and study rooms. The arches supporting the cross vaults of the aisles are round, with a span of 10.5 m and a thickness of 0.5 m (Fig. 1). The steel ties (C1, C2, C3, C4), paired (a, b) for each arch, have a circular section with a mean diameter ofφ= 40 mm (Fig. 1).
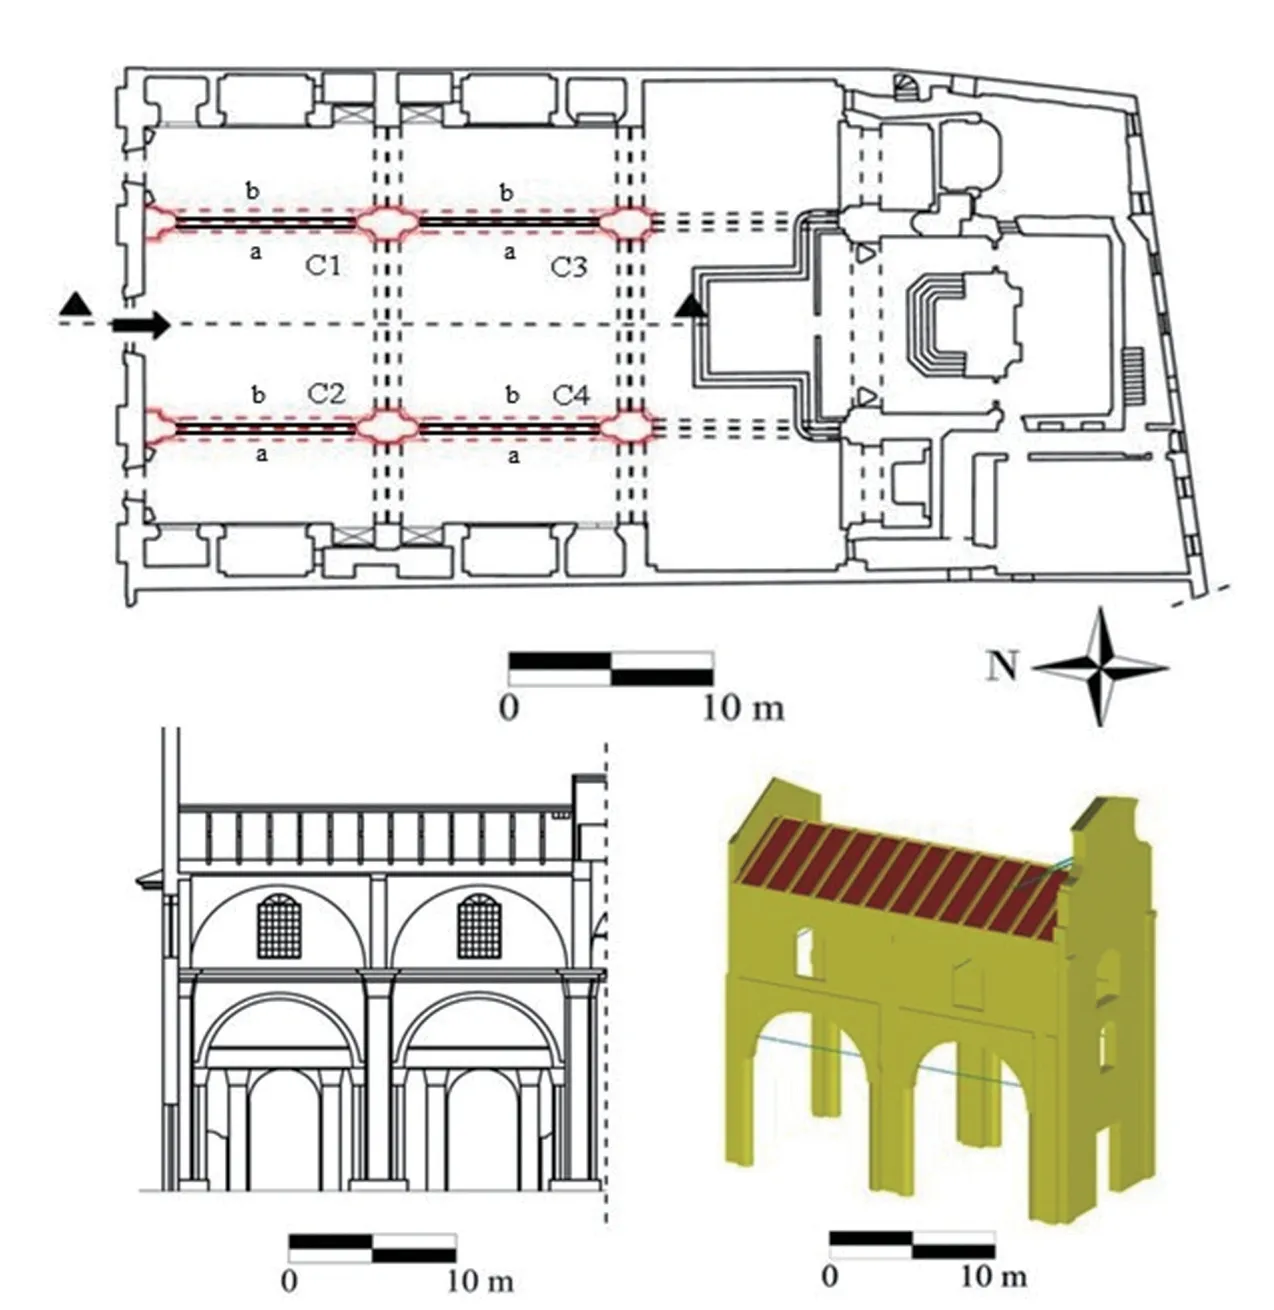
Fig. 1 Plan with identification of the ties. Cross section of the arches and 3D view
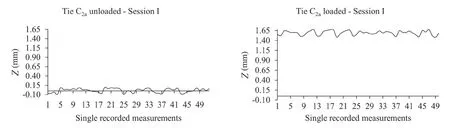
Fig. 2 Example of the trend of the Z coordinate with unloaded and loaded ties
Two preliminary verifications were carried out prior to making the vibration measurements. The first was to evaluate the accuracy of the vertical coordinateZof the center of the non-oscillating reflector to compare it with that of the moving reflector. The second was to verify a priori whether the Nyquist sampling theorem was applicable to the measurement of the ties′ vibration frequencies (Proakis and Manolakis, 1996).
3.1 Accuracy of the vertical coordinate of the center of the non-oscillating reflector
The experimental accuracy of the vertical coordinateZof the stationary reflector was evaluated for comparison with the accuracy obtainable for the vibrating reflector. The RTS was set up ca. 10 m from two of the eight ties, with one reflector positioned at 1/2 of the net length of the tie, with a threaded steel clamp and another on a bracket with tribrach at the same distance. The measured deflection was taken as the difference between theZcoordinates of the reflector in the middle of the tie with 0.10 kN. The measurement was continuous and in automatic collimation at the sampling rate of 10 Hz. Five sessions were performed, and the mean duration of each session was 5 s, for a mean of ca. 50 single recorded measurements. Between one session and another, care was taken to wait for the tie to return to the unloaded position. The operating conditions were optimal, and the operator never had to perform manual collimation of the reflector. The equal distance of the RTS from the reflectors eliminated the systematic errors of sphericity, refraction and automatic leveling of the telescope.
First, the height differences between the center of the reflector on the tie and the center of the reflector on the tribrach were determined. Then theZcoordinate of the center of the reflector on the tie was measured when the tie was unloaded and loaded. Figure 2 shows the trend of theZcoordinate for tie C2a(see Fig. 1) in Session I: the values (in millimeters) of the ordinate refer to the same scale. Similar trends were obtained for other sessions and for tie C4a. Table 2 reports the meanZmvalue (mm) per single measurement session, the mean ˆZmvalue (in mm, approximated to the third and second decimal place) for thensessions and their standard deviations (approximated to the first decimal place) for both ties.
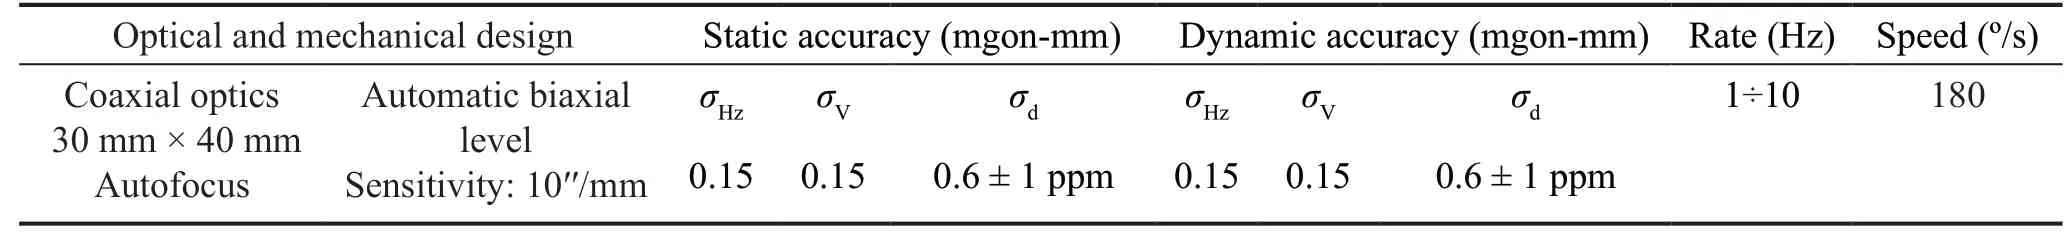
Table 1 The RTS data sheet
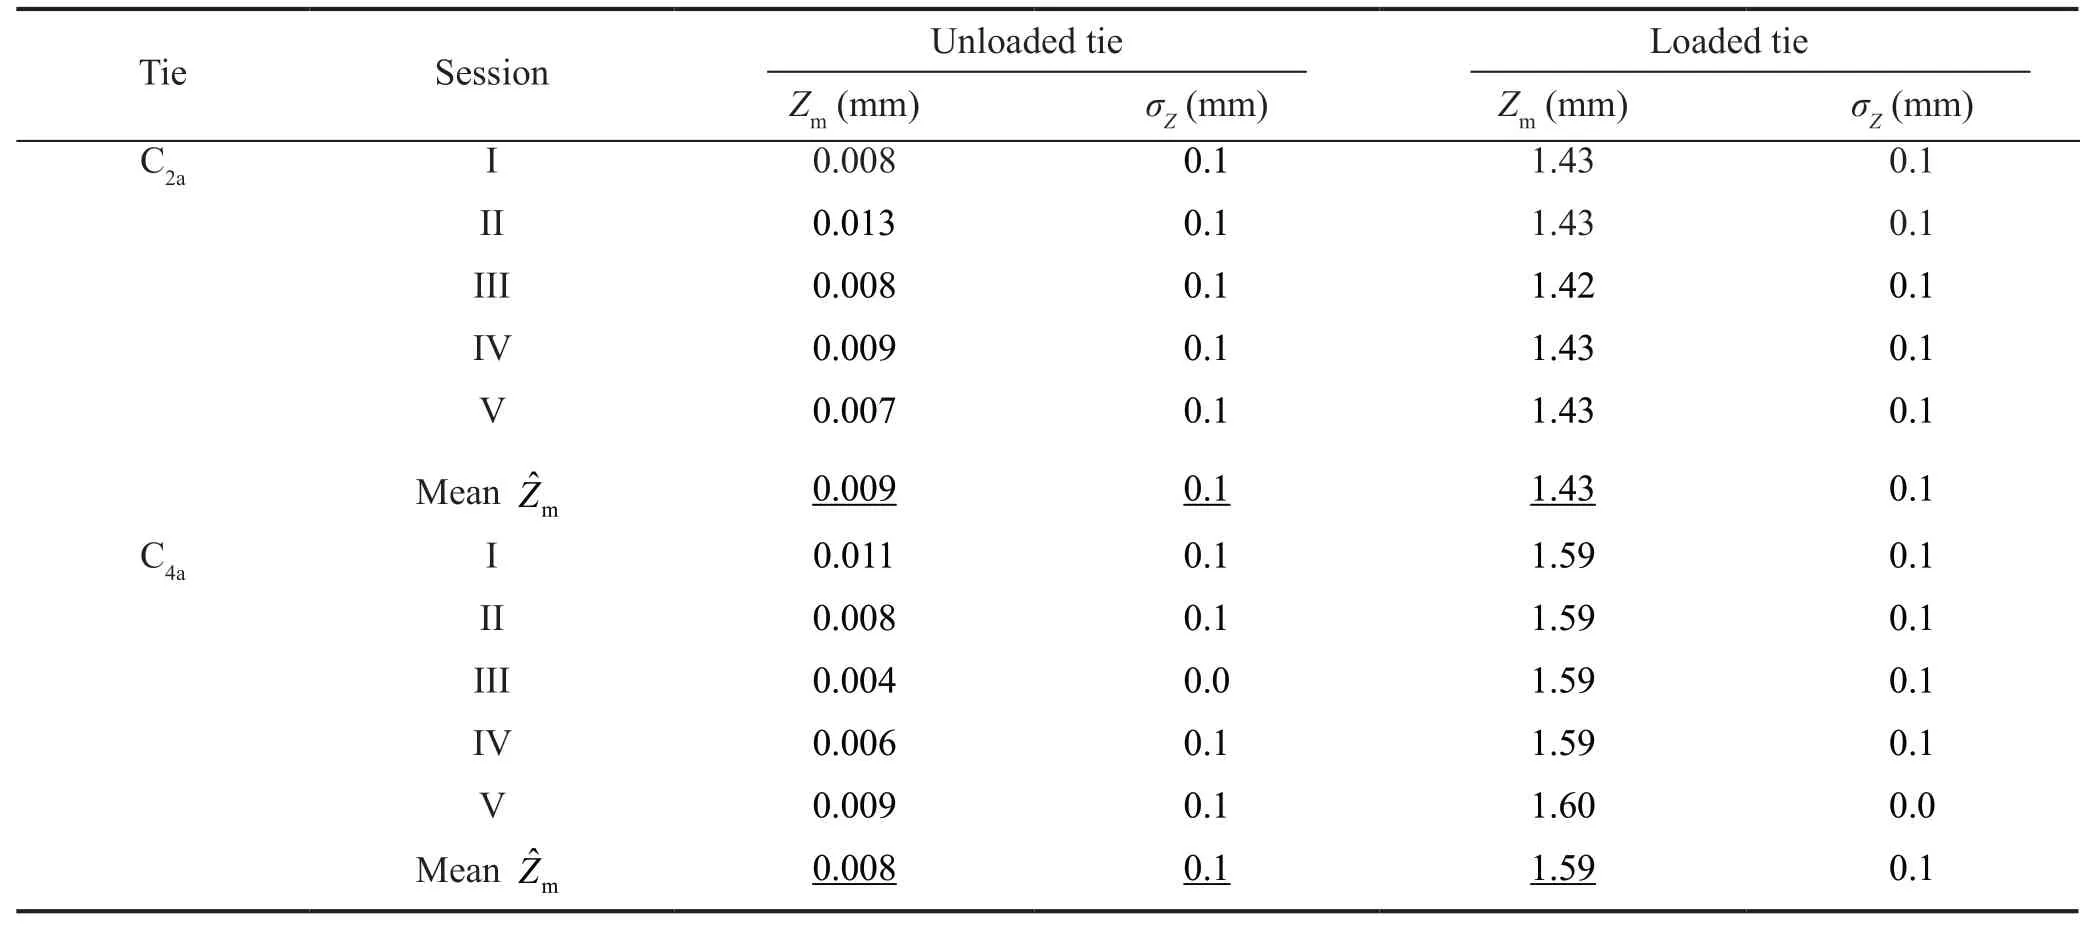
Table 2 Number of measurement sessions, mean values of the Z component and standard deviations. Unloaded tie and loaded tie
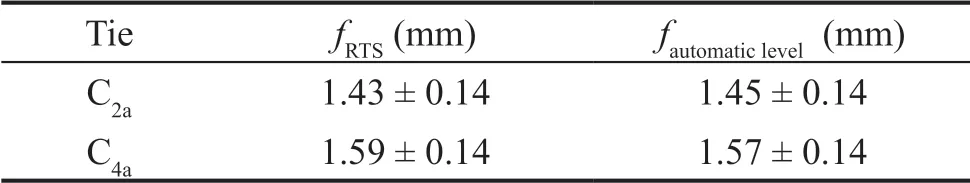
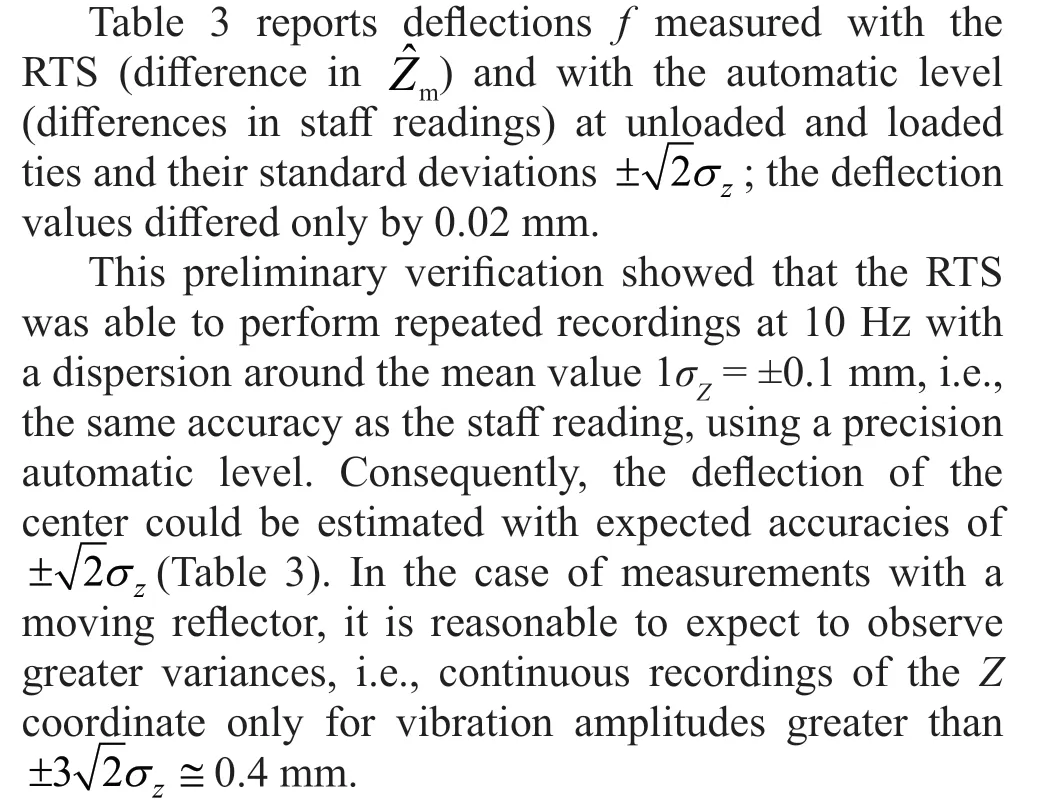
Table 3 Mean measured deflection and corresponding expected standard deviation. Applied load: 0.10 kN
The measurement was then repeated under the same load conditions using a digital automatic level with a 3 m-long invar barcode staff with a reading accuracy at the staff ofσl= ±0.1 mm. Three sessions (one with unloaded tie and two with loaded tie) of five readings each were performed.
3.2 Theoretical vibration frequencies of the ties
The “theoretical” vibration frequencies of the ties were calculated a priori to verify the validity of Nyquist′s theorem for the experiment. Among algorithms reported in the literature (e.g., Kim and Park, 2007) that of Dardanoet al. (2005) was adopted, the same one used to perform the indirect verification of the results of this experiment (Section 7). The tensionNand the fixed support constraintGare linked to the tie′s vibration frequenciesf(at least two) through the following mathematical model, which considers the tie a tenso-inflexed beam with known geometry and materials (Eq. (1)):
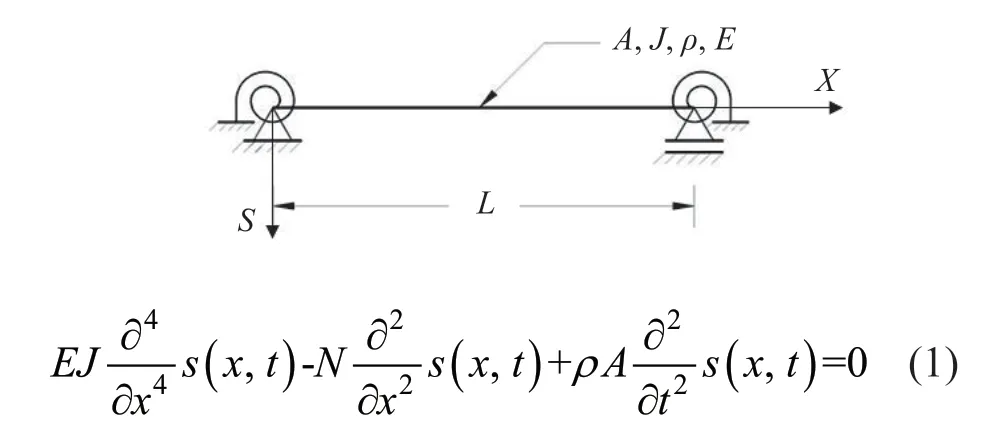
AandJare the area and the moment of inertia of the section,ρandEthe density and Young′s modulus of the tie material, ands(x,t) the transverse displacement of the section of abscissaxat timet.
It can be assumed that the tie is provided at the extremities with elastic fixed supports, expressed in the form of fixed support constraintG, variable from zero (hinge constraint) to one (perfect fixed support constraint):
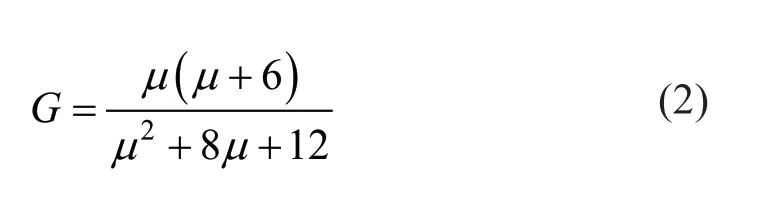
whereµis the dimensionless stiffness of the tie (assumed to be equal at the two extremities). Therefore, Eq. (1) can be rewritten in the form of separate variables, i.e., a system of two non-linear equations in which the unknowns are the frequencies, if the tension and fixed support constraint are known (first case), or the tension and fixed support constraint if the frequencies are measured (second case).
In the first case, the system was solved with the objective function of a common spreadsheet; in the second case (Section 7), the system was solved graphically-numerically (Fig. 3) with a code in a Visual Basic environment in Windows 10.
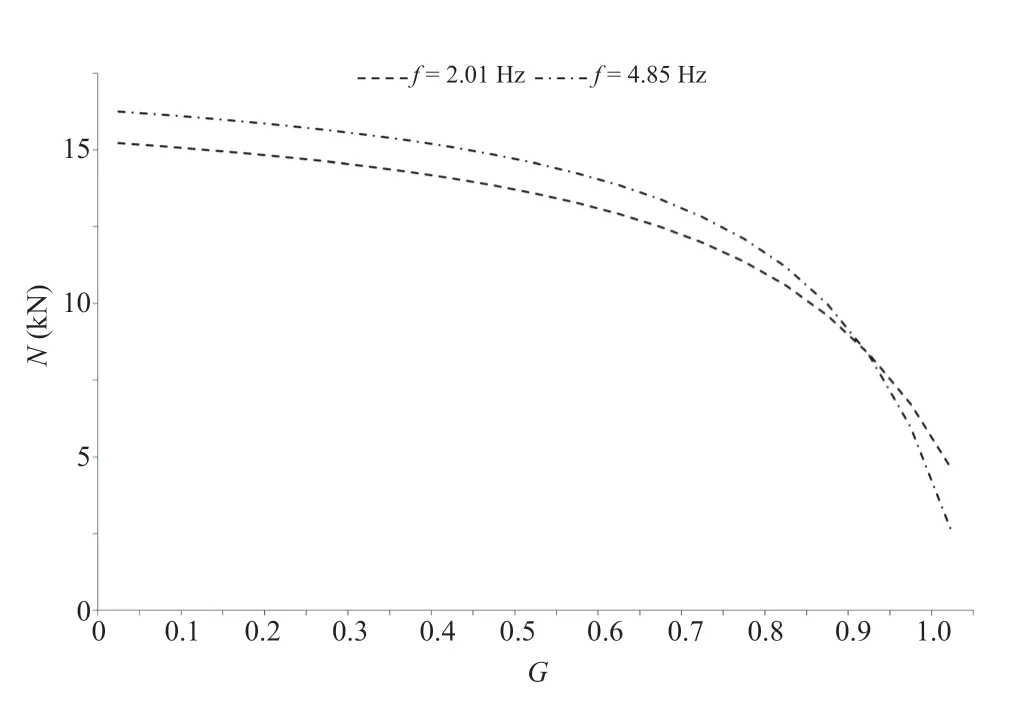
Fig. 3 Example of calculation of the tension and the fixed support constraint of a tie by use of a graphical- numerical method, with known vibration frequencies
In this preliminary verification, the theoretical tensionNwas made to coincide with the normal tension in the impost section of the arch. The latter was derived from the discrete element algebraic model proposed by Heyman (Heyman, 1966 and 1982) and previously applied in similar contexts (Gatti, 2014), whose matrix formulation is the following:

where:
-Ais the design matrix obtained by dividing the arch into 25 discrete elements (voussoirs) with a thickness of ca. 60 cm (Fig. 4);
-Fis the vector of the vertical forces and moments applied to the single voussoirs (assuming for permanent loads aγmof the masonry ~ 16 kN/m3and aγrof the filling material ~ 12 kN/m3; for incidental loads 4.5 kN/m2); and
-Xis the unknown vector of the normal and shear tensions in the voussoir interfaces.
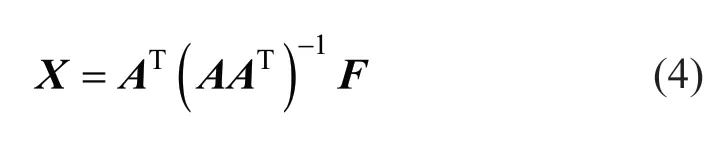
Since the arches are equal in terms of geometry and loads,Nwas estimated for only one of them. From the solution expressed by Eq. (4):
4 Vibraon measurements
The RTS was positioned ca. 20 m from the ties. A reflector chosen to set the zero direction of the measurements (Fig. 5) was positioned on a bracket with tribrach at a shorter distance. Another reflector was fixed with threaded steel clamps to the tie, alternately during the measurements at either 1/2 or 1/4 of its length: these are the modal positions relative to the first three vibration modes of the tie, i.e., those corresponding to the first three vibration frequencies, where vertical amplitudes with the highest or decreasing values are reached.
After aumatic collimation of the zero-direction reflector with the tie not in oscillation, the sequence of measurent operations was (Fig. 5):
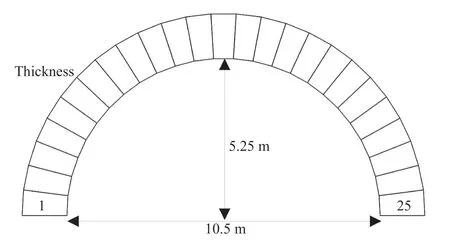
Fig. 4 Discrete elements (voussoirs) of the arch
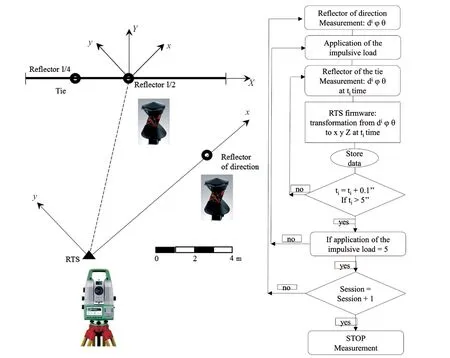
Fig. 5 Measurement set-up and sequence. Reference system (The arbitrary coordinate system (x, y) in which the measurements were performed was translated and rotated so that its origin coincided with the center of the reflector (either at 1/2 or 1/4 of the tie length), the new X axis coincided with the axis of the tie, and the Y axis was orthogonal to it)
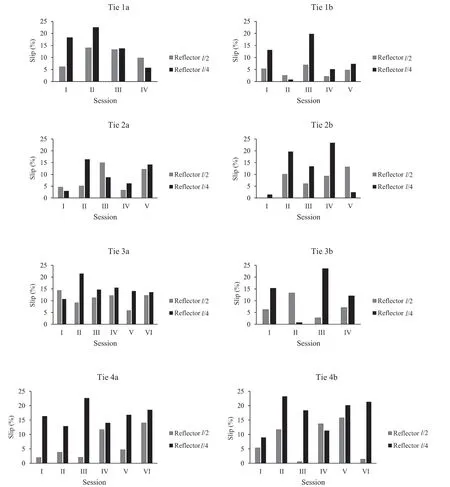
Fig. 6 Slip percentage of each tie and each measurement session for the reflector positioned at 1/2 and 1/4 of the tie length
- application of an impulsive load obtained by vertical pulling of a steel cable anchored to the top of the tie close to the reflector; and
- measurement, in automatic collimation, of theX,YandZcoordinates of the center of the reflector during its vibration.
While the tie was oscillating between the initial position of equilibrium and the one after the impulsive load, 10 measurements per second were performed for each reflector position. Each oscillation had a duration of ca. 5 s on average, equivalent to the damping time of the tie, i.e., of the reflector. Equilibrium was then reached during an additional 5 s.
This suence was repeated five times with the reflector at 1/2 or at 1/4 of the tie length. Hence, the total duration of a session was ca. 50 s, equivalent to about 500 measurements. From four to six sessions of complete measurements were carried out. Since the measurement environment was inside the building and well illuminated, the test was conducted in optimal operating conditions, i.e., without interference or obstruction of the line of sight: the operator never had to perform manual collimation of the reflector. The reduced collimation distance also meant that effects due to sphericity, refraction, pressure, and temperature could be ignored.
5 Data processing
5.1 Calculation of the slip percentages
The cycle slip (expressed as a percentage) was evaluated for each tie by comparing the number of measurements recorded with that of measurements expected for each session (Fig. 6). The number of expected measurements was calculated as between 470 and 520 per session for both reflector positions. The mean difference from the recorded measurements was ca. 40 measurements, or 8% of the total, for the reflector at 1/2land almost double that value (70 measurements or 14% of the total) for the reflector at 1/4l. The maximum cycle slip values were slightly more than 20%. They were found when the vibrationsZ(t) reversed sign and when the reflector was at 1/4l, i.e., when the vibration amplitudes were lowest.
While the first reading of the story might lead one to believe the princess is passive and delicate. She in fact is not passive, but braves a storm and finds her future mate during her travels, a feat5 the prince has failed to do in his previous searches.Return to place in story.
5.2 Analysis of the accuracies of the three-dimensional coordinates of the reflector and calculation of the hourly diagram of vibration
A reference system was chosen for each tie with the origin in the center of the reflector positioned either at 1/2 or at 1/4 of its net length; theXaxis coincided with the tie direction (positive to the right) and theYaxis was orthogonal to it (positive in the direction away from the RTS) (Fig. 5). This system was obtained by rotation of the initialxandycoordinates of the tie reflector referring to the zero-direction measurement. TheZaxis remained perpendicular to the tie axis in the vertical direction, positive downward.
First, the instantaneousXandYcoordinates of the center of the reflector positioned at 1/2land at 1/4lwere recorded for each of the eight ties. Figure 7 shows an example of the dispersion obtained in tie C1afrom the measurements recorded in Session I: the dots represent the variations of theXandYvalues of the center of the reflector (coinciding with the origin of the reference system). The scale is expressed in millimeters.
The mean value of a measurement session and the mean values ofXmandYmof the n sessions were then determined for each tie. Table 4 shows the latter values and their standard deviations with the reflector at 1/2land 1/4l, as well as the number of sessions for each tie.
From 4 to 6 measurement sessions were processed for each tie. For the reflector positioned at 1/2l,Xmvaried from 0.08 mm to 0.86 mm (mean = 0.38 mm) andYmfrom 0.20 mm to 0.71 mm (mean = 0.51 mm). For the reflector at 1/4l,Xmvaried from 0.06 mm to 0.31 mm (mean = 0.15 mm) andYmfrom 0.45 mm to 0.83 mm (mean = 0.56 mm). Their variances ranged from 0.02 mm to 1 mm (mean = 0.5 mm).
The processing was then applied to theZcoordinate of the center of the reflector, representing the vertical oscillation of the tie over time. For each tie, the mean peak and peak-to-peak values ofZreached during the pulls were calculated for the reflector at both positions (Table 5). These values represent, respectively, the maximum absolute vibration amplitude and the sum of the two positive and negative maximum vibration amplitudes (the latter in absolute value).
For the reflector at 1/2l, the mean peak values were slightly above 3 mm, with peak-to-peak values more than twofold higher. For the reflector at 1/4l, the respective values were less than 3 mm and scarcely higher than 5 mm.
The hourly diagrams of vibrationsZ(t) of the eight ties were filtered for values lower than a minimum threshold of ±0.4 mm and interpolated in correspondence of slips with extreme amplitude values included above a maximum threshold fixed by the mean peak value, as reported in Table 5. In this way, ()ˆZtvalues without cycle slips or with fewer of them were obtained for the reflector at both positions (Fig. 8).
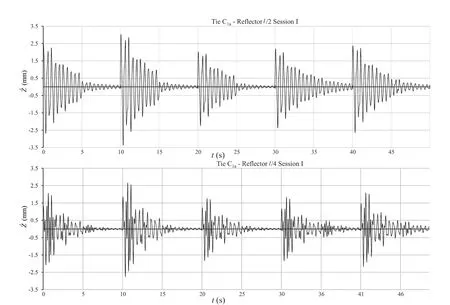
Fig. 8 Examples of representation of the experimental hourly diagram of the vertical vibrations of the reflector set at 1/2 and 1/4 of the length of tie C1a. On the abscissa, the time t (s) refers to the entire duration of a measurement session. The verticalvibration ()t (mm) is on the ordinate. The vertical grid shows the moments between one pull and the next.
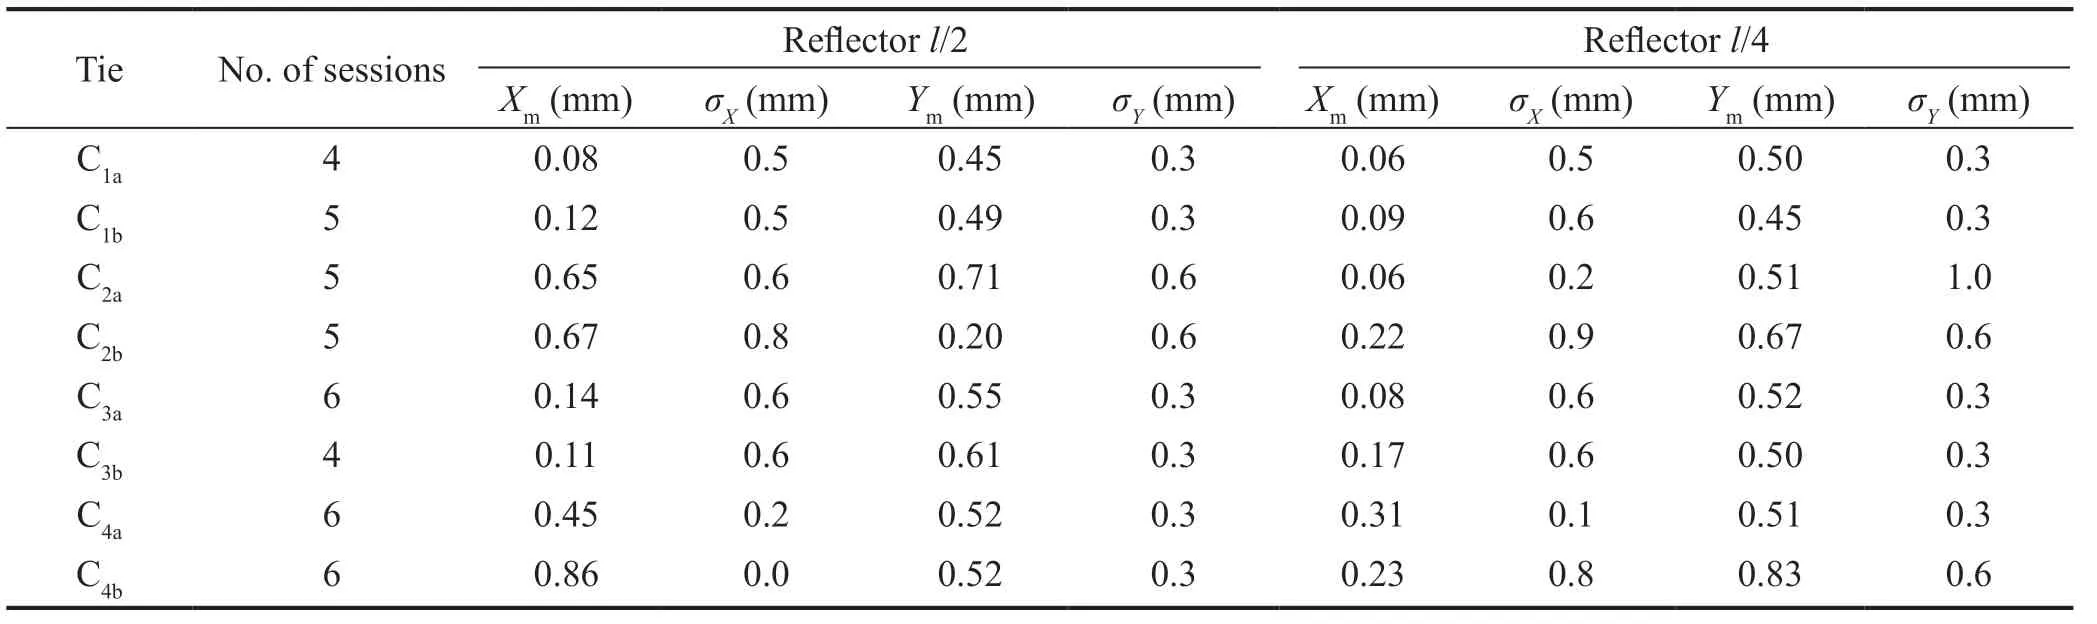
Table 4 Number of sessions, mean and standard deviation of the instantaneous X and Y coordinates of the center of the reflector at 1/2 and 1/4 of the tie length
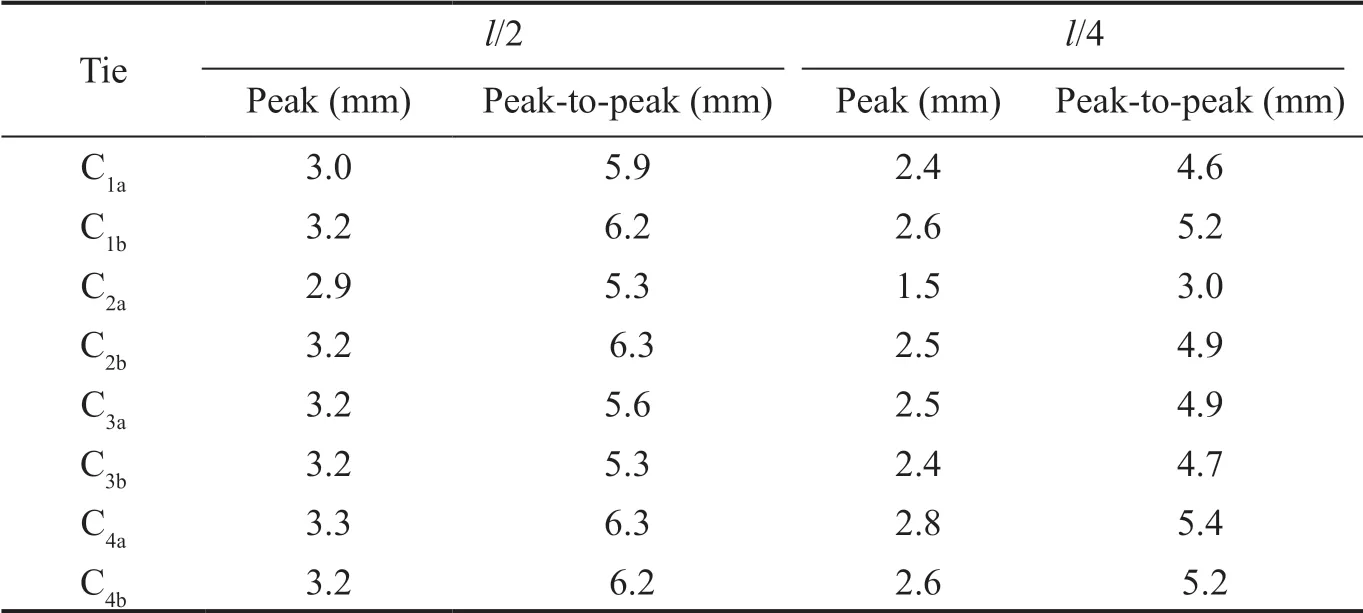
Table 5 Mean peak and peak-to-peak values of vibration amplitude of the ties with the reflector located at 1/2 and 1/4 of the tie length
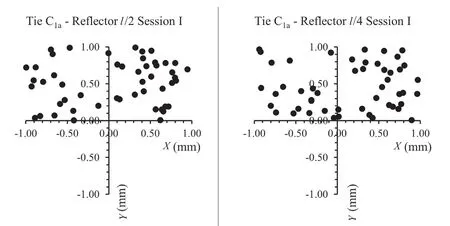
Fig. 7 Example of dispersion of the instantaneous X and Y coordinates of the center of the reflector positioned at 1/2 and 1/4 of the length of tie C1a in Session I
5.3 Calculation of the vibration frequencies of the ties
(SDOF). Input vibration values ()ˆZtwere treated with an 8th-order Chebyshev filter with a minimum cut-off frequency of 0.1 Hz. The spectra were determined with a code developed in Matlab language in Windows 10, varying the period of vibrationTfrom 0 to 3 s with a constant step of 10-3s. In this way,Twas varied by several decimals sufficient to obtain the vibration frequencies (which are the inverse) with the required precisions. Two examples of spectra obtained from the vibrations ()ˆZtof the reflector at 1/2 and 1/4 of the length of tie C1aare shown in Fig. 9.
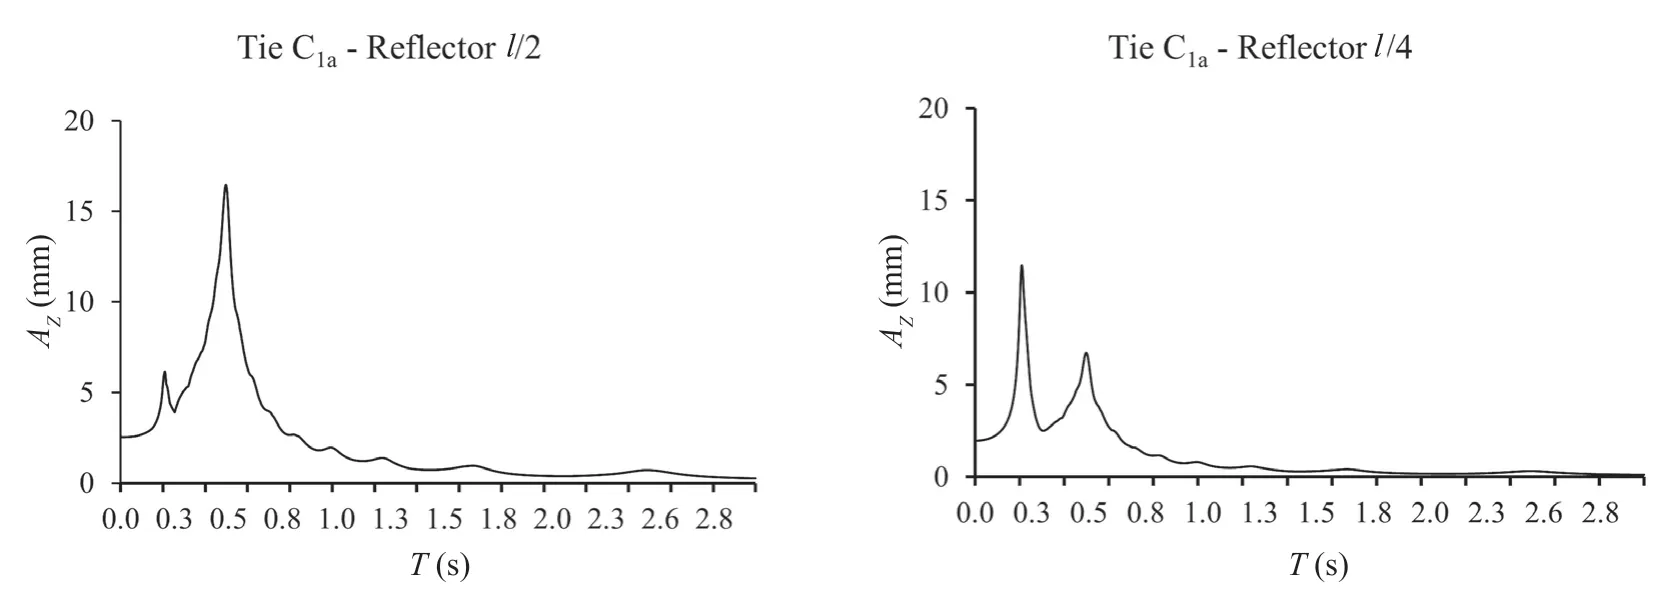
Fig. 9 Examples of spectra obtained from the vibrations of the reflector at 1/2 and 1/4 of the length of tie C1a. The period of vibration T (s) is on the abscissa and the vibration amplitude AZ (mm) is on the ordinate
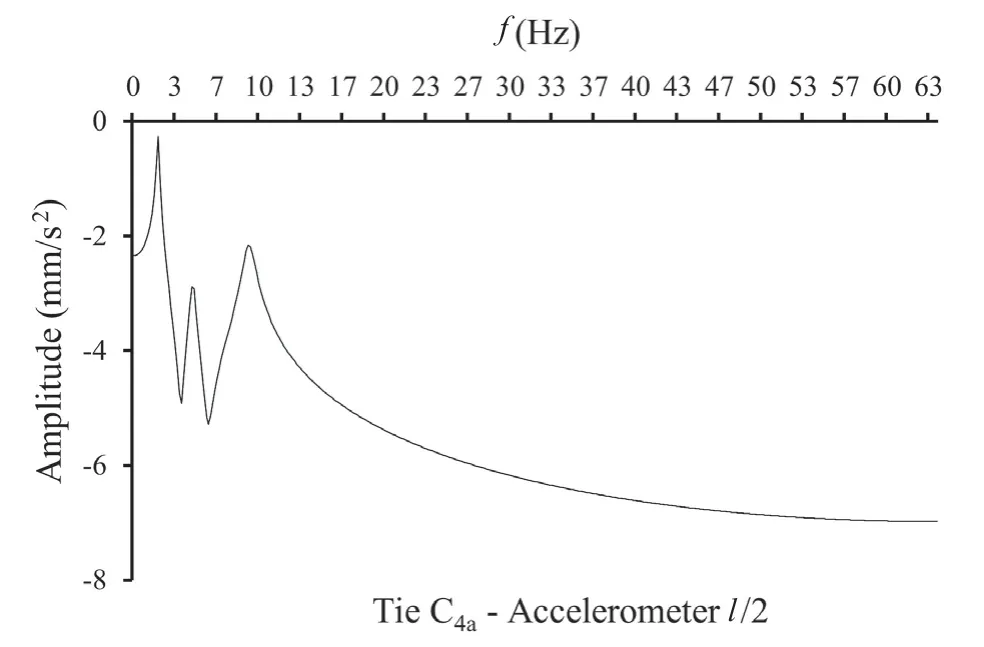
Fig. 10 Example of a frequency spectrum obtained from an accelerometric recording. Ordinate in logarithmic scale. The accelerometer was placed in the middle of tie C4a
Table 6 displays the estimates of the mean vibration frequencies of the ties, together with their standard deviations, at 1/2l(f1) and 1/4l(f2), calculated as the inverse of the period corresponding to the peaks of the spectra.
The frequencies reported in Table 6 refer to the first two vibrations, the first around 2 Hz and the second close to 5 Hz. It was not possible to estimatef2for tie 3 (~8 Hz) since it was higher than the limit of Nyquist′s theorem. The standard deviations are between 1 and 3 hundredths of Hz.
6 Data processing results
The first result involved the mean values of the instantaneousXandYcoordinates of the center of the reflector positioned at 1/2land at 1/4lof each of the eight ties (Table 4). Since the center of the reflector was made to coincide with the origin of the reference system (coordinate vertex (0, 0)), the difference with respect to the value (0, 0) is an indirect evaluation of the accuracy of the measurements. As can be seen from Table 4, theXmandYmvalues were close to zero for all eight ties, independently of the reflector position (at 1/2lor 1/4l). TheYmvalue was slightly higher due to the way the tie was vibrated: during the pull, a force was involuntarily generated also in theYdirection, to which this increase was attributed.
The results of the vibrationsZ(t) over time showed that the RTS best recorded the vibration amplitudes when the vibration frequencies were lower, i.e., when the reflector was at 1/2lrather than at 1/4l. This was confirmed by the higher slip percentages when the reflector was at 1/4land by the peak values and their standard deviations (Table 5). The peak values ranged from 1.5 to 3.3 mm, with a mean of 3.1 ± 0.15 mm for the reflector positioned at 1/2land of 2.3 ± 0.5 mm for the reflector at 1/4l(the latter standard deviation being almost triple the former).
Based on these results, the accuracy of the horizontal coordinates could be assumed to be equal to the value of the standard deviations reported in Table 4, that is, 1σX= 1σY≅± 0.5 mm. This accuracy could also be extended to the Z value measured during the oscillation of the tie: 1σZ≅± 0.5 mm. It should be underlined that this value was five times higher than the same coordinate measured in static conditions. Consequently, the vibrations of amplitude less than 1σZwere considered non-significant, which had negative consequences in the dynamic identification at frequencies greater than 3 Hz.
Also, the lack of extraction of the second frequencies of tie 3 (in bold - Table 6) is noted, since they were higher than half of the maximum sampling rate of the RTS.
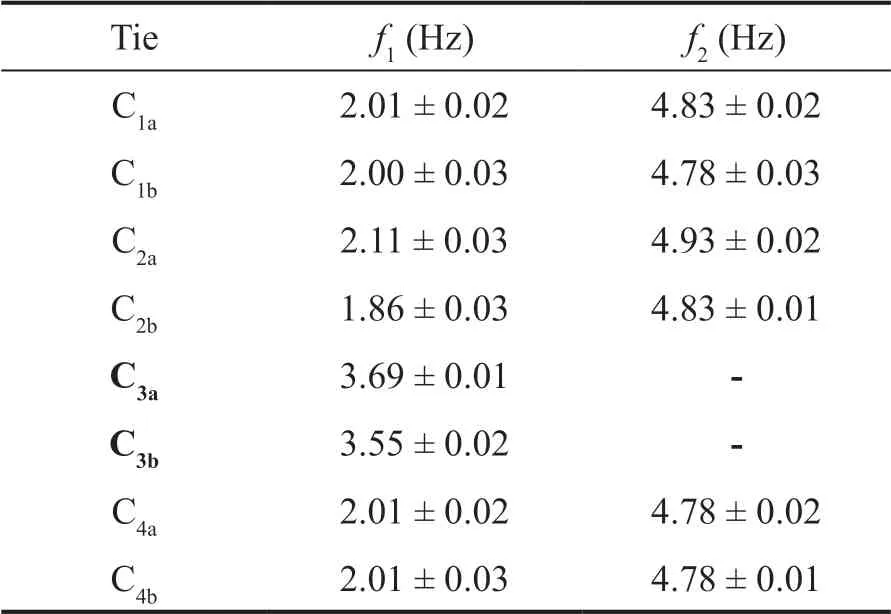
Table 6 Mean vibration frequencies of the ties and their standard deviations
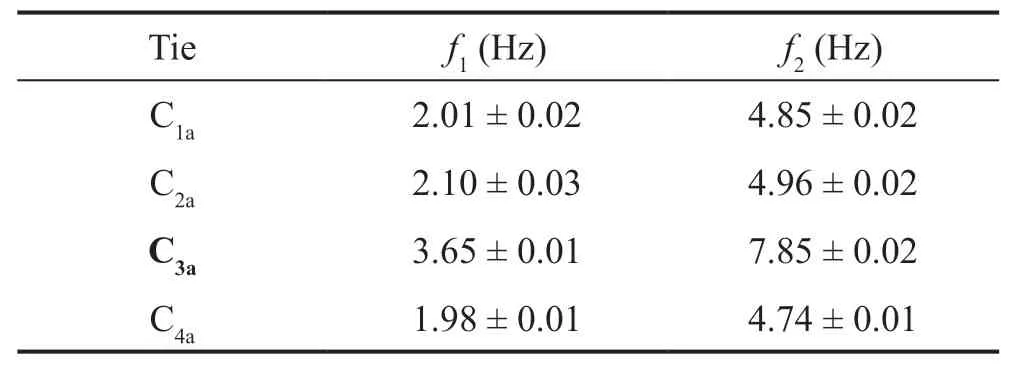
Table 7 Estimation of the vibration frequencies of the ties and their standard deviations using an accelerometer
7 Comparison of the result
The vibration frequencies of four of the eight ties were extracted from accelerograms measured with a seismic monoaxial piezoelectric accelerometer. The instrument, with a sensitivity of 10 V/g and a full scale of ±0.5 g, was calibrated in the laboratory before and after the measurements and attached to the ties with a steel clamp at 1/2 and 1/4 of the tie length. It was coupled with a signal conditioner, a 4-channel analog digital (A/D) card and a notebook computer that ran proprietary recording and archiving software developed in Labview code in Windows 10. The ties were made to vibrate by means of an impulse applied with a hammer weighing 1 kg. The recordings were carried out with a sampling rate of 128 Hz along the direction orthogonal to the tie axis, coinciding with theZcoordinate used in the experiment. At least three recordings per measurement session were performed to avoid aliasing problems. The accelerations were processed in the time domain with a 4th-order Chebyshev bandpass filter and cut-off frequencies of 0.1 and 25, while a classic FFT was used to determine the vibration frequencies.
An example of a frequency spectrum obtained from a recording with the accelerometer placed in the middle of a tie is shown in Fig. 10.
As can be seen from the example, the third vibration frequency of the tie also was shown in the accelerograms.
Table 7 lists the estimated mean vibration frequencies of the four ties, together with their standard deviations.
The first comparison (Table 8) involved the absolute and relative (percentage) differences between the recorded vibration frequencies and those extracted from the accelerograms, as well as the effect of these differences on the values of tensionN(in kN) and fixed support constraintG. The tensionNand the fixed support constraintGwere then obtained using the algorithm indicated in Section 3.2.
Table 8 shows absolute differences of the frequencies between 0 and 0.04 Hz (between 0 and 1.5% maximum). Translation into the corresponding values of tensionNand fixed support constraintGresulted in appreciable differences only in tie 2, respectively 3.3 and 0.23 kN (26% and 32%).
An additional comparison was carried out by repeating the calculation of the tension of ties C2aand C4awith an algorithm proposed by Pozzati (1977). The calculation was based on known values of the deflection at 1/2l(recorded in the preliminary test) and the load that produced it, as well as the restrictive assumption that ties were constrained at the extremities with perfect fixed support. Table 9 shows the values and differences (expressed in absolute terms) of the calculated tensionN(in kN).
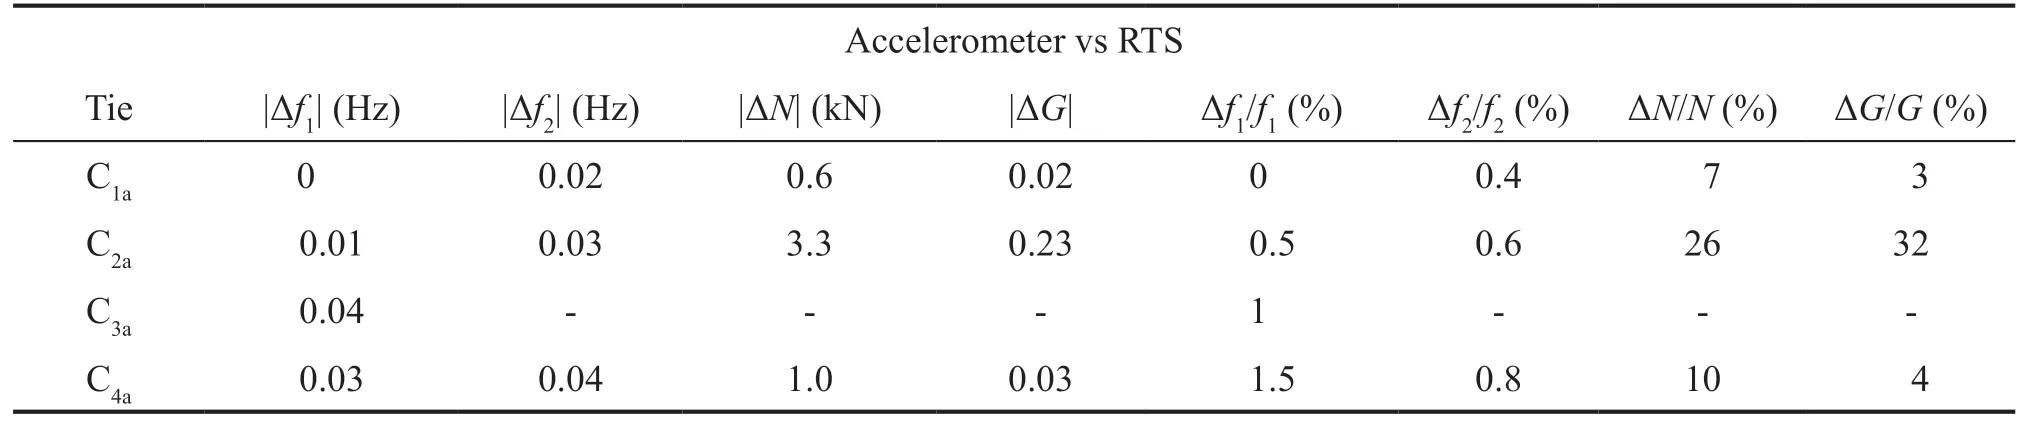
Table 8 Absolute and relative (percentage) differences in the vibration frequencies, tension, and fixed support constraint
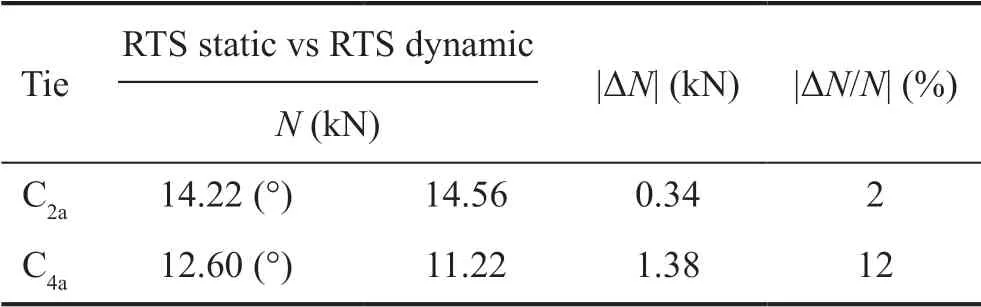
Table 9 Values and differences of the tension. (°) Perfect fixed support constraint
There was a maximum difference of 1.38 kN (~12%), attributed to the assumption of perfect fixed support constraint (equal to 1) rather than an error in estimation of the deflection.
8 Conclusions
At a recording rate of 10 Hz, the RTS was able to measure the vibrations of the ties with minimal slip percentages and with significant peaks only at vibration frequencies < 3 Hz, i.e., with the reflector in the middle of the tie. When the reflector was positioned at 1/4 of the tie length and its speed increased, the performances of the RTS appreciably decreased due to the loss of half of or entire recording cycles (cycle slips) related to the servomechanism, as also found by Psimoulis and Stiros (2007) and Stiroset al. (2008). This led to a reduction in the number of measurements recorded during the pull, rendering the frequency resolution of an FFT insufficient, and necessitating extraction of the vibration frequencies one by one by means of vibration spectra.
Moreover, the values of the dominant frequencies not subject to Nyquist′s theorem were lower than 5 Hz, and thus it was not possible to extract the frequencies of one tie.
Although the comparisons with the accelerometric measurements yielded encouraging results regarding vibration frequency differences (which did not determine significant variations in the tension and fixed support constraint), there remains the limit of automatic recording at 10 Hz, still too low to make possible the extension to dynamic identification methods.
In contrast, in the verification of the non-oscillating reflector, the servomechanism had no effect on the measurement and the almost non-existent losses of recording cycles were uninfluential. The deflection was measured with much greater accuracy than when the reflector was vibrating and the observed differences in tension were attributed to the proposed calculation algorithm.
Finally, the values of tension and fixed support constraint showed that all the ties were unloaded. Consequently, a plan for their re-tensioning and for verification of the structural conditions of the fixed supports was prepared.
杂志排行

Earthquake Engineering and Engineering Vibration的其它文章
- Dynamic shear modulus and damping ratio characteristics of undisturbed marine soils in the Bohai Sea, China
- Geotechnical engineering blasting: a new modal aliasing cancellation methodology of vibration signal de-noising
- Response prediction using the PC-NARX model for SDOF systems with degradation and parametric uncertainties
- Seismic behavior of multiple reinforcement, high-strength concrete columns: experimental and theoretical analysis
- Optimal design of inerter systems for the force-transmission suppression of oscillating structures
- Range of applicability of real mode superposition approximation method for seismic response calculation of non-classically damped industrial buildings