Flow and Leakage Characteristics in Sealing Chamber of a Variable Geometry Hypersonic Inlet
2022-02-10,*,,,,
,*,,,,
1. College of Mechanical Engineering, Nanjing University of Science and Technology, Nanjing 210094, P. R. China;
2. Beijing System Design Institute of Electro-mechanic Engineering, Beijing 100190, P. R. China;
3. State Key Laboratory of High-Temperature Gas Dynamics, Beijing 100190, P. R. China
Abstract: When the variable geometry hypersonic inlet is sealed with ceramic wafers, the cavity flows inside the sealing chamber can be affected by the boundary layer near the side wall. To study the influence of the boundary layer thickness near the side wall on the flow and leakage characteristics in sealing chamber, the numerical calculation of the cavity flow in the sealing chamber under different inflow boundary layer thicknesses is carried out. The results show that three-dimensional cavity flow structures are close to being asymmetric, and the entrance pressure of the leakage path can also be affected by asymmetry; with the increase of the thickness of the boundary layer, the pressure at the cavity floor and the seal entrance decreases. Finally, the existing leakage prediction model is modified according to the distribution rule of the cavity floor and the flow properties in the leakage path.
Key words:variable geometry inlet; ceramic wafer seal; vortex structure; leakage rate; asymmetry threedimensional cavity flow
0 Introduction
Hypersonic vehicles need to be used adjustable flow channels to meet the engine requirements of extending the operating range of flight Mach number. For the sake of smooth adjustment, there will be a gap between the movable panel and the side wall of the inlet. Under the hypersonic flight condition, the high-temperature gas will flow into the equipment cabin through this gap, causing the failure of electronic components, and even leading to equipment damage. High-temperature dynamic structural seals are required to seal this gap[1-3], which can provide the sealing performance while considering the normal operation of the regulating system. As a commonly used dynamic sealing material, the ceramic wafer has advantages of small specific gravity, high melting point, high hardness, good chemical stability, corrosion resistance, etc. It can ensure the normal operation of the variable geometry inlet when limiting leakage and insulating heat.
At present, the common sealing methods in the aerospace field are labyrinth sealing and other rotary sealing to reduce the leakage of the working medium in the engine[4-5]. Ceramic wafer seal is often used in the connection parts of various cabin sections, the control rudder shaft, and the movable engine panel. Steinetz[6]proposed the sealing method and the corresponding leakage model, and verified the effectiveness of the seal and the accuracy and scope of application of the calculation model through the experimental research. Ceramic wafer seals were first used in the X-51 scramjet engine. The high-temperature and high-pressure environment (1 373—1 640 K, 0.7 MPa) at the engine sealing position has brought great challenges to the seals. In the meantime, the seals also need to have strong anti-oxidation and friction resistance capabilities to ensure that they still adhere to the side wall after withstanding the thermal cycle.
The existing work on dynamic structural seals mainly focuses on sealing materials. The relevant performance parameters of the ceramic wafer are obtained through high-temperature thermal tests and the sealing reliability is analyzed. The leakage characteristics of the dynamic seal are rarely analyzed from the perspective of the cavity flow. In this paper, for the background of variable geometry hypersonic inlet, a seal structure model is established to study the flow properties and leakage laws in the sealing chamber by means of a numerical simulation method.
Fig.1 shows the inner sealing structure of an inlet. When the gap is sealed with a ceramic wafer, a cavity structure is formed above the sealing chamber. The internal static gas is driven by the highspeed incoming flow of the inlet to form a cavity flow[7-8], which is similar to the combined flow of the front and backward-facing steps. The cavity flow inside the sealing chamber can be changed by the boundary layer of the leading edge and side wall at the same time, and the flow properties are different from the typical three-dimensional cavity flow[9-10]. In the cavity flow, the fit tolerance between the ceramic wafer and the seal cavity results in two leakage channels around the seal; namely, the first leakage path between the ceramic wafer and the side wall, and the second leakage path formed between the wafer and the top surfaces. The rear of the wafer is an inclined coil spring structure, which aims to provide the sealing preload by utilizing the spring back performance of the spring.
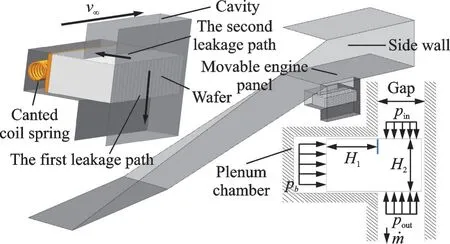
Fig.1 Sealing structure of the inlet
When the gas in the cavity flows through both sides of the cavity floor, it flows into the equipment cabin through the leakage path. Because the width of the leakage channel is much narrower than the sealing gap, the internal flow is the laminar flow between two nonslip parallel plates, which is directly affected by the pressure and temperature distribution generated by the cavity flow upstream on both sides of the floor. Also, leakage flow has little effect on the cavity flow. Therefore, the cavity structure and the seal can be separated. The flow characteristics in the cavity can be studied first, and then its influence on the leakage law can be explored.
1 Numerical Method
Because of the transonic flow in the cavity caused by the supersonic entrance, the three-dimensional compressible Navier-Stokes equations are solved to simulate the cavity flow inside the sealing chamber. Since it has advantages of low numerical dissipation and high resolution, Roe-FDS (Flux-difference splitting) scheme is used to discretize the convective flux. Time discretization using an implicit scheme and the turbulence model is twok-ωSST.
Figs.2(a, b) show the flow model of the side wall cavity and the computational grid. The cavity structure parameter: The ratio of length to width is 8∶1, and the ratio of depth to width is 3∶1. Therefore, the narrow cavity should experience an opentype flow field. The grid near the inner wall of the cavity and the side plate is densified, and the grid amount in the cavity is 860 000, accounting for 40% of the total.y+<1 meets thek-ωrequirements of the SST turbulence model near the wall.
Fig.2(c) shows the cavity and seal structure grid, the mesh nodes distribution above the seal is consistent with that in Fig.2(a) to ensure that the external flow field is not interfered with by grid factors during the comparative analysis of the calculation results.
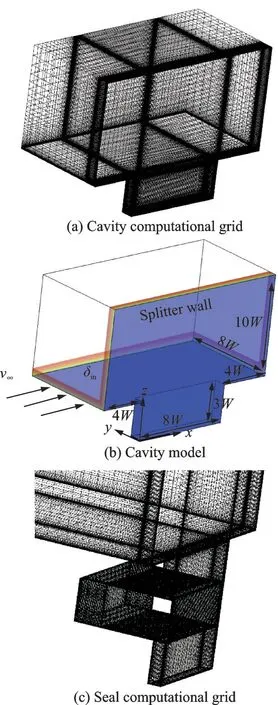
Fig.2 Model and mesh structure
Considering the application background in the variable geometry inlet, the inflow condition is set as follows: Mach=4.5, incoming static pressurep∞=11 000 Pa, and static temperatureT∞=360 K. The entrance velocity distribution is given to control the thickness of the incoming boundary layer. Because of the interaction between the side plate and the leading edge, both of them need to give the boundary layer thickness together. Therefore, the distance between the grid point and the wall surface is obtained by indexing all grid points at the entrance boundary through the judgment functionδl. And, the velocity distribution is given in combination with the 1/7 power law[11].

whereδinis the boundary layer thickness, which is set as 0.2W(width of the cavity), 0.6W, and 1.0W, respectively to simulate the cavity flow under different boundary layer thicknesses.
Steinetz[6]proposed a semiempirical formula for predicting the leakage rate of ceramic wafer seals. To study the influence of flow factors on the leakage characteristics, the factors causing the change of the leakage characteristics are omitted, due to the deformation of the seal structure caused by high temperature and pressure. Therefore, the test data correction part in the formula is dropped, and only the theoretical derivation part is reserved. The seal leakage rate per unit length is

wherepinandpoutare the inlet and outlet pressures of the sealing structure, respectively;h1andh2the leakage path widths between the wafer, the top plate, and the side wall; andH1andH2the lengths of the two leakage paths. In Eq.(3), the gas in the leakage channel is supposed to be isothermal, and the change of pressure along the sealing direction is ignored. Therefore, the formula only can apply to the situation where the temperature is litter change, and the leakage inlet pressure is evenly distributed along the flow direction. To apply the leakage prediction in the variable geometry inlet, the sealing model is modified based on the study of the flow properties and pressure distribution of the sealing chamber.
2 Validation
The experimental cavity flow database provided by Ref.[12] is used for validation. The ratio of the length, width and depth of the cavity structure in the selected test sample isL∶W∶D=8∶5∶1.The inflow condition is set as follows: Mach=1.5;Re(Reynolds number per unit length)=2×10⁶/ft,p=13 408 Pa, andT=224.13 K. Fig.3 shows the comparison between the numerical simulation and experiment date of the pressure coefficients on the centerline of the leading edge, front wall, floor, rear wall, and rear edge of the cavity. It can be seen that the difference between those two results is minimal, especially in the part of the rear wall and the rear edge. The maximum pressure error is 7%, and the overall pressure coefficient distribution trend is the same, which indicates that the calculation method can satisfactorily simulate the pressure distribution on the cavity floor.

Fig.3 Comparison of pressure coefficients
3 Results and Analysis
3.1 Flow structure within the cavity
Fig.4 shows the flow structure with the new Omega criterion[13]and pressure contour, where the thickness of the incoming boundary layer is 1.0W. The leading-edge vortex nears the front wall of the cavity in Fig.4. The front corner vortex is located at the junction of the front wall and the floor of the cavity. The front vortex is located on the right side of both two vortices. Occupying the middle to the back half of the cavity is a recirculation zone, which is the defining feature of an open-type cavity flow[14]. The impinging of the shear layer on the rear wall occurs near the top of the cavity (z/W≈ 2.94—2.95), and the presence of bifurcation lines at the same locations in slice B is evidence of flow separation. The flow above the bifurcated line leaves the cavity upward, while the flow below the bifurcated line flows downward along the rear wall, and flows in the reverse direction at the corner of the rear wall. During the return process, the flow gradually rises upward until it joins the shear layer and enters the recirculation vortex along the flow direction. The higher separation point of the shear layer allows the recirculation zone to almost fill the second half of the cavity. The structure of the trailing edge vortex near the rear wall of the cavity at the outside of the recirculation zone is similar to that of the leading-edge vortex, and the same similarity is found between the rear corner vortex and the front corner vortex. Different from these vortices close to the center plane of the cavity or symmetrically on both sides of the cavity, the single tornado[15]vortex and streamwise vortex appear near the sidewall, which indicates that the flow in the cavity is asymmetric.
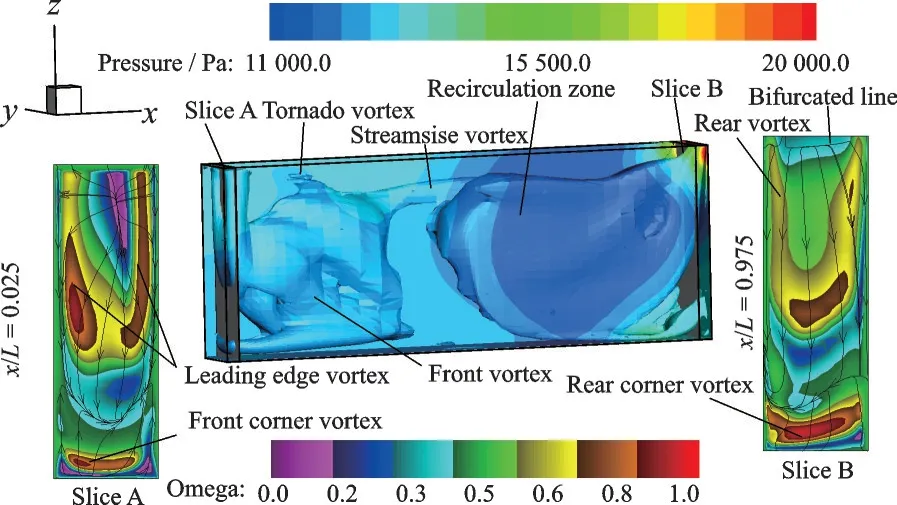
Fig.4 New Omega criterion iso-surface (Omega=0.52) colored with pressure
Fig.5 shows the streamlines within the cavity for thex-zplane aty/d=0.02,y/d=0.5, andy/d=0.98 in the three cases (case 1:δin=0.2W; case 2:δin=0.6W; case 3:δin=1.0W). From all three cases, significant differences can be found in the flow characteristics of the front vortex in three differentx-zplanes. Compared with the obvious vortex structure in the central plane, there is no sign of the existence of any front vortex at the same position on the far side of the wall(y/d=0.98), which is replaced by a convergence line.
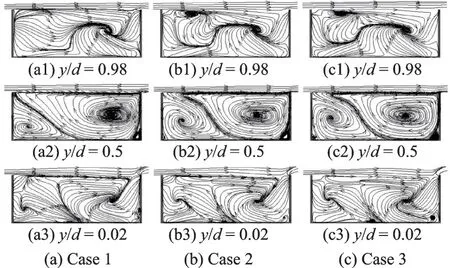
Fig.5 Streamlines in the x-z plane of cases 1, 2 and 3
The direction of rotation of the front vortex and the front corner vortex below causes the flow to enter the recirculation zone along the convergence line, which is the main source of mass in the recirculation zone. The mass flowing into the recirculation zone is transported from the position far away from the side wall to the position near the side wall in a lateral movement and then flows into the front vortex to complete the cycle.
Compared with Figs.5(a2,b2,c2), it can be found that while the thickness of the boundary layer increases, the space occupied by the front corner vortex in the front half of the cavity expands continuously. The position of the leading edge vortex also rises with the contact line between the front corner vortex and the front vortex. The vortex structure in the cavity exhibits a tendency to extrude toward the shear layer.
3.2 Summary of flow structure in the sealing chamber
Fig.6(a) shows the streamlines in they-zplane atx/W=4 of the sealing chamber, from which the combination of leakage and cavity flow can be observed. The vortex core near the wall corresponds to the streamwise vortex in Fig.2. Driven by the pressure difference between the outlet and the bottom of the cavity, the gas escapes through two leakage paths. The plenum chamber exists to preserve the deformation space of the spring that causes the fluid through the second leakage path to gather there. The upstream and downstream of the chamber correspond to the inflow and outflow sections of the second leakage path respectively. From Fig.6(b), it can be found that the pressure distribution in the outflow section is consistent along the transverse direction of they-axis. Compared with the first leakage path, the outlet section of the second leakage path shows excellent two-dimensional properties, which is entirely due to the cushioning characteristics of the plenum chamber.
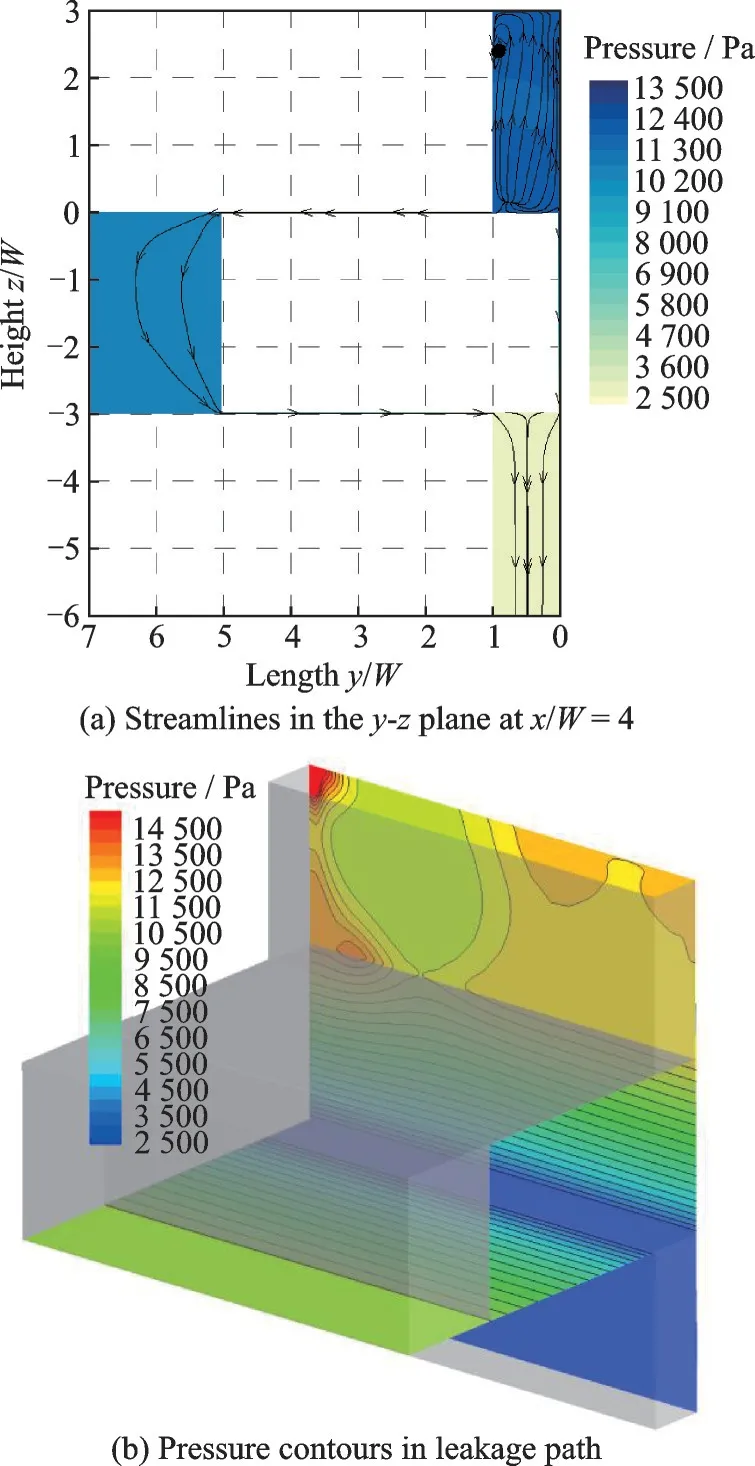
Fig.6 Pressure contours in the sealing chamber
Through previous research, Fig.7 shows the graphical representation of the vortex structure and streamlines in the sealing chamber.

Fig.7 Diagrammatic summary of the flow streamlines and vortex structure in an open-type cavity with L∶D∶W=8∶3∶1
3.3 Cavity floor pressure distribution
Fig.8(a) shows the pressure coefficient distribution of the cavity floor of the three cases. All these results indicate that the pressure coefficient decreases gradually from the front end, and the relatively sparse contour distribution indicates that the fluid velocity above this region (x/W<4) is devoid of any high-speed flow structures. In the (x/W≈ 5—6) section, the pressure coefficient reduces to the minimum, which appears near the side wall. The pressure coefficient rises rapidly in the latter half of the bottom section (x/W≈ 6—8), and the dense pressure contour distribution indicates that the shear layer fluid flows downward along the back wall of the cavity at this position. By comparing the positions of the maximum of the three cases, it can be found that with the increase of the boundary layer thickness, the maximum offsets away from the side wall. The momentum in the shear layer decreases as the boundary layer increases and the flow near the bottom plate approaches stagnation, which leads to a decrease in the total pressure coefficient in Fig.8(a). The pressure coefficient curves in Fig.8(b) are on both sides of the floor. The location near the side wall isy/W=0.02, and the location far from the wall isy/W=0.98, corresponding to the entrance of the first and second leakage paths, respectively. In the front section (x/W=0—3.8), the pressure coefficient on both sides is consistent and decreases linearly. However, in the bottom half of the floor, the maximum pressure coefficient moves away from the side wall with the increase of the thickness of the boundary layer, making the maximum value of the far wall side in case 3 exceed the near wall side, while the overall pressure coefficient decreases, causing the pressure coefficient of the near wall side in case 1 to be far greater than that in other examples.
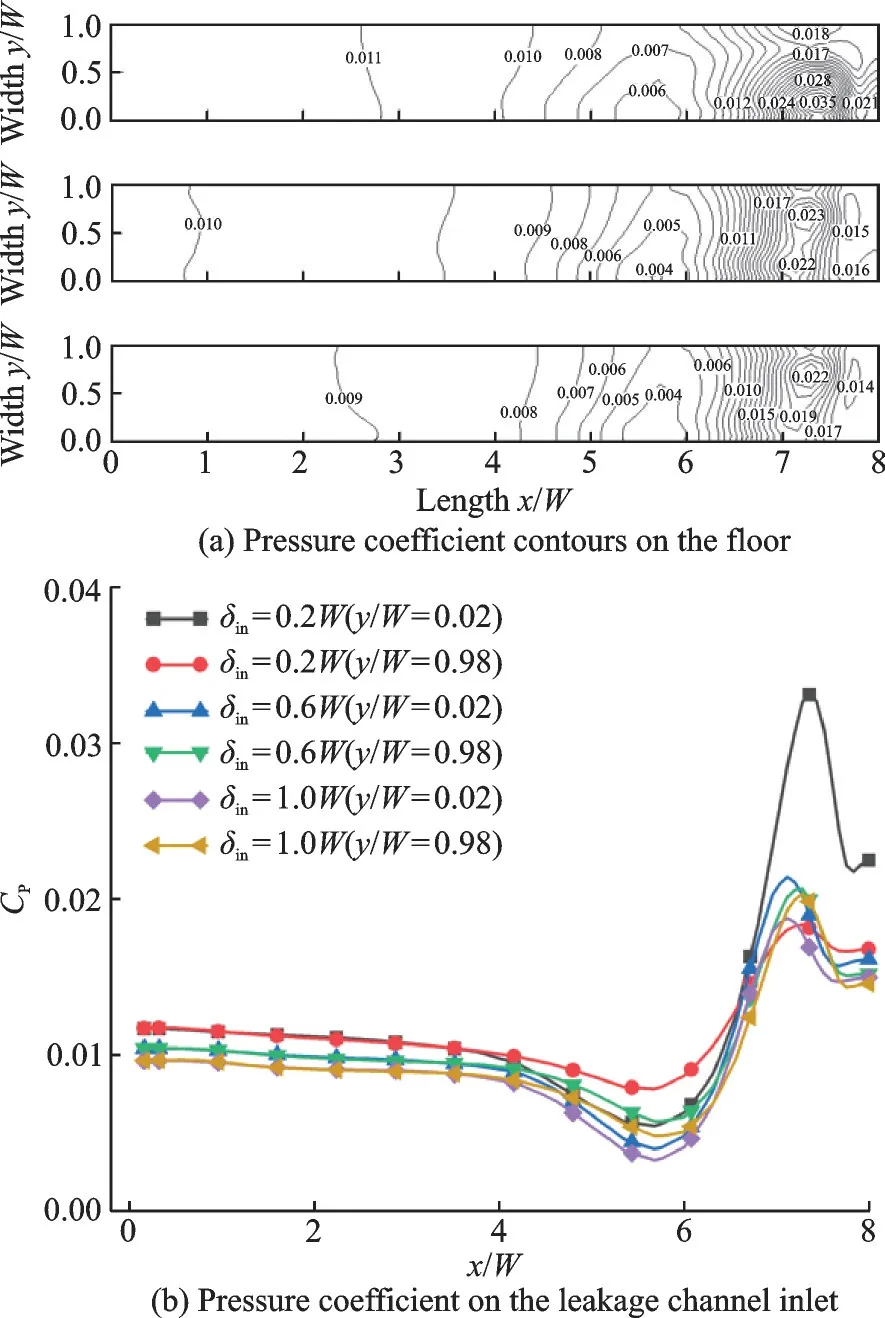
Fig.8 Pressure coefficient on the floor of cavity
The leakage prediction formula proposed by Steinetz is derived from the non-slip flat plate laminar flow under isothermal conditions. Besides, it is considered that the seal inlet pressure is equal to the back pressure and is evenly distributed. The change in the leakage amount is a linear growth process when it increases along the seal length. For the above reasons, the formula can be used under the following conditions

Therefore, the distribution of parameterp2is an important basis for calculating leakage. Fig.9 shows the square of pressure as the function of leakage distance. In the result ofx/W=1(at the first leakage path) andx/W=4(at the second leakage path), the square of pressure decreases linearly in the leakage path. Curves (x/W=7.2 andx/W=5.8) represent the maximum and minimum positions in Fig.8(b), respectively, which shows a parabolic trend at the inlet of the leakage channel, but it still reduces linearly at the outlet.
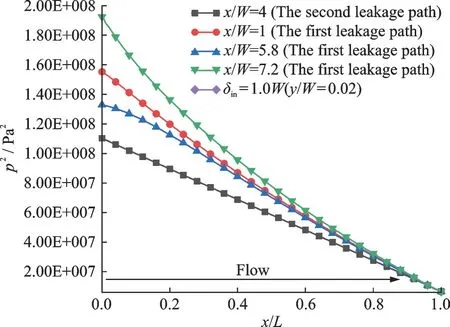
Fig.9 Square of pressure in leakage channel
3.4 Modification of leakage calculation model
The non-uniform pressure distribution at the entrance of the leakage channel under the influence of cavity flow makes Steinetz’s computational model not completely applicable. Therefore, the model is modified through the research in the previous section.
Because the square of pressure decreases linearly in the outflow section of the second leakage path and the first half of the first leakage path

which meets the requirement of Eq.(4), furthermore. Taking the inlet and outlet parameters of the outflow section into Eq.(3) yields

The pressure in the outflow section is evenly distributed along the sealing direction. Considering that the mass flow rates of the inflow section and the outflow section are equal, it is completely feasible to calculate the leakage rate in the second leakage path through the outflow section

wherepbandTbare the pressure and temperature in the plenum chamber, respectively.
Similar to the above, the pressure at the quarter of the first leakage path can be regarded as the inlet pressure of the first half section of the first leakage path. For this part

Besides, the leakage rate of the latter half section of the first leakage path can be calculated by the linear change of the square of the pressure at the outlet. The temperature shall also be changed to the outlet temperature. As a result, the mass flow through the second half of the first leakage path(x/W>4) is found by the temperature profile over the seal lengthx

Finally, the leakage mass can be expressed as

It can be seen from Table 1 that the decrease in the boundary layer thickness leads to an increase in the seal leakage rate. Meanwhile, compared with Steinetz’s model, the modified model and numerical simulation results are in better agreement, which verifies the accuracy of the model. The error comes from the inhomogeneous pressure distribution in the first leakage path.
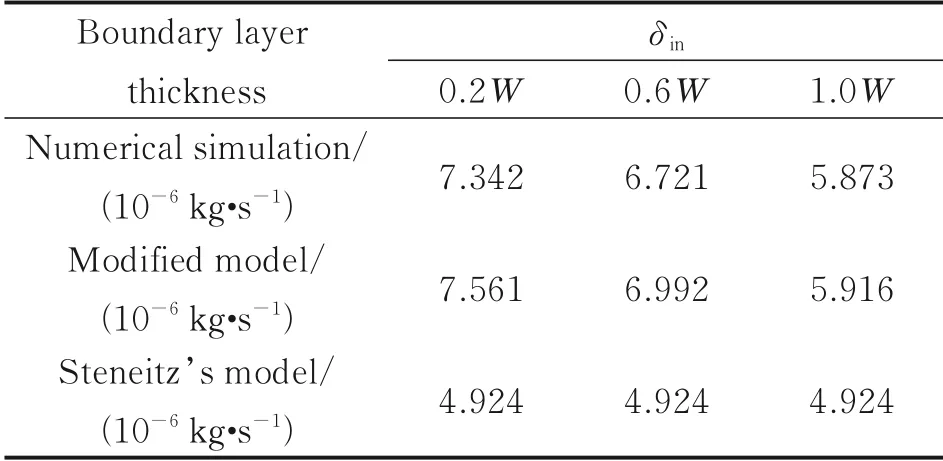
Table 1 Comparison of numerical calculation and predicted leakage rates under different boundary layer thicknesses
4 Conclusions
The flow and leakage characteristics in the sealing cavity of the variable geometry hypersonic inlet are studied by numerical simulation.
(1) The flow in the seal chamber is a three-dimensional asymmetric open-type cavity flow under the influence of the boundary layer of the side plate. After being affected by the asymmetry, the pressure distribution of the two corresponding leakage channels on both sides of the cavity bottom shows that the pressure gradient at the inlet of the first leakage path is smoother than that of the second leakage path.
(2) As the thickness of the boundary layer increases, the vortices tend to squeeze toward the back wall of the cavity and the shear layer. Meanwhile, the pressure coefficient at the bottom of the chamber falls, thus reducing the inlet pressure of the leakage channel and leading to the decrease of the pressure difference between the inlet and outlet. Therefore, the sealing leakage is abated and the sealing performance is improved.
(3) According to the flow characteristics of the cavity configuration calculated in this paper, the existing seal model is modified, and the reliability of the model is verified by comparing it with the numerical simulation results.
杂志排行
Transactions of Nanjing University of Aeronautics and Astronautics的其它文章
- Effects of Lobe Peak-to-Trough Width Ratio on Mixing and Combustion Performance in ATR Combustors
- Numerical Investigation of an Active Jet Control Method for Hypersonic Inlet Restart
- Path Planning for Lunar Surface Robots Based on Improved Ant Colony Algorithm
- Iterative Identification of Robot Dynamic Parameters Based on Logistic Function
- Adaptive Tracking Control for Diffractive Film Based on Nonlinear Sliding Mode
- Aircraft Optimal Separation Allocation Based on Global Optimization Algorithm
