Effects of Lobe Peak-to-Trough Width Ratio on Mixing and Combustion Performance in ATR Combustors
2022-02-10,,,3*,,,,3
,,,3*,,,,3
1. Institute of Engineering Thermophysics, Chinese Academy of Sciences, Beijing 100190, P. R. China;
2. School of Aeronautics and Astronautics, University of Chinese Academy of Sciences, Beijing 100190, P. R. China;
3. Innovation Academy for Light-Duty Gas Turbine, Chinese Academy of Sciences, Beijing 100190, P. R. China;
4. Beijing Key Laboratory of Distributed Combined Cooling Heating and Power System, Chinese Academy of Sciences, Beijing 100190, P. R. China
Abstract: The air-turbo-rocket (ATR) engine is a promising propulsion plant for achieving numerous surface and air launched missile missions. The application of lobed mixer in the ATR combustor can promote the mixing of the fuelrich gas and the air, thus improving the engine performance significantly. The numerical simulation method was conducted to explore the effects of lobe peak-to-trough width ratio on mixing and combustion performance in ATR combustors. Results show that: For a given peak lobe width b1, the combustion efficiency and total pressure loss decrease with the increase of trough lobe width b2; For a given b2, the combustion efficiency and total pressure loss decrease with the increase of b1; The fan-type lobed mixer with smaller b2 has a better effect on promoting the combustion efficiency in the region near the ATR combustor center line than that with a pair of parallel side walls. The total pressure recovery coefficient reaches more than 0.99 at the exit of combustor in nonreactive combustion while the total pressure loss reaches more than 4% in the reacting combustion. Compared with the mixing process, more than 80% of the total pressure loss is caused during combustion.
Key words:ATR combustor; lobed mixer; lobe peak-to-trough width ratio; mixing; combustion; streamwise vortex
Notations
LLobe length (mm)
nLobe number
αLobe inner penetration (°)
βLobe outer penetration (°)
bLobe width (mm)
b1Lobe width at the peak of the trailing edge (mm)
b2Lobe width at the trough of the trailing edge (mm)
Lobe peak-to-trough width ratio
STVmaxMaximum streamwise vorticity (s-1)
SPVmaxMaximum spanwise vorticity (s-1)
wzNormalized streamwise vortex
DCombustor diameter (mm)
U0Axial velocity of air at the inlet (m/s)
u,v,wMean velocity components (m/s)
x,y,zCartesian coordinate system
ρDensity (kg/m3)
Mass flow rate (kg/s)
kTurbulent kinetic energy
KAveraged turbulent kinetic energy
iTurbulent intensity
IAveraged turbulent intensity
UmMean velocity (m/s)
TTotal temperature (K)
ηthMixing efficiency
ηCombustion efficiency
σTotal pressure recovery cofficient
T0Combustion temperature at constant pressure (K)
p*Total pressure (Pa)
Subscripts
a The core flow
b The bypass flow
in The entrance of the combustor
mix The mixing flow
0 Introduction
The air-turbo-rocket (ATR) is an air breathing engine which operates like a turbojet engine at subsonic speeds and a ramjet at supersonic speeds[1-2]. It is the perfect propulsive device that can generate net positive thrust from sea-level static conditions toMa5—6 flight conditions without a booster propulsion system[3]. The specific thrust reaches up to 1 960 Ns/kg when the ATR engine accelerates from static to supersonic flight condition. The specific thrust is comparable to solid propellant ramjets during cruise (5 880—11 770 Ns/kg)[4]. As shown in Fig.1, the major components are the inlet, compressor, gas generator, turbine, combustor and nozzle. Air enters the engine through the inlet and is compressed by the compressor which is driven by the turbine. The turbine is powered by a gas generator. The effluent fuel-rich gas and the air then enter the combustor through the core and bypass flow channels respectively and get discharged by the nozzle. A large number of experimental studies have been carried out to investigate the ATR engine performance since 1980s due to its superior performance[5-7].
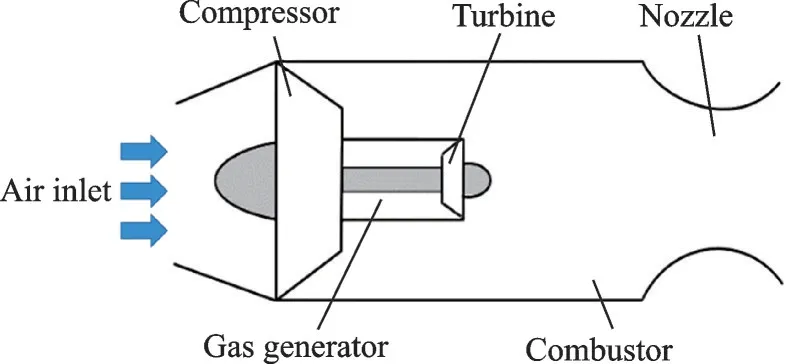
Fig.1 Schematic of ATR engine
The combustor is the key component in ATR combined cyclic power system. The ATR combustor has advantages of compact structure, small volume and weight. Accordingly, the basic requirement for the ATR combustor is to realize maximum combustion efficiency over the wide ATR operating range with reliable ignition[8]. Common methods to stabilize the flame in ATR combustion chambers include the flame holder[9]and the lobed mixer. The application of the flame holder is limited because the fuel-rich gas discharged from the turbine may react with the air immediately and lead to the erosion of the flame holder. By comparison, the lobed mixer is more widely used in the ATR combustor to realize stable and high-efficient combustion.
The lobed mixer is an efficient mixing enhancement device, whose convoluted trailing edge can induce large scale streamwise vortices and increase the interfacial area between the core and bypass flows[10]. In addition, the lobed structure can provide some gains on the net thrust and suppress noise as well as the infrared signal when it is used in the nozzle of turbofan engine[11-13]. A series of static scale model tests were conducted to evaluate influences of lobe geometric parameters on the performance of a high bypass ratio engine exhaust system[14-16]. The study established a significant technology data base to aid the aero-thermodynamic design of exhaust system mixers for high bypass ratio turbofan engines. In addition to the basic structural parameters, profile modification had been considered to improve the performance of lobed mixer. Yu et al.[17-19]conducted experimental investigations to study the mixing characteristics of scalloped lobed mixers. Scalloping was achieved by eliminating up to 70% of the sidewall area at the penetration region of each lobe. The results were compared with the corresponding mixers without scalloping. Three trailing edge configurations were considered in the research, namely a square wave, a semicircular wave and a triangular wave. The results indicated that the lobe trailing edge configurations may be more important than the penetration angles for the benefit of mixing enhancement. Belovich et al.[20]took velocity measurements in a coaxial jet geometry where the inner jet was a lobed mixer nozzle under different velocity ratios. Results showed that the three different velocity ratios produced three different mixing mechanisms. Mao et al.[21]employed hot-wire anemometry (HWA) and laser-Doppler anemometry(LDA) to measure and evaluate the respective characteristics of the Kelvin-Helmholtz(K-H) vortices and the streamwise vortices generated in the wake of a single-lobe forced mixer, at two velocity ratios of 1 and 0.4. The K-H vortices generated in the planefree shear layer (flat plate) and the convoluted plate have been compared. Sheng et al.[22]conducted numerical investigations of jet mixing in the lobed nozzles with a central plug and alternating-lobe nozzles in pumping operation. The effects of the central plugs with the wake ranging from attached to separated flow on the mixing were analyzed, along with the mechanism of improving the mixing performance in a “sword” alternating-lobe nozzle. Compared wtih the lobed nozzle with a central plug, the improved sword alternating-lobe nozzle can achieve a higher mixing effectiveness with much less pressure loss, which is preferred in situations when the power loss of the engine is restricted.
In terms of the mechanism of mixing enhancement, a significant amount of experiments and numerical simulations had been conducted to gain deeper understand of the lobed mixer. Paterson[23]first studied the flow field within a model turbofan forced-mixer nozzle bylaser-Doppler velocimeter(LDV) to provide detailed velocity and thermodynamic state variable data for use in assessing the accuracy and assisting the further development of computational procedures for predicting the flow field within mixer nozzles. It was found that the nozzle mixing process was dominated by strong secondary flows exist in the mixing region and axially oriented vortices having scales on the order of the lobe dimensions. Werle et al.[24]adopted water tunnel flow visualization studies that employ colored dye injection to track streamlines generated in the wake of a splitter plate with a large scale convoluted trailing edge. Results showed that the wake structure displays a three-step process by which the vortex cells form, intensify, and thereafter break down. Eckerle et al.[25]acquired interior mean velocity measurements as well as the turbulence parameters downstream of the forced mixer using a two-component LDV system for two velocity ratios. The study indicated three regions of vortex development in the mixing region where initially secondary flow is generated by the lobed mixers, the flow induces a series of tight counter-rotating vortices within each cell, and then the vortices break down resulting in a significant increase in turbulent mixing. Skebe et al.[26]conducted an experimental investigation with three planar mixer lobe models by LDV and total pressure loss measurements. The research confirmed that a periodic array of large-scale counter-rotating streamwise vortices is shed from the trailing edge of mixer lobes, with the transverse scale of these vortices comparable to the lobe height and their spanwise scale one-half the lobe wavelength. A principal result of this study was that the flows within lobed mixers were predominantly inviscid, with boundary layer effects confined to lobe surface regions. Hu et al.[27-30]performed a large number of experiments to study the flow characteristic in a lobed jet flow by PIV system. Simultaneous measurement data of all three components of the velocity and vorticity vector fields were gained and the evolution and interaction characteristics of the large scale streamwise vortices and azimuthal K-H vortices were revealed very clearly and quantitatively. Nastase et al.[31]quantified the performance of both lobed jets compared to the reference circular jet and discerned the role played by the lobes from the one played by the deflection angles in the mixing enhancement. Brinkerhoff et al.[32]studied the roles of large-scale, instability-driven transient flow structures and smaller-scale turbulence on the flow development within and downstream of the lobed mixer through point measurements with hot-wire anemometry and a series of complementary unsteady Navier-Stokes simulations. Large-scale vortices downstream of a lobed mixer are investigated experimentally using a nanoparticle-based planar laser scattering experimental system by Fang et al[33]. Comparison of vortex sizes indicates that streamwise vortices contribute almost 80% of mixing enhancement, which is substantially higher than what could be expected from the increase of the interfacial surface area, especially in the far field of the present compressible mixing layer. Cooper et al.[34]conducted numerical simulations of an incompressible jet mixing flow exhausted from a circular lobed mixer/nozzle using a Reynolds averaged Navier-Stokes (RANS) approach with a modest number of unstructured tetrahedral cells and four widely used turbulence models. The calculations of the turbulence models were assessed based on the DP-SPIV measurement results. It is found that thek-εrealizable turbulence model provides the most accurate prediction of the lobed jet mixing flow among the four turbulence models. Tsui et al.[35]developed a finite volume procedure using the curvilinear nonorthogonal grid together with the non-staggered arrangement of the nodal points to examine the flow in the multilobe mixer. Bennia et al.[36]dealt with experiments and large-eddy simulations of lobed and swirling turbulent thermal jets for heating, ventilation and air conditioning system (HVACS) applications to optimize the distribution of air and the thermal field. Results revealed that the results obtained with the large eddy simulation / wall-adapting local eddy-viscosity (LES/WALE) and LES/K-epsilon turbulence (LES/K-ET) models are respectively in good agreement with the experimental results of the lobed and swirling jets.
According to the above discussions, the application of lobed mixers can promote the mixing of the core and bypass flows in a relatively short distance, which will increase the ATR combustion efficiency significantly. In this paper, numerical simulation methods were conducted to investigate the influence of lobe peak-to-trough width ratio on fuel-air mixing and combustion performance in ATR combustors. The results presented in this paper are valuable to the design and optimization of ATR combustors.
1 General Idea and Theory
1.1 Physical model
The lobed mixer has axisymmetric structure, a 1/4 simplified combustor model with periodic boundary conditions is built in order to decrease the computing cost on the premise of ensuring the calculation accuracy (Fig.2). Both the core and bypass ducts are circular, through which the fuel-rich gas and air enter the combustor separately. The core passage has an inner diameter of 226 mm, outer diameter of 266 mm. The internal and outside diameter of the bypass are 272 and 455 mm. The length of the entrance section, combustor and nozzle are 100, 800 and 100 mm,respectively.
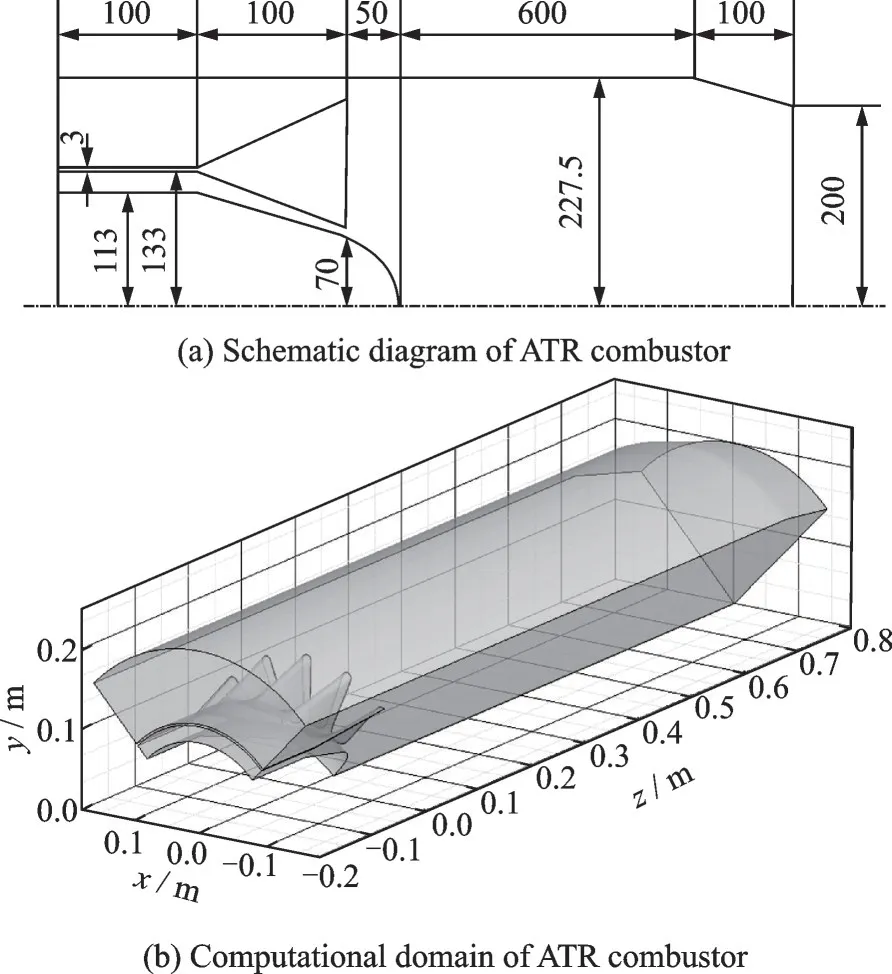
Fig.2 Structural sketch of lobed ATR combustor
Fig.3 shows the geometry parameters of the lobed nozzle in the present study. The lobe number is 16(n=16), the length is 100 mm(L=100 mm), the outer and inner penetration angles areα=18° andβ=28.5°, respectively. For the regular lobed mixer, the width of each lobe at the trailing edge is constant. Considering the fan-type lobe does not have parallel side walls at the trailing edge like the regular lobe, the concept of lobe peak-to-trough width ratiois proposed. The maximum lobe width near the peak is defined asb1and the minimum lobe width near the trough is defined asb2, hence, the lobe peak-to-trough width ratiocan be defined as the ratio ofb1tob2(=b1/b2). The values ofb1are assigned as 12, 18, 24 mm and the values ofb2are set as 8 and 12 mm. Thus, a group of six lobed mixers are built (Table 1, Fig.4).
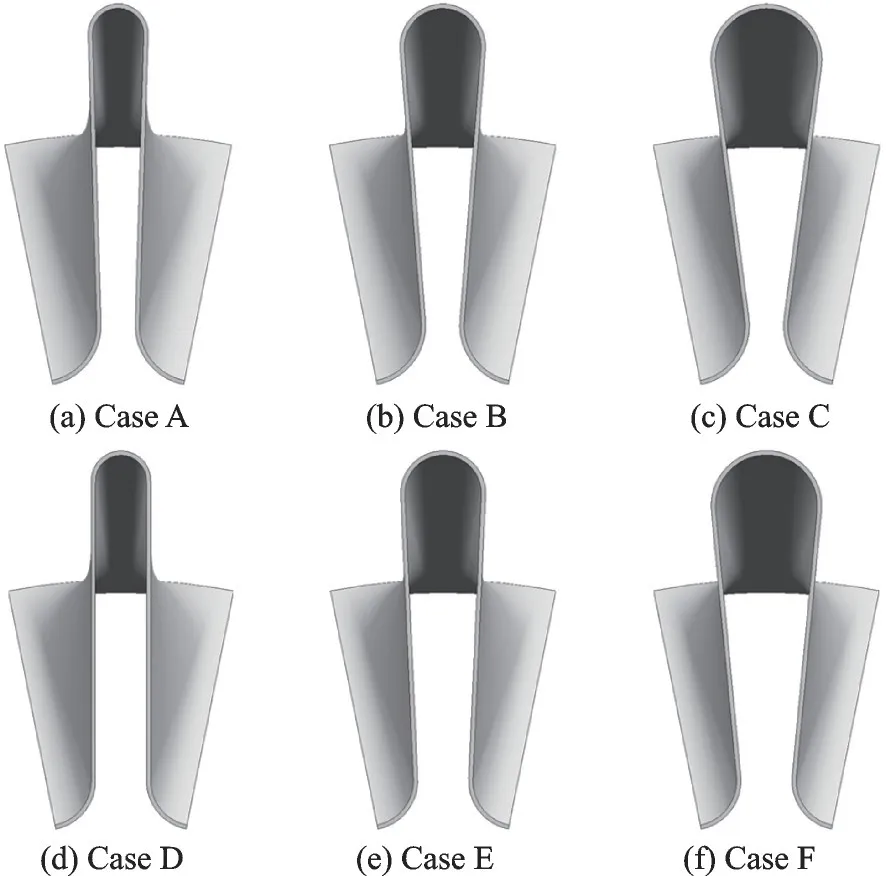
Fig.4 Model diagram of Cases A—F
Table 1 b1, b2 and of different cases
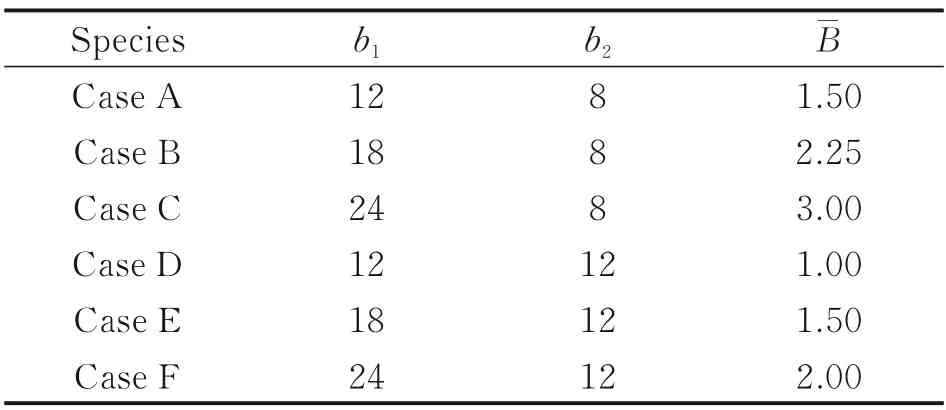
Table 1 b1, b2 and of different cases
Species Case A Case B Case C Case D Case E Case F b1 B-12 18 24 12 18 24 b28 8 8 12 12 12 1.50 2.25 3.00 1.00 1.50 2.00
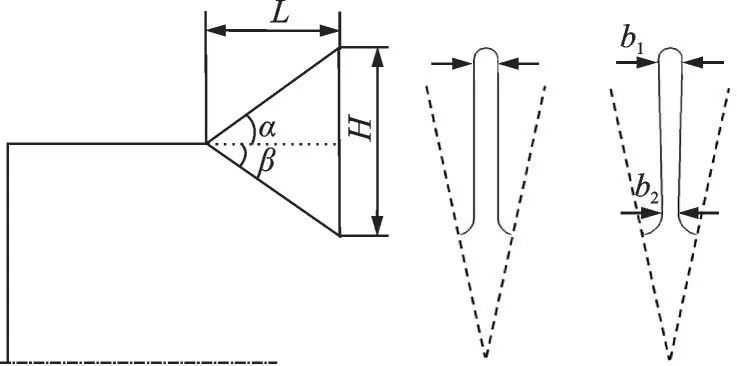
Fig.3 Structural sketch of lobed mixer
1.2 Boundary conditions and mesh
Liquid oxygen (91 K) and Jet-A kerosene (C12H23, 300 K) burn at pressure 25 bar and massratio 1.155 in the gas generator. The combustion products and their mole fractions calculated by CEA are shown in Table 2.

Table 2 Composition and mole fraction of gas generator products
In numerical simulation, the inlets of the core and bypass flows are set as the mass flow rate boundary conditions, the outlet of the mixed flow is set as the outflow boundary condition which can properly eliminate effects of back pressure on the flow field of ATR combustor. The mass flow rates of the fuel-rich gas and the air are 2.947 kg/s and 20 kg/s respectively. The gas generator effluent fuel-rich gas is expanded through the turbine, and then the temperature is decreased to 1 260.02 K while the temperature of air from the bypass duct is 397.65 K at the entrance of the model.
The commercial software GAMBIT is used to mesh the volume (Fig.5). Hybrid grid technique that combines the structure grid with unstructured grid is conducted to meet the complicated flow domain. The sum of the grids is about 2.5 × 10⁶.
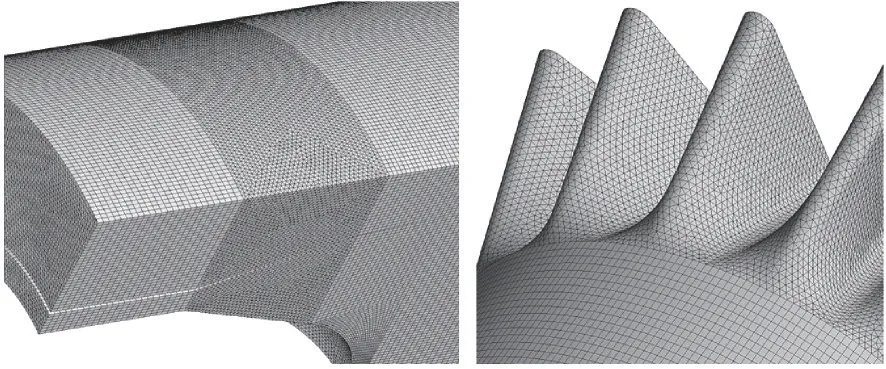
Fig.5 Mesh and its local magnification
1.3 Computation model and validation
Numerical simulation is performed by commercial software FLUENT. The mixing process without chemical reaction uses species transport model, while the combustion is simulated by flamelet combustion model.
The numerical method validation is based on the dual-plane stereoscopic particle image velocimetry (PIV) experimental data of Hu et al[27]. A computational model with the same structure as the model used in the experiment conducted by Hu et al.[27]is established. To find out the most appropriate turbulent model for circular lobed jet mixing flows, the RANS equations are closed using the standardk-εturbulence model and realizablek-εturbulence model respectively. The standard wall functions were incorporated into the mathematical model to approximate the viscous sublayer.
Fig.6 compares the results of the present numerical simulations with realizablek-εand standardk-εturbulence models with the DP-SPIV experimental measurements obtained by Hu et al.[27]with respect to maximum streamwise vorticity(STVmax) and maximum spanwise vorticity (SPVmax) distributions. The STVmaxand SPVmaxrefer to the maximum streamwise vorticity and maximum spanwise vorticity in the plane perpendicular to the flow direction respectively.
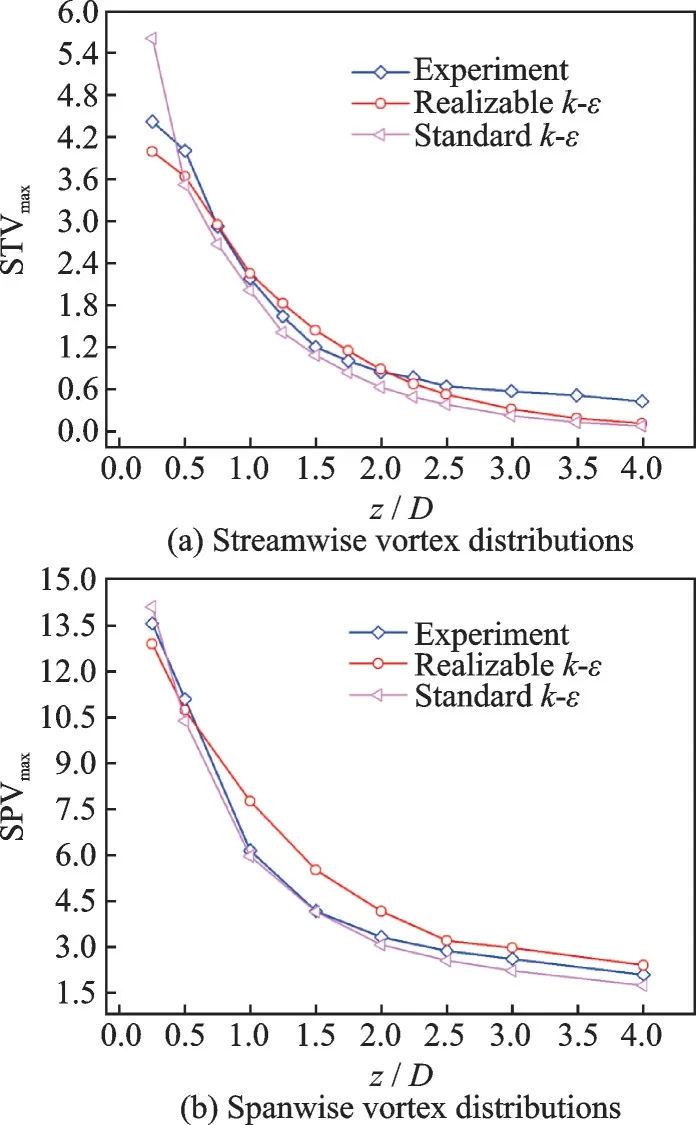
Fig.6 Comparison of maximum vortex distributions between experiment and CFD computation
According to the experimental results, the strengths of streamwise vortex and spanwise vortex are both decreasing with the increase ofz/D. The streamwise vortex strengths drop rapidly in the range ofz/D<2.5 and the rates of fall slowdown in the range ofz/D>2.5. It can be seen from Fig.6(a) that the STVmaxobtained by Realizablek-εmodel is closer to the experimental data near the lobe trailing edge while the STVmaxobtained by standardk-εmodel has a large deviation from the experimental results.
According to Fig.6(b), the SPVmaxobtained by standardk-εturbulence model in the region of 0.5<z/D<2.5 is closer to the experimental values. Considering that the spanwise vortex plays a leading role in the mixing process and the STVmaxobtained by realizablek-εmodel is closer to the experimental data, the realizablek-εturbulence model is used in the present study.
Since there is no experimental result of lobed mixed combustion for reference at present, the experimental results of swirling combustion are used as reacting numerical simulation verification in this research. Wang et al.[37]carried out a large number of numerical and experimental studies on the swirling flow field. The main feature of this flow field and the downstream mixed flow field of the lobe is that they both contain large-scale flow vortices. The comparison of temperature distribution between the test results with equivalence ratioφ=0.7 and the numerical simulation results is shown in Fig.7. The results show that the non-premixed combustion model and the realizablek-εturbulence model can accurately simulate large-scale flow field of swirling combustion, which provides a reliable basis for the simulation of thermal flow field in ATR engine combustion chamber.

Fig.7 Temperature distributions along the centerline of the CFM56 combustor under φ=0.7 condition[37]
2 Results and Discussion
2.1 Streamwise vorticity distributions
The normalized streamwise vorticity intensity is defined as

The structures of streamwise vortices induced by six different lobes are similar, and the most representative Case B is selected for analysis. Fig.8 shows the streamwise vorticity intensity contours in Case B at several typical cross planes in the downstream of the lobed ATR combustor in the non-reacting flow (left) and reacting flow (right).
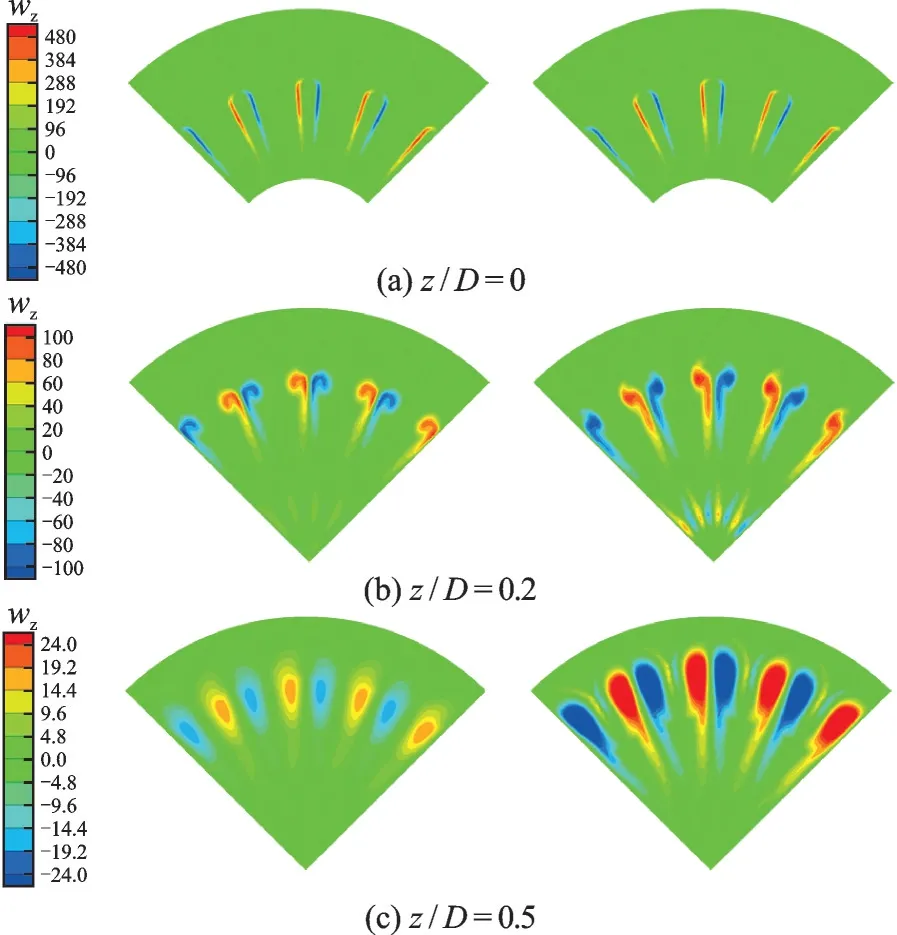
Fig.8 Streamwise vortex intensity contours of Case B at different cross planes
A counter-rotating vortex pair of equal size as the lobe height is generated at each lobe trailing edge. The inner and outer flows just started to contact in the downstream area near the lobe trailing edge, thus the size of vortex is small. Inz/D=0.2 plane, the streamwise vortex displays a top-heavy shape. The reason is that the fuel-rich gas flow along the lobe upper wall and mix with air under the entrainment of the large-scale streamwise vortex pair. As the flow developing downstream, the vortex size increases and the shape of the vortex changes from “strip” to “ellipse” due to the mixing of the inner and bypass flows. Significantly, the streamwise vortices move from inside to outside along the radial direction. The reason is that the vortex-pair generated at each lobe trailing edge is counter-rotating. As shown in Fig.9, the interaction between the anticlockwise vortex (left) and the clockwise vortex (right) provides a tendency to move outward along the radial direction for the vortex pair.
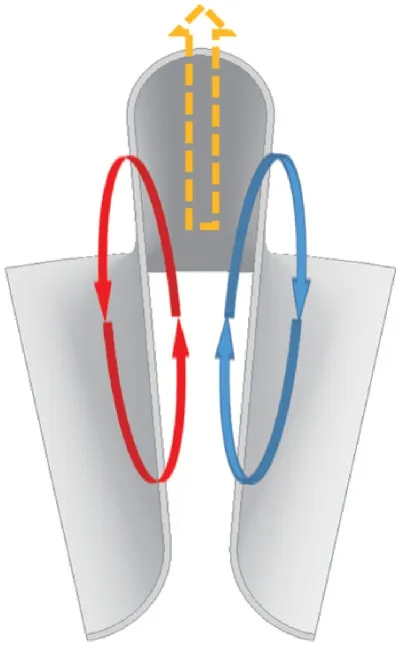
Fig.9 Schematic of the counter-rotating vortex pair
Compared with the streamwise vortex in nonreacting flow, the vortex strength is higher and the radial movement is faster in the reacting flow at the same cross plane. This is because the reaction between the fuel-rich gas and air causes a significant rise in ATR combustor temperature, which may lead to the gas expansion and increase in radial velocity and radial velocity gradient downstream the lobe. Hence, the vortex strength is higher in reacting flow.
The maximum streamwise vorticity distributions of six lobes in non-reacting flow are shown in Fig.10. In general, the vortex strength is the highest in thez/D=0 cross plane as a result of the largest radial velocity gradient at the lobe exit. Then the vortex strength decreases rapidly due to energy dissipation caused by viscosity. As shown in Fig.10, in the region ofz/D<0.1, the STVmaxvalues of six lobed mixers decrease rapidly. Two factors may account for this trend. Firstly, the high vortex strength in this region causes intensive mixing between the core and bypass flows. However, the turbulent energy dissipates faster accordingly, making the vortex strength decreases rapidly. Secondly, the reducing diameter of the center cone in this region leads to the increasing area for the flow downstream of the lobe trailing edge. Therefore, the velocity of both core and bypass streams reduces, and the vortex strength decreases as a result of the smaller velocity gradient. In the region of 0.1<z/D<0.7, the STVmaxvalue continues to decrease but the rate of decline slows down gradually. On the one hand, the descending trend of vortex strength is caused by energy dissipation. On the other hand, the mixing between two streams tends to be uniform and the velocity gradient keeps decreasing, which slows down the descending rate of STVmax. In the region ofz/D>0.7, the STVmaxvalue is close to zero. The streamwise vortices have basically disappeared due to energy dissipation.
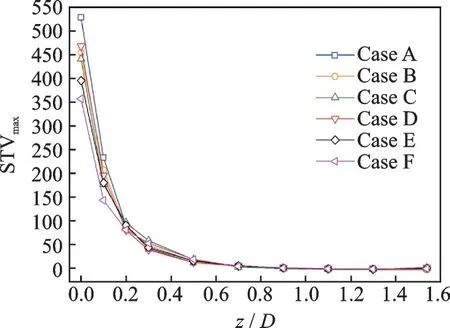
Fig.10 Normalized maximum streamwise vortex distributions in non-reacting flow
The Case A has the maximum STVmaxvalue while the Case F has the minimum STVmaxvalue in the region close to the lobe trailing edge. The reason lies in the velocity gradients caused by the different exit area ratio of the bypass and core flow. The Case A has the smallest core flow exit area and the largest bypass flow exit area at the lobe trailing edge, making the radial velocity gradient largest among the six lobes. With the increase ofz/D, the difference of STVmaxbetween six lobes becomes smaller and smaller. In the region ofz/D>0.7, the normalized maximum streamwise vorticity of different lobes remains broadly stable and basically the same. In this region, the gas and fuel are mixed evenly and the influence of velocity gradient can be neglected.
The averaged turbulent kinetic energyKis defined as

wherekis the turbulent kinetic energy, shown as

The averaged turbulent intensityIis defined as

whereiis the turbulent intensity, shown as

The averaged turbulent kinetic energy and averaged turbulent intensity distributions of the lobed mixer B are shown in Fig.11 and Fig.12, respectively. It can be seen thatKandIincrease first and then decrease both in non-reacting and reacting flows. The variation is explained in terms of streamwise vortices and energy dissipation in lobed mixing flows. The large-scale streamwise vortex generated at the trailing edge of lobe causes intensive mixing between the core and bypass flows. Thus, the averaged turbulent kinetic energy and averaged turbulent intensity downstream the mixer outlet increase rapidly. As the downstream distance increases, the vortex strength is weakened due to the energy dissipation, and the effect of energy dissipation in decreasing theKandIvalues exceeds that of streamwise vortex in increasing theKandIvalues. Therefore, the growth rate slows down, and reaches its peak value, then, the averaged turbulent kinetic energy and averaged turbulent intensity are found to decrease at further downstream locations.
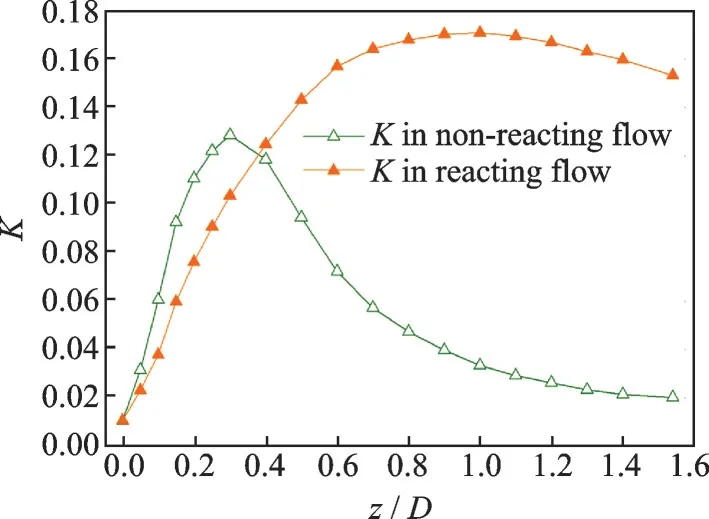
Fig.11 K distribution of Case B in non-reacting and reacting flows
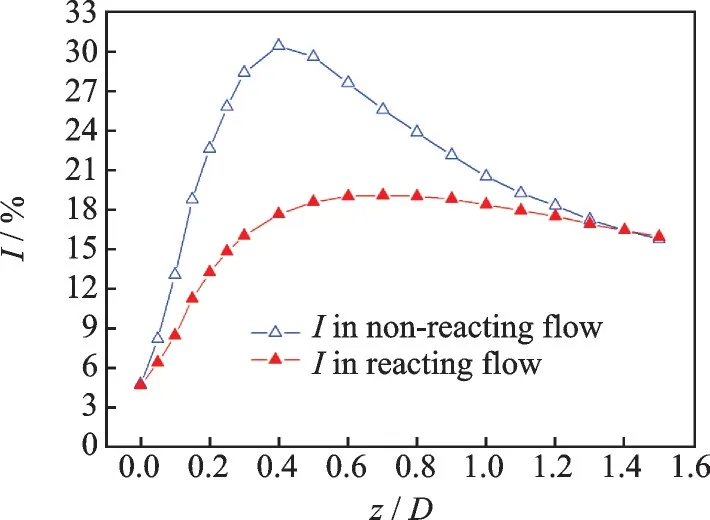
Fig.12 I distribution of Case B in non-reacting and reacting flows
Compared with non-reacting flow, both the rising and declining rates ofKare slower in reacting flow. In addition, the planes with maximumKvalue are closer to the combustor exit:Kreaches the maximum value at planez/D=0.3 in the non-reacting flow while in the reacting flow the position of the maximumKplane isz/D=1.0. In the non-reacting flow, the velocity of mixed flow drops rapidly after contact due to energy dissipation. However, in the reacting flow, the gas expands at high temperature. The density of mixed flow decreases and the velocity increases at a relative slow speed with the increase ofz/D. Thus, the corresponding value ofz/DwhereKreaches the maximum value is larger in the reacting flow. The peak ofKis higher in reacting flow. The reason is that the vortex strength is higher in the reacting flow, and the mixing of fuel and air gets more intensive accordingly. Thus, the maximum value ofKis greater.
The variation trend of turbulent intensityIis basically consistent withK. However, it is notable that the value ofIin reacting flow is smaller than that in non-reacting flow, this is because the mean velocity is higher in reacting flow due to the gas expansion and acceleration. The baroclinic fluid vortex generated by combustion heat release will restrain the upstream vortex system, thus weakening the vortex intensityI.
2.2 Mixing efficiency distributions
Because the intensity of combustion reaction in the ATR combustion chamber is determined by the mixing effect, the mix-efficiency-distribution and the temperature-distribution are used to characterize the combustion performance in this paper.
The mixing efficiency in the two-flow lobed mixer-ejector is defined as[38]

The mixing efficiency distributions of six lobes are shown in Fig.13. There is an upward trend in the mixing efficiency in the non-reacting flow, yet the growth rate slows down with the increase ofz/D. The rising rate in the near field region ofz/D<1.0 is significantly higher than that in the further downstream region ofz/D>1.0. The increasing trend of mixing efficiency is consistent with the decreasing trend of streamwise vorticity, which indicates that the large scale streamwise vortex plays a major factor in the mixing enhancement of the core and bypass flows.
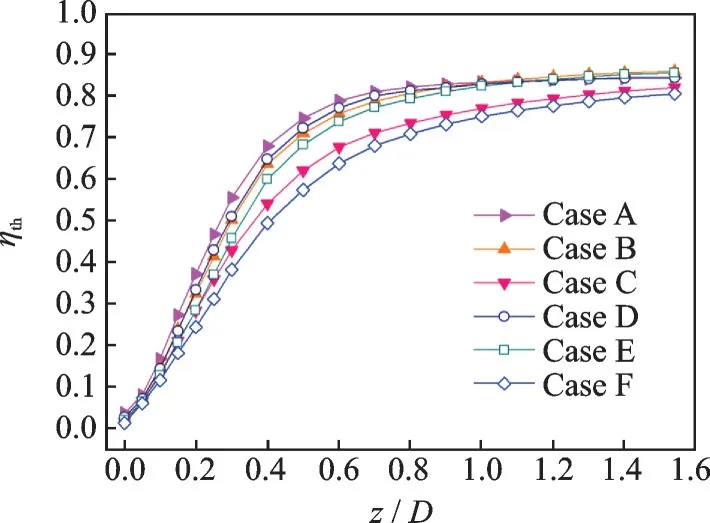
Fig.13 Thermal mixing efficiency distribution
The mixing efficiency rank(from high to low) is Case A, Case D, Case B, Case E, Case C and Case F in the region ofz/D<0.7, namely the smaller the lobe exit area, the higher the mixing efficiency. In the region ofz/D>0.7, the mixing efficiencies of Cases A, B, D and E are almost equal, which indicates that the effects of lobe exit area on mixing efficiency become indistinct. By the comparison of Fig.10 and Fig.13, it can be seen that the mixing efficiencies of six lobes basically correspond to the strength of streamwise vortex, namely the higher the intensity of streamwise vortex, the higher the mixing efficiency.
2.3 Temperature distributions
Fig.14 presents computed results for the temperature at four axial locations (z/D=0.2,z/D=0.5,z/D=1.1 andz/D=1.54) downstream of six lobed mixers. The temperature atz/D=0.2 is generally low since the fuel-rich gas and air just begin to contact, the mixing is not sufficient and the chemical reaction is incomplete. With the development of the flow, the fuel-rich gas and air begin to mix under the action of streamwise vortices and the combustion becomes very intense. In thez/D=0.5 cross plane, there is an umbrella-type high temperature region behind each lobe under the induction of streamwise vortex. In thez/D=1.1 cross plane, the heads of the high temperature zones are connected together. The air from the bypass duct is inhaled to the “umbrella stem” area by the action of counterrotating vortex, thus the temperature in this region is relatively lower. At the exit of the combustor, the area of high temperature is further increased with the streamwise vortex move radially.
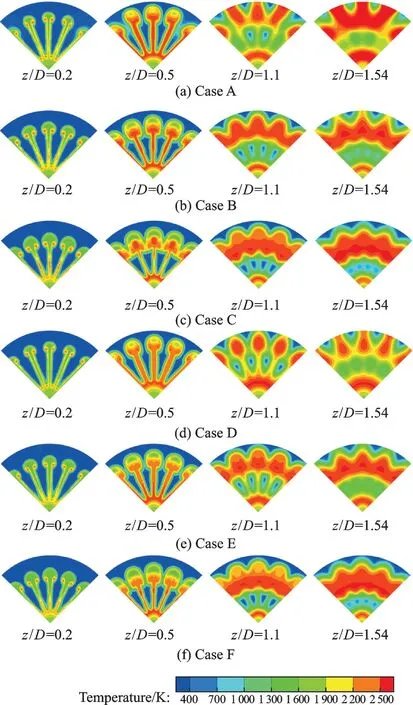
Fig.14 Temperature contours of Cases A—F at different cross planes
As shown in Figs.14 (a—c), keeping the lobe trough widthb2constant and increasingb1, the locations and sizes of high temperature zones of three lobes at the same cross plane downstream are different. The radial velocity of high temperature area decreases asb1increases. The high temperature zone reaches the wall faster in combustor with Case A (b1/b2=12/8) than Case B (b1/b2=18/8) and Case C (b1/b2=24/8). The high temperature zone moves by the action of streamwise vortex, the stronger the streamwise vortex, the faster the movement speed. Likewise, the order of movement speed of high temperature zone from high to low is Case D (b1/b2=12/12), Case E (b1/b2=18/12), Case F (b1/b2=24/12).
Keeping the lobe peak widthb1constant and increasingb2, the radial velocity of high temperature area decreases, too. Compared with Case A (b1/b2=12/8), the high temperature area at the exit plane of the combustor with Case D (b1/b2=12/12) is significantly smaller. It should be noted that the temperature in the center of the combustor is relatively low. The reason lies in the large bypass ratio of the system. The concentration of air in the central area is relatively low, and there is no enough air for the high-temperature fuel-rich gas to react with. Considering that the lobe peak-to-trough width ratio of Case D is 1 while the lobe peak-totrough width ratio of Case A is 1.5 by reducingb2, and the incomplete combustion get alleviated, it can be concluded that the fan-type lobed mixer with smallerb2performs better than lobe with two parallel side walls in high bypass ratio lobed ATR combustors.
2.4 Combustor performance
The combustor performance is mainly evaluated by combustion efficiencyηand total pressure recovery coefficientσ. The definitions ofηandσare as follows
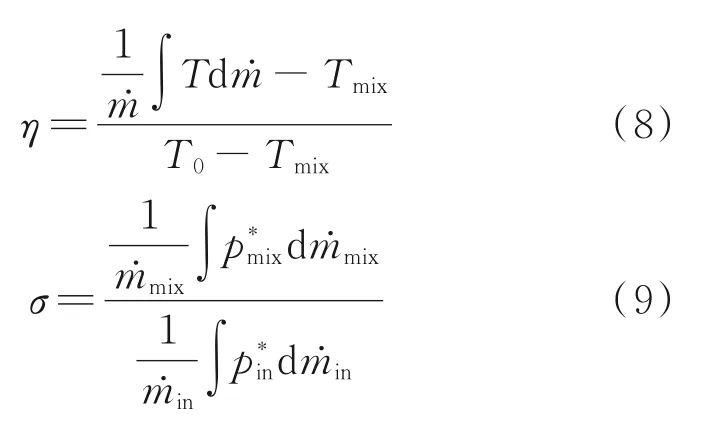
The combustion efficiency and total pressure recovery coefficient distributions of six lobes in reacting flow are shown in Fig.15 and Fig.16, respectively.As can be seen from Figs.15,16, the combustion efficiency increases and total pressure recovery coefficient decreases with the increase ofz/D, and the absolute value of slope of two curves at the same point for each lobe are consistent. The higher the combustion efficiency, the lower the total pressure recovery coefficient. It is evident that Case A has the highest combustion efficiency and the lowest total pressure recovery coefficient whereas Case F has the lowest combustion efficiency and the highest total pressure recovery coefficient.
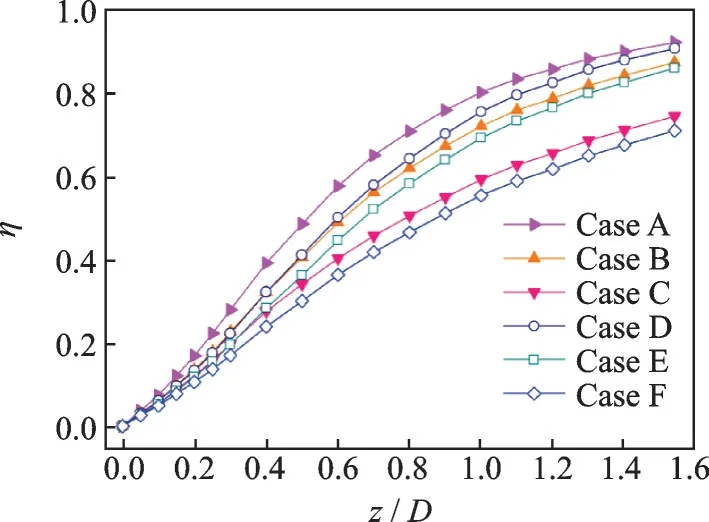
Fig.15 Combustion efficiency distribution
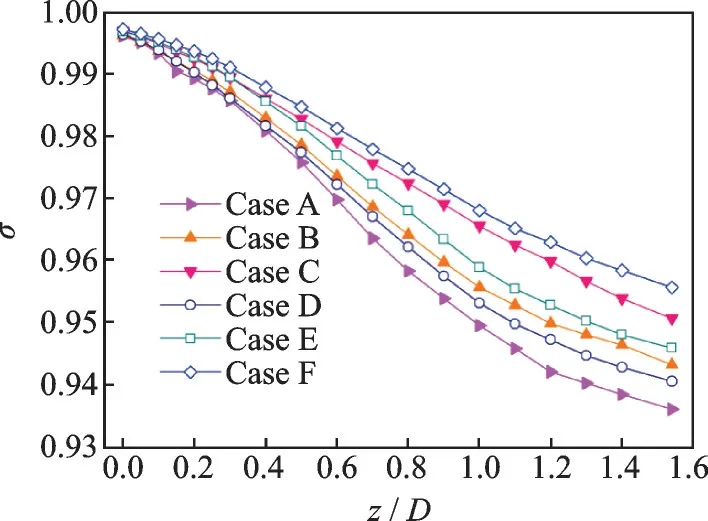
Fig.16 Total pressure recovery coefficient distribution
The streamwise vortices play an important role in the combustion between the air and fuel-rich gas. Keeping the lobe peak widthb1constant and increasingb2, the combustion efficiency becomes lower and the total pressure recovery coefficient becomes higher at the exit of the ATR combustor. The same trend happens when keeping the lobe trough widthb2constant and increasingb1.
In the non-reacting flows, the total pressure recovery coefficients of six lobed mixers are above 0.99, that is, the total pressure loss is mainly due to the heating process in reacting flow and the total pressure loss caused by mixing of the core and bypass flows is very limited.
3 Conclusions
Numerical simulation is conducted to study the effects of lobe peak-to-trough width ratio on mixing and combustion performance in ATR combustors. Some important conclusions are obtained as follows:
(1) With the development of the flow, the streamwise vortex decreases and the averaged turbulent kinetic energy increases first and then decreases with the increase ofz/Dboth in non-reacting and reacting flow. The STVmaxandKvalues in the same cross plane downstream the lobe in the reacting flow is higher than those in non-reacting flow.
(2) For a givenb1, the combustion efficiency and total pressure loss decrease with the increase ofb2. For a givenb2, the combustion efficiency and total pressure loss decrease with the increase ofb1.
(3) The fan-type lobed mixer with smallerb2has better effect on improving the combustion in the area near the combustor central line than the lobed mixer with two parallel side walls.
(4) Total pressure loss increases with combustion efficiency increasing. The total pressure recovery coefficient reaches more than 0.99 at the exit of combustor in nonreactive flow field. More than 80% of the total pressure loss is caused in the process of combustion in reacting flow.
杂志排行
Transactions of Nanjing University of Aeronautics and Astronautics的其它文章
- Numerical Investigation of an Active Jet Control Method for Hypersonic Inlet Restart
- Flow and Leakage Characteristics in Sealing Chamber of a Variable Geometry Hypersonic Inlet
- Path Planning for Lunar Surface Robots Based on Improved Ant Colony Algorithm
- Iterative Identification of Robot Dynamic Parameters Based on Logistic Function
- Adaptive Tracking Control for Diffractive Film Based on Nonlinear Sliding Mode
- Aircraft Optimal Separation Allocation Based on Global Optimization Algorithm
