Bragg reflection and photoluminescence spectroscopy of carbon⁃dots/opal photonic crystal composites
2021-12-02CHENGYanyanWANGChiyuYANGJiahaoBAIJingQIANGShunfeiLIXiyingZHANGWenkaiFANGXiaominDINGTao
CHENG Yanyan, WANG Chiyu, YANG Jiahao, BAI Jing, QIANG Shunfei,LI Xiying, ZHANG Wenkai, FANG Xiaomin, DING Tao
(College of Chemistry and Chemical Engineering, Henan University, Kaifeng 475004, Henan, China)
Abstract: 3D opal⁃based photonic crystals (PCs) filled with green carbon dots (G⁃CDs/SiO2⁃PCs)have been fabricated by a vertical deposition method.Bragg reflection spectra of the composite along the vertical assembly direction have been measured by a fiber spectrometer.The detailed analysis of the spectra and their dependencies on the light incidence angles show that reflection peaks occur blue shift when incident light deviates from the (111) sample plane, with the appearance of multiple diffraction peaks.Such measurements that rely on incidence angles can be reliably made in s⁃polarized light,since here the multiple Bragg diffraction effects are much better pronounced than in the p⁃polarization.Steady and transient photoluminescence spectra of G⁃CDs/SiO2⁃PCs reveal that the efficient PC⁃CD coupling generates an increase in the emission intensity of a factor of 5.8 and simultaneously a 1.4⁃fold enhancement in the fluorescence lifetime.Our study is believed to offer a useful understanding for manipulating the light emission with photonic crystals.
Keywords: Carbon dots; photonic crystal; Bragg reflection; photoluminescence spectra
The emergence of carbon dots (CDs) with wide source ofraw materials, easy modification, low toxicity, excellentstability, high electron⁃transfer efficiency and reliable biocompatibility opens up a viable pathway for the generation of new types of quantum dots ( QDs)[1-6].However, the majority of reported CDs generally presents highly efficient fluorescence in solution, while shows weak or no solid⁃state emission due to the aggregation⁃induced quenching[7-9].A possible pathway to enhance light emission of a solid⁃state emitter is to place them in a photonic crystal ( PC) cavity[10-11].Photonic crystals are highly ordered materials with a periodically modulated dielectric constant,and the period is within the range of visible light wavelengths.When a solid⁃state emitter is placed in the photonic crystal,the cavities with small mode volumes and high quality factors lead to a strong Purcell effect,and they also allow redirection of the emission for more efficient light control[12].Various emitters including dye molecules,quantum dots, quantum wells, phosphors, rare earth ions, semiconductorsand nanoparticle have been successfully applied to 1D,2D or 3D PCs and realized light emission manipulation[13-17].Recently, it has been reported that the combination of nanoparticles and CDs photonic crystals can control the emission intensity and lifetime.WU et al.[17]utilized the 1D PC to sandwich a thicker layer of CDs in the middle of two hybrid periodic laminar structures, yielding a transmittance dip and then enhancing the fluorescence intensity.This is the first time to narrow the FWHM and adjust the color of CDs fluorescence via 1D PC simultaneously.DASARI et al.[15]reported a film of CD⁃doped polystyrene microspheres ( PS⁃CDs )displays a remarkable enhancement of the photoluminescence emission intensity driven by optical cavity effect of the composite microspheres in comparison to a neat thin film of CDs.WANG et al.[18]presented a novel strategy to enhance the fluorescence intensity of orange carbon dots,by synergistically manipulating an electromagnetic field through opal photonic crystals and the localized surface plasmon resonance of a metal structure.An optimum intensity enhancement of 53⁃fold was obtained for PMMA opal photonic crystals/Au⁃Ag alloy plasmon hybrids.However,the research on combining the photonic crystal cavities to enhance the fluorescence emission of solid⁃state carbon dots is far from enough.
In this work, we fabricated 3D opal⁃based PCs filled with green carbon dots (G⁃CDs/SiO2⁃PCs) by a verticaldeposition self⁃assembly method on glass slides.Bragg reflection spectra of composite along the vertical assembly direction have been measured by a fiber spectrometer.The detailed analysis of the spectra and their dependencies on the light incidence angles shows that reflection peaks occur blue shift when incident light deviates from the (111) sample plane,with the appearance of multiple diffraction peaks.Such measurements which rely on incidence angles can be reliably made in s⁃polarized light, since here the multiple Bragg diffraction effects are much better pronounced than in the p⁃polarization.Finally, we studied transient PL spectra of G⁃CDs/SiO2⁃PCs.The efficient G⁃CDs/SiO2⁃PCs coupling generates an increase in the emission intensity of a factor of 5.8 and simultaneously a 1.4⁃fold enhancement in the fluorescence lifetime in the vertical assembly direction.
1 Experimental section
1.1 Chemicals
SiO2microspheres and G⁃CDs had been synthesized according to previous reports[19-21].Ethanol were purchased from the Sinopharm Chemical Reagent Co., Ltd.Deionized water (DW, >18 MΩ·cm-1,Millipore Milli⁃Q) was used throughout the experiment.
1.2 Fabrication of photonic crystals by vertical deposition
Photonic crystals with G⁃CDs were fabricated by a verticaldeposition self⁃assembly method on glass slides.The specific method isusing a substrate immersed vertically into a suspension containing monodisperse colloidal microspheres and the surface of the solvent moves down and the film deposits onto the substrate during the decline of the solvent surface with the evaporation of the solvent[22-24].Prior to use, all slides and vials were soaked 30 s in a piranha(H2SO4,30%; H2O2,7 ∶3) cleaning solution, rinsed with ultra⁃pure water, and dried in a stream of nitrogen.First, 75 mg of SiO2microspheres were dissolved in 10 mL of ethanol, and then 200 μL 1 g /L of G⁃CDs was dropped into mixed solution.After an ultrasonic treatment for 10 min,clean slides were then placed vertically into vials containing ethanol of SiO2with G⁃CDs.Finally, the vials were placed in an oven at a constant temperature of 80℃for more than 5 h depending on various deposition rates of colloidal microspheres.After ethanol in the colloidal dispersion was evaporated, a solid structure of well⁃ordered G⁃CDs/SiO2photonic crystals ( G⁃CDs/SiO2⁃PCs) on slides was obtained.
1.3 Characterization
High resolution microscopy measurement was performed using a JEM1200EX transmission electron microscope(TEM) with an operating voltage of 120 kV.Scanning electron microscopy (SEM) imageswas acquired with a Zeiss Supra 40 electron microscope.The time integrated and resolved photoluminescence (PL)spectra were recorded using an F980 spectrometer(Edinburgh Instruments, UK), equipped with a single photon photomultiplier detector ( S900⁃R ). The reflectance spectra were measured by a Fiber Optic Spectrometer ( Aurora⁃4000 GE⁃UV⁃NIR, Changchun,China)equipped with a reflection probe as well as a A 250 W Xe lamp (HDL⁃II, Bobei, China).
2 Results and discussions
2.1 Preparation of G⁃CDs/SiO2⁃PCs
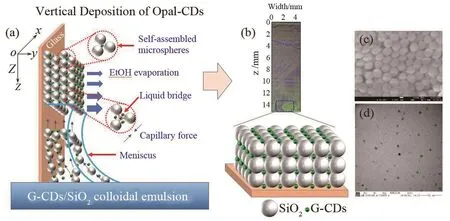
Fig.1a shows the schematic diagram of entire vertical deposition self⁃assembly process for G⁃CDs on SiO2⁃PCs.In general,it is agreed that capillary force plays an important role and greatly promotes the formation of ordered photonic crystal structure with vivid structural colors in vertical deposition self⁃assembly[25].It can be inferred that the capillary force effects mainly result from two ways: one being from the meniscus between the G⁃CDs and SiO2colloidal microspheres and the vertical slides substrate,and the other being from the liquid bridges between adjacent G⁃CDs and SiO2colloidal microspheres[23-24].In order to explain them clearly, the former can be named capillary effect Ι, and the latter named capillary effect II.

Fig.1 (a) The schematic diagram of entire vertical deposition self⁃assembly process for G⁃CDs on SiO2⁃PCs.Z represents the descending direction of the liquid level as well as the vertical assembly direction.(b) Photograph of as⁃prepared G⁃CDs/SiO2⁃PCs on slide.The zero position corresponds to the liquid level at t = 0 when start a vertical deposition.The larger version shows a demonstration of the device structure using G⁃CDs embedded in a 3D opal photonic crystal.(c) SEM image of SiO2.(d) TEM image of G⁃CDs
Underthe infiltration ofthe microspheres dispersion,the contacting place between the dispersion and slides substrate will form a meniscus,in which strong attractive capillary effect Ι will result.Due to the capillaryeffectΙand theconvection caused by evaporation of the dispersion medium (ethanol), G⁃CDs and SiO2colloidal microspheres are continuously transported into the meniscus and deposited on the surface of slides.In addition to the capillary effect Ι,capillary effect II produced from the liquid bridges between adjacent colloidal microspheres is also critical for the self⁃assembly, which can reduce the distances of the adjacent colloidal microspheres and promote these microspheres to form a regular arrangement on slides substrate.Therefore, as the solvent evaporated,colloidal crystal growed and lattice arrangement formed leading to a structure of G⁃CDs/SiO2⁃PCs on the slides(Fig.1b).Fig.1c showsthe SiO2microspheres diameters are preliminarily found with a scanning electron microscope(SEM) to be about 210 nm.A transmission electron microscope(TEM) image of G⁃CDs (Fig.1d) confirms a quantum dot shape with an average size of 6.2 nm.
2.2 Reflectance Spectra
The initial host crystals used for fabricating G⁃CDs/SiO2⁃PCs were synthetic opals composed of 3D ordered lattices of close⁃packed SiO2spheres with the mean diameter of 210 nm.The volume of the air pores among the spheres may be as large as 41% of the total volume available for filling with CDs.The samples to be studied were made as plates of 15 mm×5 mm in size and ~ 0.5 mm thick (Fig.1b).The opal pores were filled with the G⁃CDs positioned directly in the pores by co⁃assembly method.Afterwards we studied the reflectance spectrum of G⁃CDs/SiO2⁃PCs under different conditions.Fig.2a presents geometry of the reflectance spectra measurement.

Fig.2 (a) Geometry of the reflectance spectra measurement.The diffraction plane is represented in light gray.The sample surface plane is represented in dark gray.The incident angle(θ) is between the incident light and the normal and kiis wave⁃vector of the incident light.p⁃polarized light has an electric field polarized parallel to the diffraction plane,while s⁃polarized light is perpendicular to this plane.Bragg reflection contour map (b) and selected spectra(c) of G⁃CDs/SiO2⁃PCs scanned along the self⁃assembly direction
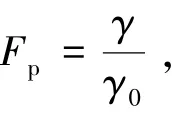
The analysis of BR spectra is a simple and direct method for studying the PC band structure.The reflection peaks arise from Bragg diffraction of light on the families of PC crystal planes and correspond to the photon energies and wave vectors,for which light propagation through an ideal PC is forbidden.An important characteristic of a PC is the stop⁃band width ΔEgapgoverned by the spatial modulation percentage of the dielectricconstant varying with the dielectric contrast q of the materials comprising the PC.When a PC is made up of two spatially alternating materials a and b, the parameter q can be defined as:

where εaand εbare the respective dielectric constants of the materials.For our opal⁃like PC, εawill be taken to mean the dielectric constant of the spheres and εbthe dielectric constant of the pores.In the initial host crystal, we have εb= 1, i.e., the pores are filled with air and εa> εb, such that 0 < q < 1.Opal⁃CDs composites normally obey the opposite inequality, εa<εb;thus,we have-1 < q< 0.
The synthetic opal samples chosen for G⁃CDs filling demonstrated well⁃defined BR peaks.Their analysis allowed us to preliminarily characterize the structure of the initial 3D host crystals.Such a characterization appears quite reasonable since the G⁃CDs incorporated in opal pores cannot be said to have been fully described as to its optical properties or filling fraction.Of special interest among the PC characteristics of initial opals are their spatial periods determined by the size and arrangement of the SiO2spheres, as well as their dielectric constants.To obtain reliable information on the geometry and dielectric parameters of the opals,we measured the BR spectra of opals filled up with G⁃CDs.Fig.2b illustrates the contour map ofBR spectraforG⁃CDs/SiO2⁃PCs scanned along the self⁃assembly direction.The spectra were registered at the incidence angle θ≈ 45°,counted from the normal to the (111) sample plane.One can see that the sample exhibits an inhomogeneous reflectance along the direction of vertical deposition.The intensities of reflectance peak for position(Z) at 0.5, 5, and 9.5 mm of opals are found to be 52%,68% and 99%, respectively (Fig.2c).
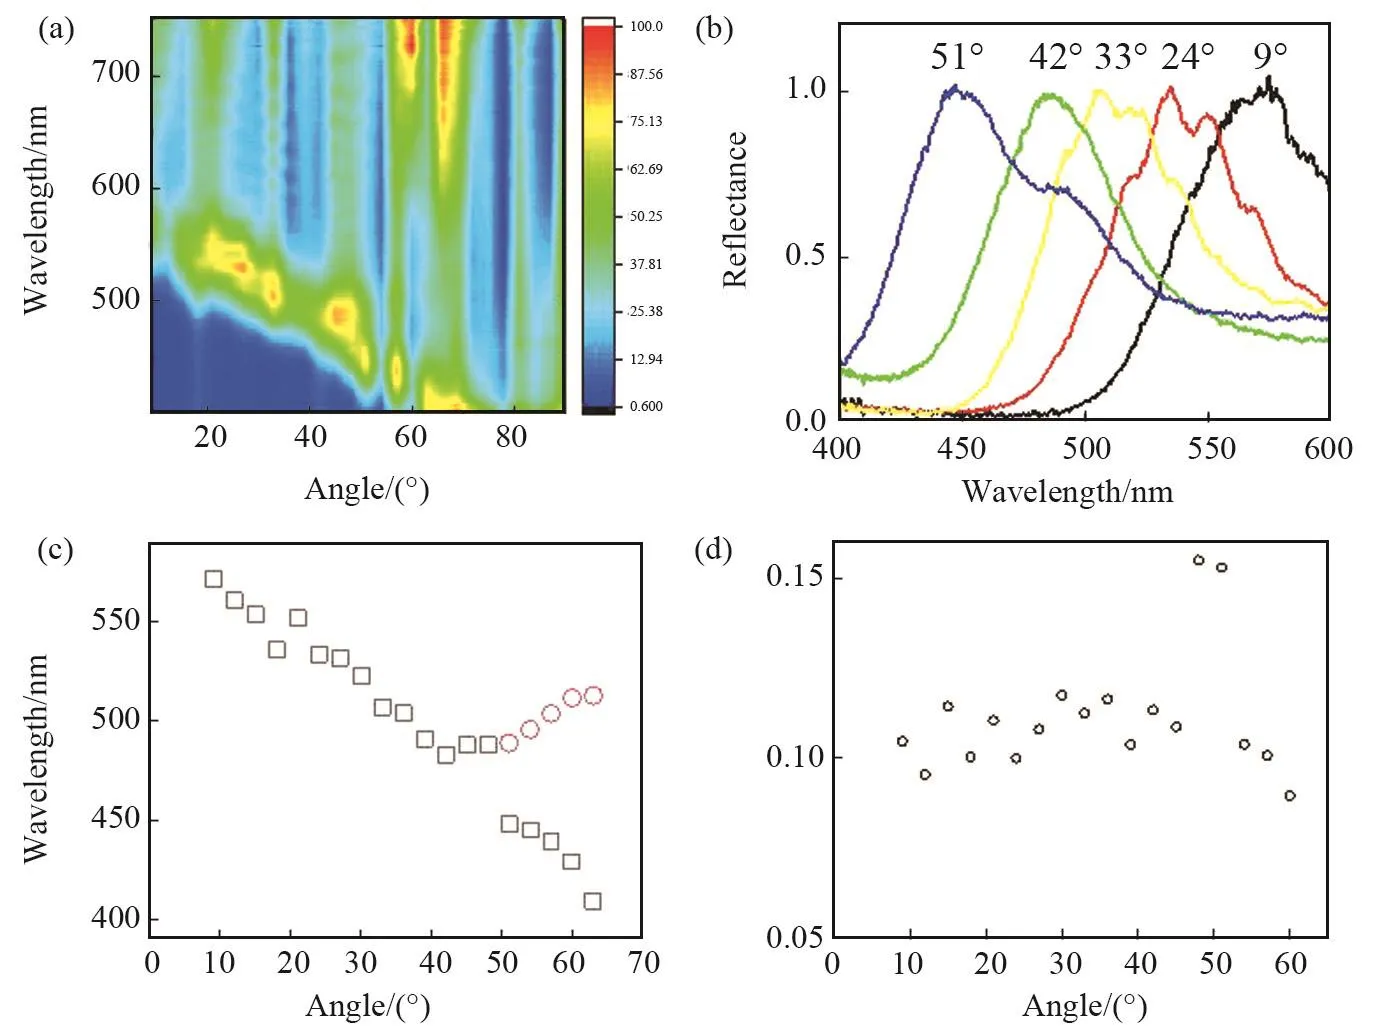
As the light incidence angle θ becomes larger, the reflection peaks are shifted toward the shorter wavelengths and the s component exhibits a broadened resonance reflectance contour (Fig.3a, 3b).The positions of the Bragg reflectance peaks are shown in Fig.3c (Black squares) as a function of the incidence angle for G⁃CDs/SiO2⁃PCs sample.Theseangular dependences are well described by Bragg’s formula

Fig.3 Bragg reflection contour map (a) and selected spectra (b) for various incidence angles of s⁃polarized light.(c) The angular dependence of the peak positions of Bragg reflectance.Black squares are the main peaks, red circles are the shoulder peaks.(d) Compare the photonic properties at various angles using the relative width ΔEFWHM /E0of the reflectance

where λ is the wavelength at the reflectance peak, d111is the spacing between adjacent(111) lattice planes,θ is the incidence angle, and ε0is the average dielectric constant of the composites:

where f0is the filling fraction for the structure(the volume fraction of sphere material).
The parameters of Eqs.(2) and (3) were calculated by Bragg’s formula nonlinear fitting, using the experimental data in Fig.3c (Black squares).The varying parameters were d111and εa.The dielectric constants for air(εb= 1) and f0= 0.59 were assumed to be fixed.The resulting values were found to be εa=2.25 and d111=215 nm.
The PC spectra of G⁃CDs/SiO2⁃PCs is presented in Fig.3.As the incidence angle increases, additional features of shorter wavelengths arise in the vicinity of θ≈50°in the spectra registered in the s⁃polarization, as is seen in Fig.3a and 3c.The peak intensity increases gradually, and the features acquire a well⁃defined doublet geometry at θ≈ 50°-60°.The dependence of the spectral positions of the BR features on the light incidence,presented in Fig.3c, allow identification of two branches separated by an avoided crossing area[26].The doublet structure in the reflection spectra at oblique incidence is due to multiple Bragg diffraction—a simultaneous light diffraction on, at least, two intercepting crystal planes.Multiple diffraction radically changes the behavior of the peak positions as a function of the light incidence.The value of ΔEgapfor highly contrast structures is sometimes found experimentally as full width at half maximum(FWHM)ΔEFWHMof the spectral band.In order to compare the photonic properties at various angles,it is convenient to use the relative width ΔEFWHM/E0of the reflectance (E0is the energy at the reflection peak)[27].It can be found that ΔEFWHM/E0( ~0.1) for opal⁃G⁃CDs remains almostconstantby changing the angle of incidence (Fig.3d).Therefore, it implies the photonic band gap has a not great change.
Light is an electromagnetic wave,and the electric field of this wave oscillates perpendicularly to the direction of propagation.Light is called unpolarized if the direction of this electric field fluctuates randomly in time.Many common light sources such as sunlight,halogen lighting, LED spot lights, and incandescent bulbs produce unpolarized light.If the direction of the electric field of light is well defined,it is called polarized light.The two orthogonal linear polarization states thatare mostimportantforreflection and transmission are referred to as p and s⁃polarization[28-30]. Fig.4a and 4b show reflection contour map for various polarizing angles and the polarizing angle dependence ofthe intensity of reflectance at angle of incidence of 45°.It is observed that the spectra are polarization⁃insensitive at a fixed incident.The position of the reflection peaks remains essentially constant, but the reflection intensity changes periodically by rotating a polarizer in front of the G⁃CDs/SiO2⁃PCs sample.Two spectra for s⁃and p⁃polarized light, for an angle of incidence 45°, are presented in Fig.4c.Here, we can already appreciate the difference in width between both peaks,indicating a strong polarization sensitivity.

Fig.4 (a) Reflection contour map for various polarizing angles at angle of incidence of 45°.(b) The polarizing angle dependence of the intensity of reflectance.(c) Reflectance spectra are shown in solid (dashed) line for s⁃(p⁃) polarized light, for an angle of incidence of 45°
2.3 PL Spectra


Fig.5 (a) Time integrated PL and (b) Fluorescence decay contour map of G⁃CDs on SiO2⁃PCs.(c) Peak intensity (a0) and PL lifetime of G⁃CDs/SiO2⁃PCs in relation to the self⁃assembly direction
3 Conclusions
In summary, we fabricated 3D opal⁃based PCs filled with green carbon dots (G⁃CDs/SiO2⁃PCs) by a verticaldeposition self⁃assembly method on glass slides.The Bragg reflectance spectra of the composite along the vertical assembly direction were measured with a fiber optic spectrometer.A detailed analysis of the spectra and their relationship with the incident angle shows that when the incident light deviates from the (111) sample plane, the reflection peaks are blue⁃shifted and multiple diffraction peaks appear.This incident angle⁃dependent measurement can be reliably performed in s⁃polarization light, because the multiple Bragg diffraction effect here is more pronounced than in the p⁃polarization.Finally, we studied the transient luminescence spectra of G⁃CDs/SiO2⁃PCs. The effective G⁃CDs/SiO2⁃PCs coupling increases the emission intensity of the fluorescence in the vertical assembly direction by 5.8⁃fold, and the fluorescence lifetime increases by 1.4⁃fold.Therefore, our research proves the ability of classical reflectance spectroscopy to characterize opal photonic crystals and also provides a strong support for using photonic crystals to control the emission of light sources.
