Low-cost fabrication of highly dispersed atomically-thin MoS2nanosheets with abundant active Mo-terminated edges
2021-11-16FiWangMingHaoWiLiuPnjiYanBaizngFangSijiaLiJinshngLiangMaomaoZhuLiCui
Fi Wang,Ming Hao,Wi Liu,Pnji Yan,Baizng Fang,Sijia Li,Jinshng Liang**,Maomao Zhu,Li Cui
a Key Laboratory of Special Functional Materials for Ecological Environment and Information(Hebei University of Technology),Ministry of Education,Tianjin,300130,China
b Institute of Power Source and Ecomaterials Science,Hebei University of Technology,Tianjin,300130,China
c Dalian National Laboratory for Clean Energy,Dalian Institute of Chemical Physics,Chinese Academy of Sciences,Dalian,116023,China
d College of Chemistry and Chemical Engineering,Key Laboratory of Hexi Corridor Resources Utilization of Gansu Universities,Hexi University,Zhangye,734000,China
e Department of Chemical & Biological Engineering,University of British Columbia,Vancouver,V6T1Z3,Canada
Keywords:Molybdenum disulfide Nanosheets Mineral nanofibers Microwave hydrothermal Molybdenum termination Density functional theory
ABSTRACT
1.Introduction
As is typical in a two-dimensional(2D)semiconducting material,atoms in molybdenum disulfide(MoS2)bond together through covalent forces with layers interacting through van der Waals forces.Such intrinsic structural features endow MoS2with novel properties for versatile applications,including their use as photocatalysts[1–3],lubricants[4],electrocatalysts[5–7],supercapacitors[8]and photodetectors[9].However,nanostructured MoS2is prone to form a messy cluster of miscellaneous elements due to its high specific surface energy,which results in the rapid recombination of electron-hole pairs and poor photocatalytic performance[10].To overcome this defect,multiple carriers have been utilized to reduce the clustering,such as graphene[11],graphene oxide[12],reduced graphene oxide[13],titanium dioxide[14],zinc oxide[15],CdS[16],and Bi2MoO6[17].However,the high fabrication cost and the problematic environmental load make these carriers unsuitable for broad application.It is important that the atomically-thin MoS2sheets full of chemically active edges are stably assembled on a support that is naturally abundant,e.g.,minerals.The mineral support has the advantages not only of low cost,but also of being environmentally benign,with good adsorption capacity and dispersion stability,making them good candidates as functional carriers[18].To date,however,there has been little study on the fabrication of MoS2/mineral materials to enhance the catalytic performance through providing more active sites and assembly flexibility,especially on1D mineral-supported MoS2.
Previously,we succeeded in fabricating natural SEP bulks into nanosized fibers using high-speed airflow techniques[19].In this work,using a one-step microwave hydrothermal method[20–22],we report the first preparation of a delicate MoS2/sepiolite(denoted as MSEP)nanocomposite consisting of atomically-thin MoS2nanosheets(MSNSs)growing along the surface of the SEP nanofibers.This structure significantly increases the dispersibility of the MSNSs.The as-developed MSNSs have created abundant atomic steps at their edges in which catalytically active molybdenum terminations dominate,thus providing more active sites for catalysis.The novel photocatalyst has shown considerably enhanced photocatalytic activity towards RhB degradation.This work demonstrates a strategy for low-cost batch preparation of high quality atomically-thin2D materials via assembly on1D mineral functional materials.
2.Experiment
2.1.Materials
The SEP was provided by LB Nanomaterials Technology Co.,Ltd.The ammonium molybdate((NH4)6Mo7O24⋅4H2O),thiourea(CH4N2S)and rhodamine B(RhB)were supplied by Kewei Chemical Group Co.,Ltd.These materials were used as received.Deionized(DI)water was used in all experiments.
2.2.Fabrication of MSEP nanocomposites
2mmol of(NH4)6Mo7O24⋅4H2O and30mmol of CH4N2S were dissolved in70mL of deionized water and stirred for30min.Then0.6g of SEP nanofiber powders fabricated via our high-speed airflow techniques[19]were added to the solution with continuous stirring for30min.Next,the mixture was sonicated for10min.After that,50mL of the above suspension was transferred into a100mL Teflon-lined stainless steel autoclave and kept at different hydrothermal temperatures(160,180,200,220and240°C)for3h.After the samples were cooled to room temperature,the final products were obtained by filtration,washed thoroughly with deionized water,and dried in a vacuum oven at80°C for 12h.The samples synthesized at160°C,180°C,200°C,220°C and 240°C were named S-160,S-180,S-200,S-220and S-240,respectively.For comparison,MoS2microspheres assembled by MSNSs were also synthesized using the same protocol but without the addition of SEP.
2.3.Characterizations
X-ray powder diffraction(XRD)was carried out by means of a D8 ADVANCE X-ray diffractometer with nickel-filtered(V=40kV,I=40mA)Cu Kα radiation as the X-ray source(λ=1.54Å).Fouriertransform infrared spectroscopy(FTIR)spectra were recorded in transmission mode from400to4000cm-1on a Tensor II Fourier transform infrared spectrometer(Bruker,Germany).Scanning electron microscope(SEM)analyses were performed on a Quanta FEG450scanning electron microscope(FEI,USA)working at30kV.Transmission electron microscopy(TEM)and HRTEM images were acquired using a JEM2100F(JEOL,Japan)transmission electron microscope at an accelerating voltage of200kV.Brunauer–Emmett–Teller(BET)surface areas were determined on an Autosorb-iQ2physical and chemical adsorption analyzer(Quantachrome,USA).
The atomic resolution STEM imaging was performed on a JEMARM200F equipped with an EDS analyzer(200kV,probe Cs-corrector,68–174mrad collection angle for high angle annular dark field(HAADF)imaging,~0.8Åspatial resolution).The samples were ground into fine powder,dispersed in ethanol,dropped onto a lacey carbon film-Cu TEM ready grid(from TedPella Co.),and then dried on a hot plate at 70°C.STEM images were taken using the HAADF detector.An EDS analyzer(JEOL,EX-230100m2detector)equipped on a JEM-ARM200F microscope was used for the energy-dispersive X-ray spectroscopy(EDS).The elemental mapping was performed at a sampling resolution of 128×128pixels and a dwell time of0.1ms/pixel under multiple frame integration.
2.4.Computational methodology
All the DFT calculations were performed using a Gaussian09program[23]with the dispersion-corrected[24]B3LYP functional with Becke-Johnson damping[25](B3LYP-D3BJ).The basis set6-31G*was employed for Si,O,Al,S,and H.The basis set LanL2Dz was used for Mo.To study the MoS2crystals loaded on the surface of the clay minerals through all the potential chemical bondings,ideal crystal structures of SEP Mg8[Si6O15]2(OH)4⋅12H2O, ATP [(Al2Mg2)Si8O20(OH)2(OH2)4⋅4H2O],HAL[Al2O3⋅2SiO2⋅4H2O],and MoS2were modeled as the input structures(Fig.S1,Supporting Information).The scaffold structures of the clay minerals and the MoS2that were considered for the calculations are shown in Fig.S1(Supporting Information),where the chopped bonds were fixed by adding H atoms,and the overall charge was adjusted to zero.To ensure the stability of the edging structure,the edging of the Si,O,Mg,Al,S,and Mo was fixed;only the edging of the H atoms was allowed to relax.Neither the Mo and S atoms related to the binding between the MoS2and the clay minerals nor the atoms located in the middle of the structure were constrained.Topology analysis[26]was used to analyze the various covalent and non-covalent bonds to study the various types of interaction between the two different materials.Specifically,four kinds of critical points((3,-3),(3,-1),(3,+1),and(3,+3))were defined by the number of eigenvalues in the Hessian matrix.Under this definition,a(3,-1)type critical point of electron density could be identified as BCP between two atoms involved in the chemical bonding.The Laplacian of the electron density(▽2ρ),electron density(E),andŋindex(ŋ)at the bond critical point(BCP)were used to characterize the nature of the bond;the potential energy(V),the density of all electrons(ρ),and Mayer bond order(MBO)were used to characterize the strength of the bond.In the QTAIM measurements,ρ and V reflect the strength of the chemical bond(i.e.,more positive ρ and more negative V indicate a stronger chemical bond).The close-shell interaction suggested by theŋindex represents the measure of covalence,and a larger value of ŋindicates a higher covalent component of the bond.The ratio E/ρ is defined as a new function(bond degree),which represents the energy density per electron on the BCP.In general,a more positive bond degree value implies a stronger interaction.Herein,the multi-function wavefunction analysis program Multiwfn3.7[27]was employed for the real space functional analysis and the topological analysis.
2.5.Photocatalytic tests
The photocatalytic performance of the as-prepared samples was evaluated through the photocatalytic degradation of RhB under visible light irradiation;the optical absorption of RhB at553nm was used as a monitor wavelength.20mg of samples were dispersed into100mL of RhB solution(20mg/L),yielding the suspension.While stirring at ambient conditions,the suspension was subjected to irradiation by a 500W Xe lamp(λ>420nm).Adsorption/desorption equilibrium was reached after stirring in the dark for30min.At intervals of30min,6mL of the suspension was extracted and centrifuged to remove the photocatalysts.The filtrates were analyzed by recording the UV–Vis spectra using a Shimadzu UV-1800spectrophotometer.The exploratory experiment of the main active species was carried out by adding a free radical trapping agent(isopropanol(IPA),benzoquinone(BQ)or triethanolamine(TEOA))before the photocatalytic tests.All of the other experimental parameters were the same as those of the above-described photocatalytic test for the degradation of RhB.
3.Results and discussion
The general morphologies of MoS2and MSEP were first investigated by SEM.The pure MoS2,without the assistance of SEP,exhibited a3D microsphere-like architecture,assembled by MSNSs(Fig.1a).
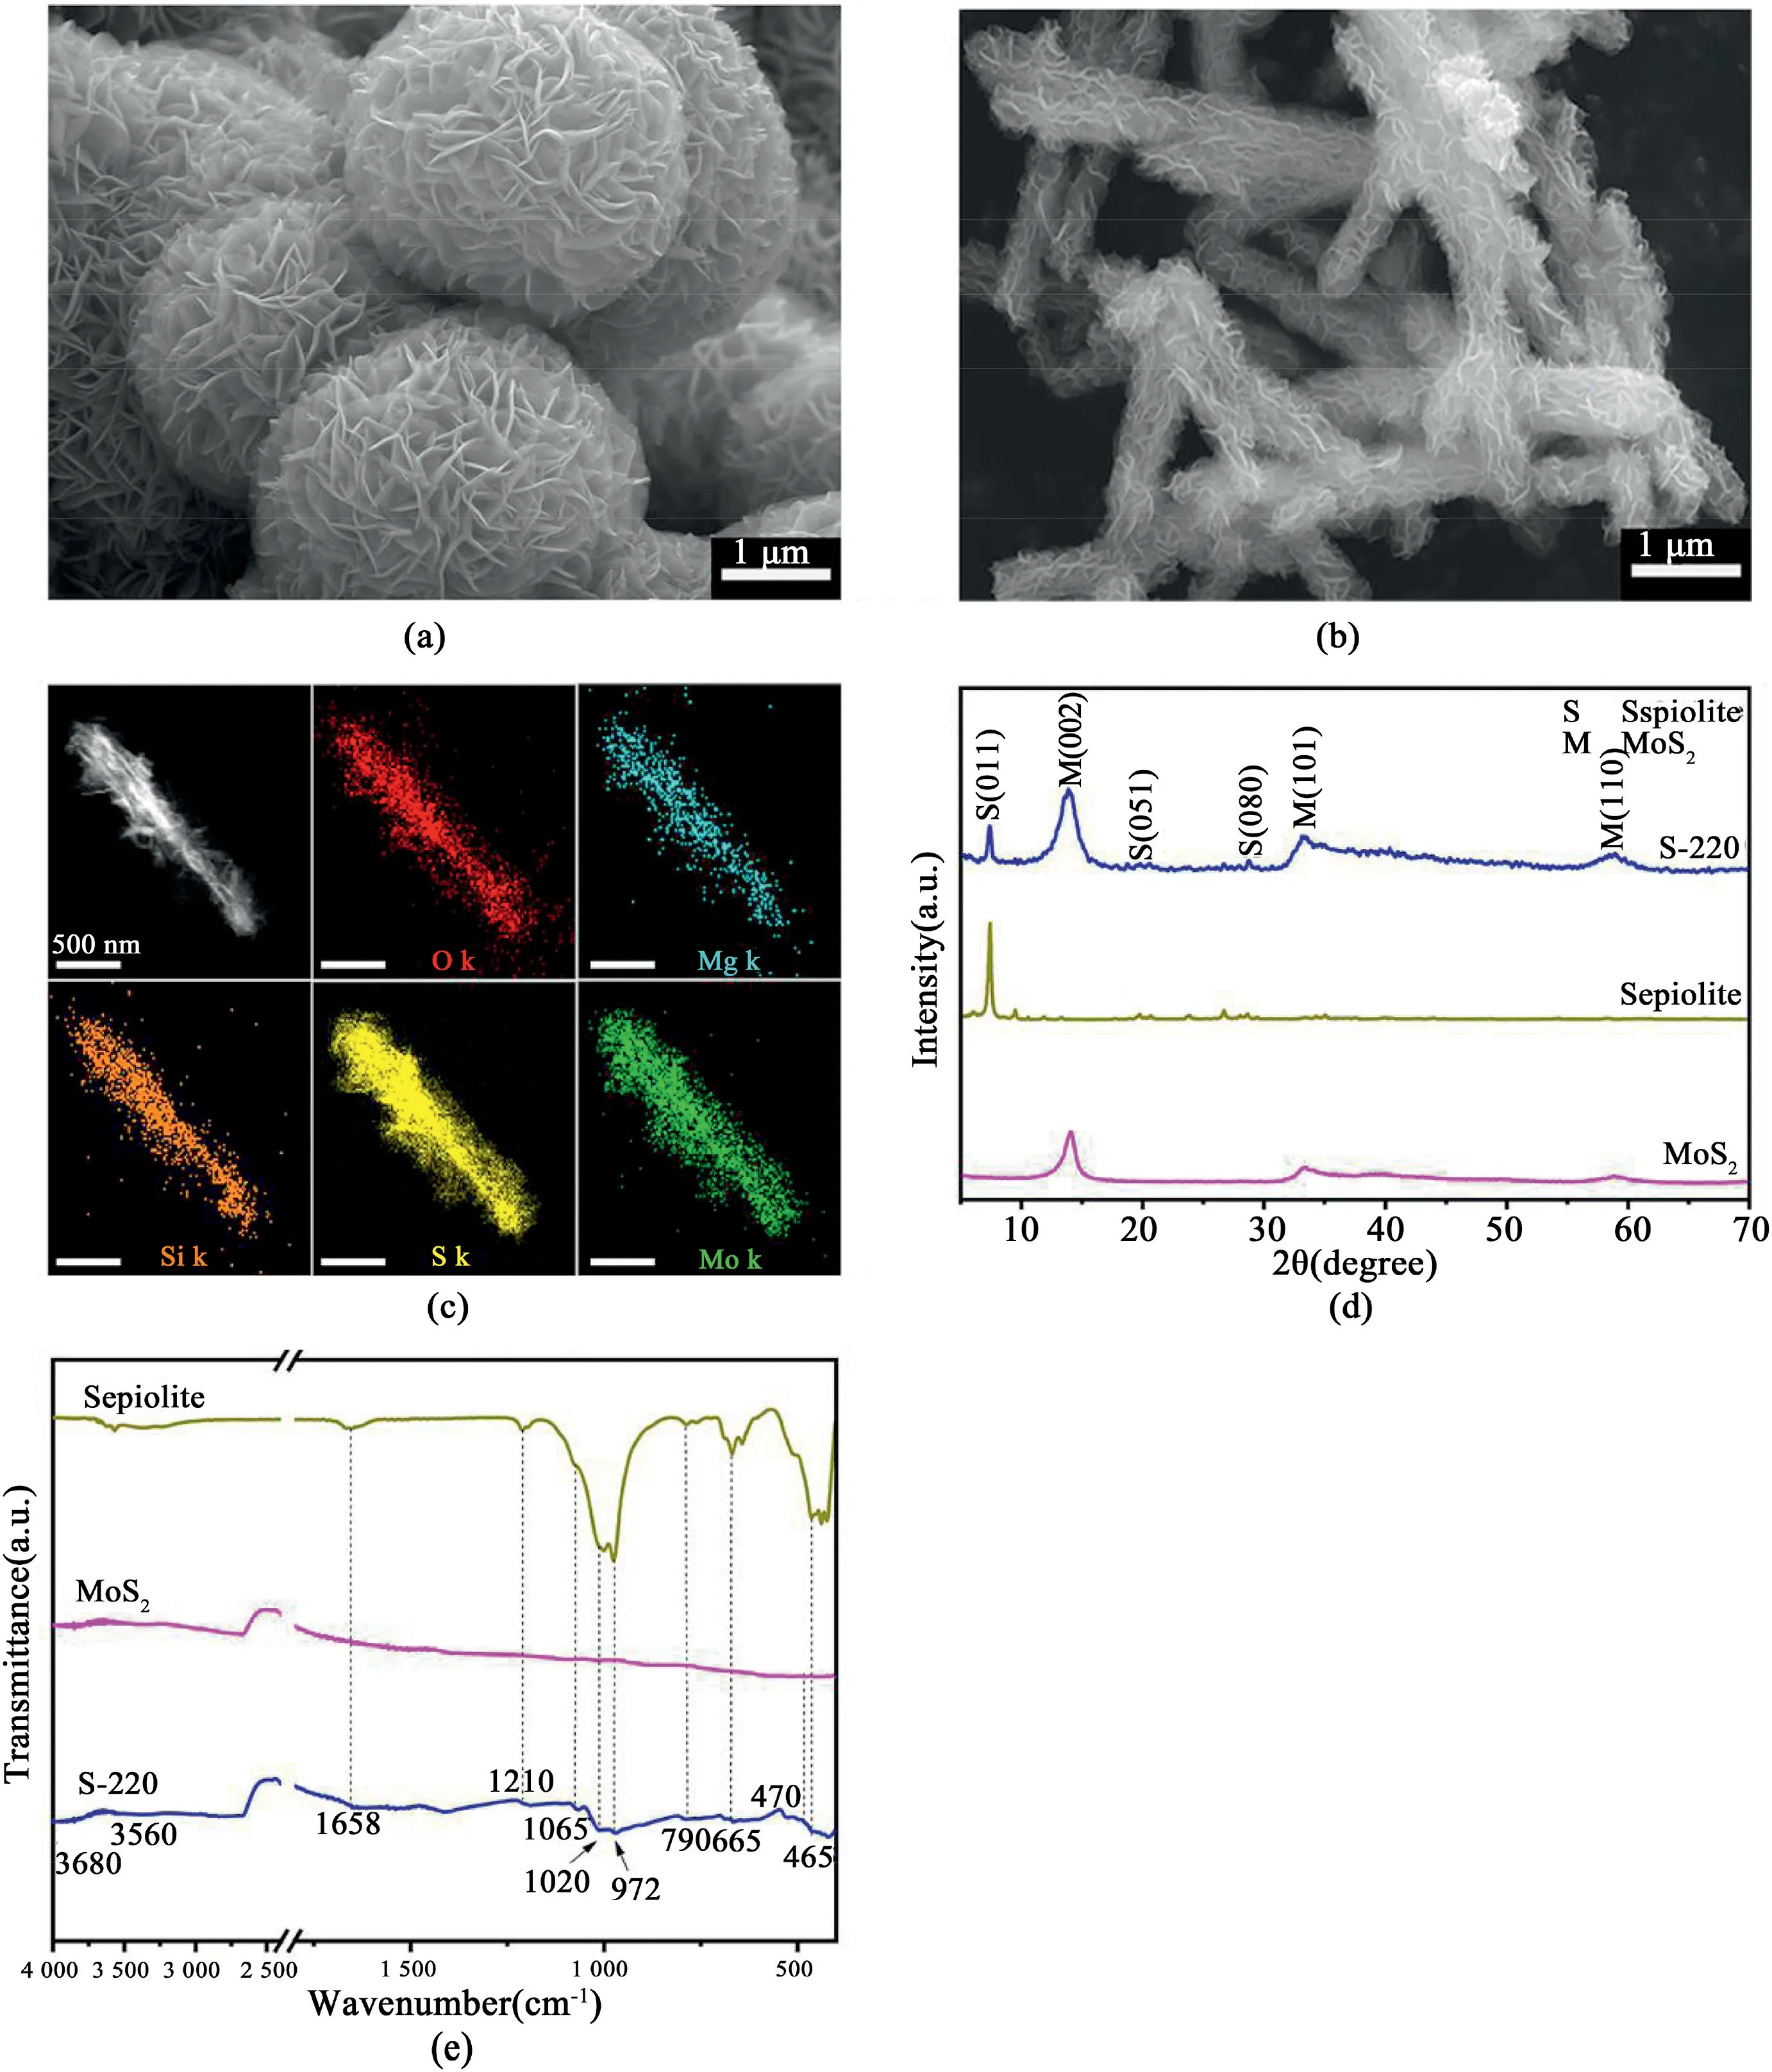
Fig.1.Morphology and phase composition of the pure MoS2and as-fabricated MSEP nanocomposites.(a–b)SEM image of the pure MoS2and MSEP nanocomposite obtained via microwave hydrothermal at220°C;(c)EDS mapping analysis for elemental distributions of individual MSEP nanorod;(d–e)XRD patterns and FTIR spectra of the pure MoS2,sepiolite and MSEP nanocomposite obtained via microwave hydrothermal at220°C.
With the help of the SEP nanofibers,the MSNSs disperse uniformly on the surface of the SEP nanofibers and yield a leafy branch-like nanostructure(Fig.1and Fig.S2,Supporting Information),which significantly increase the active sites on the exposed surface of the MSNSs.The coverage of the MSNSs over the SEP fibers is promoted by the increasing synthesis temperature.As can be seen in Fig.1b and c,the MSNSs grow consistently on the fiber surface of the sample prepared at 220°C.High resolution transmission electron microscopy(HRTEM)imaging(Fig.S3,Supporting Information)provides further direct evidence that the MoS2phase has been uniformly loaded on the SEP,which is beneficial for charge separation during electron transfer and improves the photocatalytic efficiency[18,28].As a result of this distinct dispersion,the specific surface area and pore volume of the MSEP(S-220)were 28.60m2/g and0.168cm3/g,respectively(Table S1,Supporting Information),ca.4.0and3.7times higher,respectively,than those of the pure MoS2.The uniform growth and large specific surface area provide more active sites for the supported MSNSs serving as a catalyst.The XRD patterns confirmed the phase composition of the SEP(JCPDS Card No.29–0863)and2H–MoS2(JCPDS Card No.37–1492).The peak of the MoS2diffraction(002)shifts slightly to form a smaller angle(Fig.1d and Fig.S4,Supporting Information),which may be a result of the inhalation of ammonium ions into the MoS2layers.As the temperature increases,MoS2crystallinity is promoted(as the diffraction peak becomes sharper)[29],and the various fabrication times exhibit a consistent tendency with the temperature change(Fig.S5and S6,Supporting Information).,Fourier transform infrared spectroscopy(FTIR)identified the existence of groups from the SEP skeleton(stretching vibration at3680cm-1for Mg3OH,1210–790and465cm-1for Si–O,3560and1658cm-1for-OH),as well as the Mo–S stretching vibration at470cm-1[30].Higher fabrication temperatures strengthen the Mo–S vibration(Fig.S7,Supporting Information),which suggests that the crystallinity of the MoS2improves proportionally,further validating the XRD results.
To study the atomic structures of the synthesized MSEP composites,probe aberration-corrected scanning transmission electron microscopy(AC-STEM)imaging was performed(Fig.2).High angle annular darkfield(HAADF)imaging combined with X-ray energy dispersive spectroscopy(EDS)was also performed to further characterize the MSEP’s morphology(Fig.2a),composition(Fig.S8,Supporting Information),structural defects(Fig.2c-f)and MoS2-SEP interface configuration(Fig.2b).The mass-projection related contrast in the low-magnified HAADF image reveals uniform coverage of ultrathin curly MSNSs around the surface of entire SEP fibers(Fig.2a).The1D SEP support structures help the2D MoS2materials maintain good dispersion through the following reactions.Close examination of the combining interface(Fig.2b)reveals a high density of Mo clusters on the SEP surface near the edges of the growing MSNSs.Elemental distribution analysis identifies these clusters as the Mo component(Fig.S8,Supporting Information),suggesting that the absorbed Mo clusters initiate the growth of the MoS2phase during fabrication.A lateral examination of the lattice contrast shows that the ultrathin nanosheets(3–4molecular layers)had abundant structural defects,including the steps,corners,and stacking vortexes.Moreover,while single Mo atoms primarily adhered to the edges,Mo clusters were more likely to adhere to the(001)surface of the MoS2.Higher-resolution imaging of the microstructure shows versatile stacking patterns made from1to3MoS2layers in each nanosheet(Fig.2d).The Znumber contrast in Fig.2e indicates atom arrangement details at the edge of a single MoS2layer that correspond to the schematic illustration.Additionally,light elements(i.e.,sulfur atoms)were identified using the annular bright-field(ABF)imaging method(Fig.2f),which showed that there was a high percentage of sulfur vacancies at the edge of a single layer of MoS2and a commensurately large number of unsaturated Mo atoms.These suspended atoms resulted in lattice distortions,indicating a chemical status and an electronic structure quite different from that of the well-crystallized MoS2.It is worth noting that the stacking layers in the MoS2sheets do not grow synchronously into smooth edges,but yield staggered single-layered borders,which generate a dramatic number of low-coordinated Mo sites/defects.Based on the above structural analysis,the growth mechanism of the MSEP nanocomposites is schematically illustrated in Fig.2g,where the Mo atoms gradually adhere to the SEP followed by the continuous growth of MSNSs on the surface of the SEP nanofibers.By using the naturally abundant mineral to support the highly dispersed MoS2,the fabrication cost has been reduced to one thousandth of the commercial counterparts(Table S2,Supporting Information).
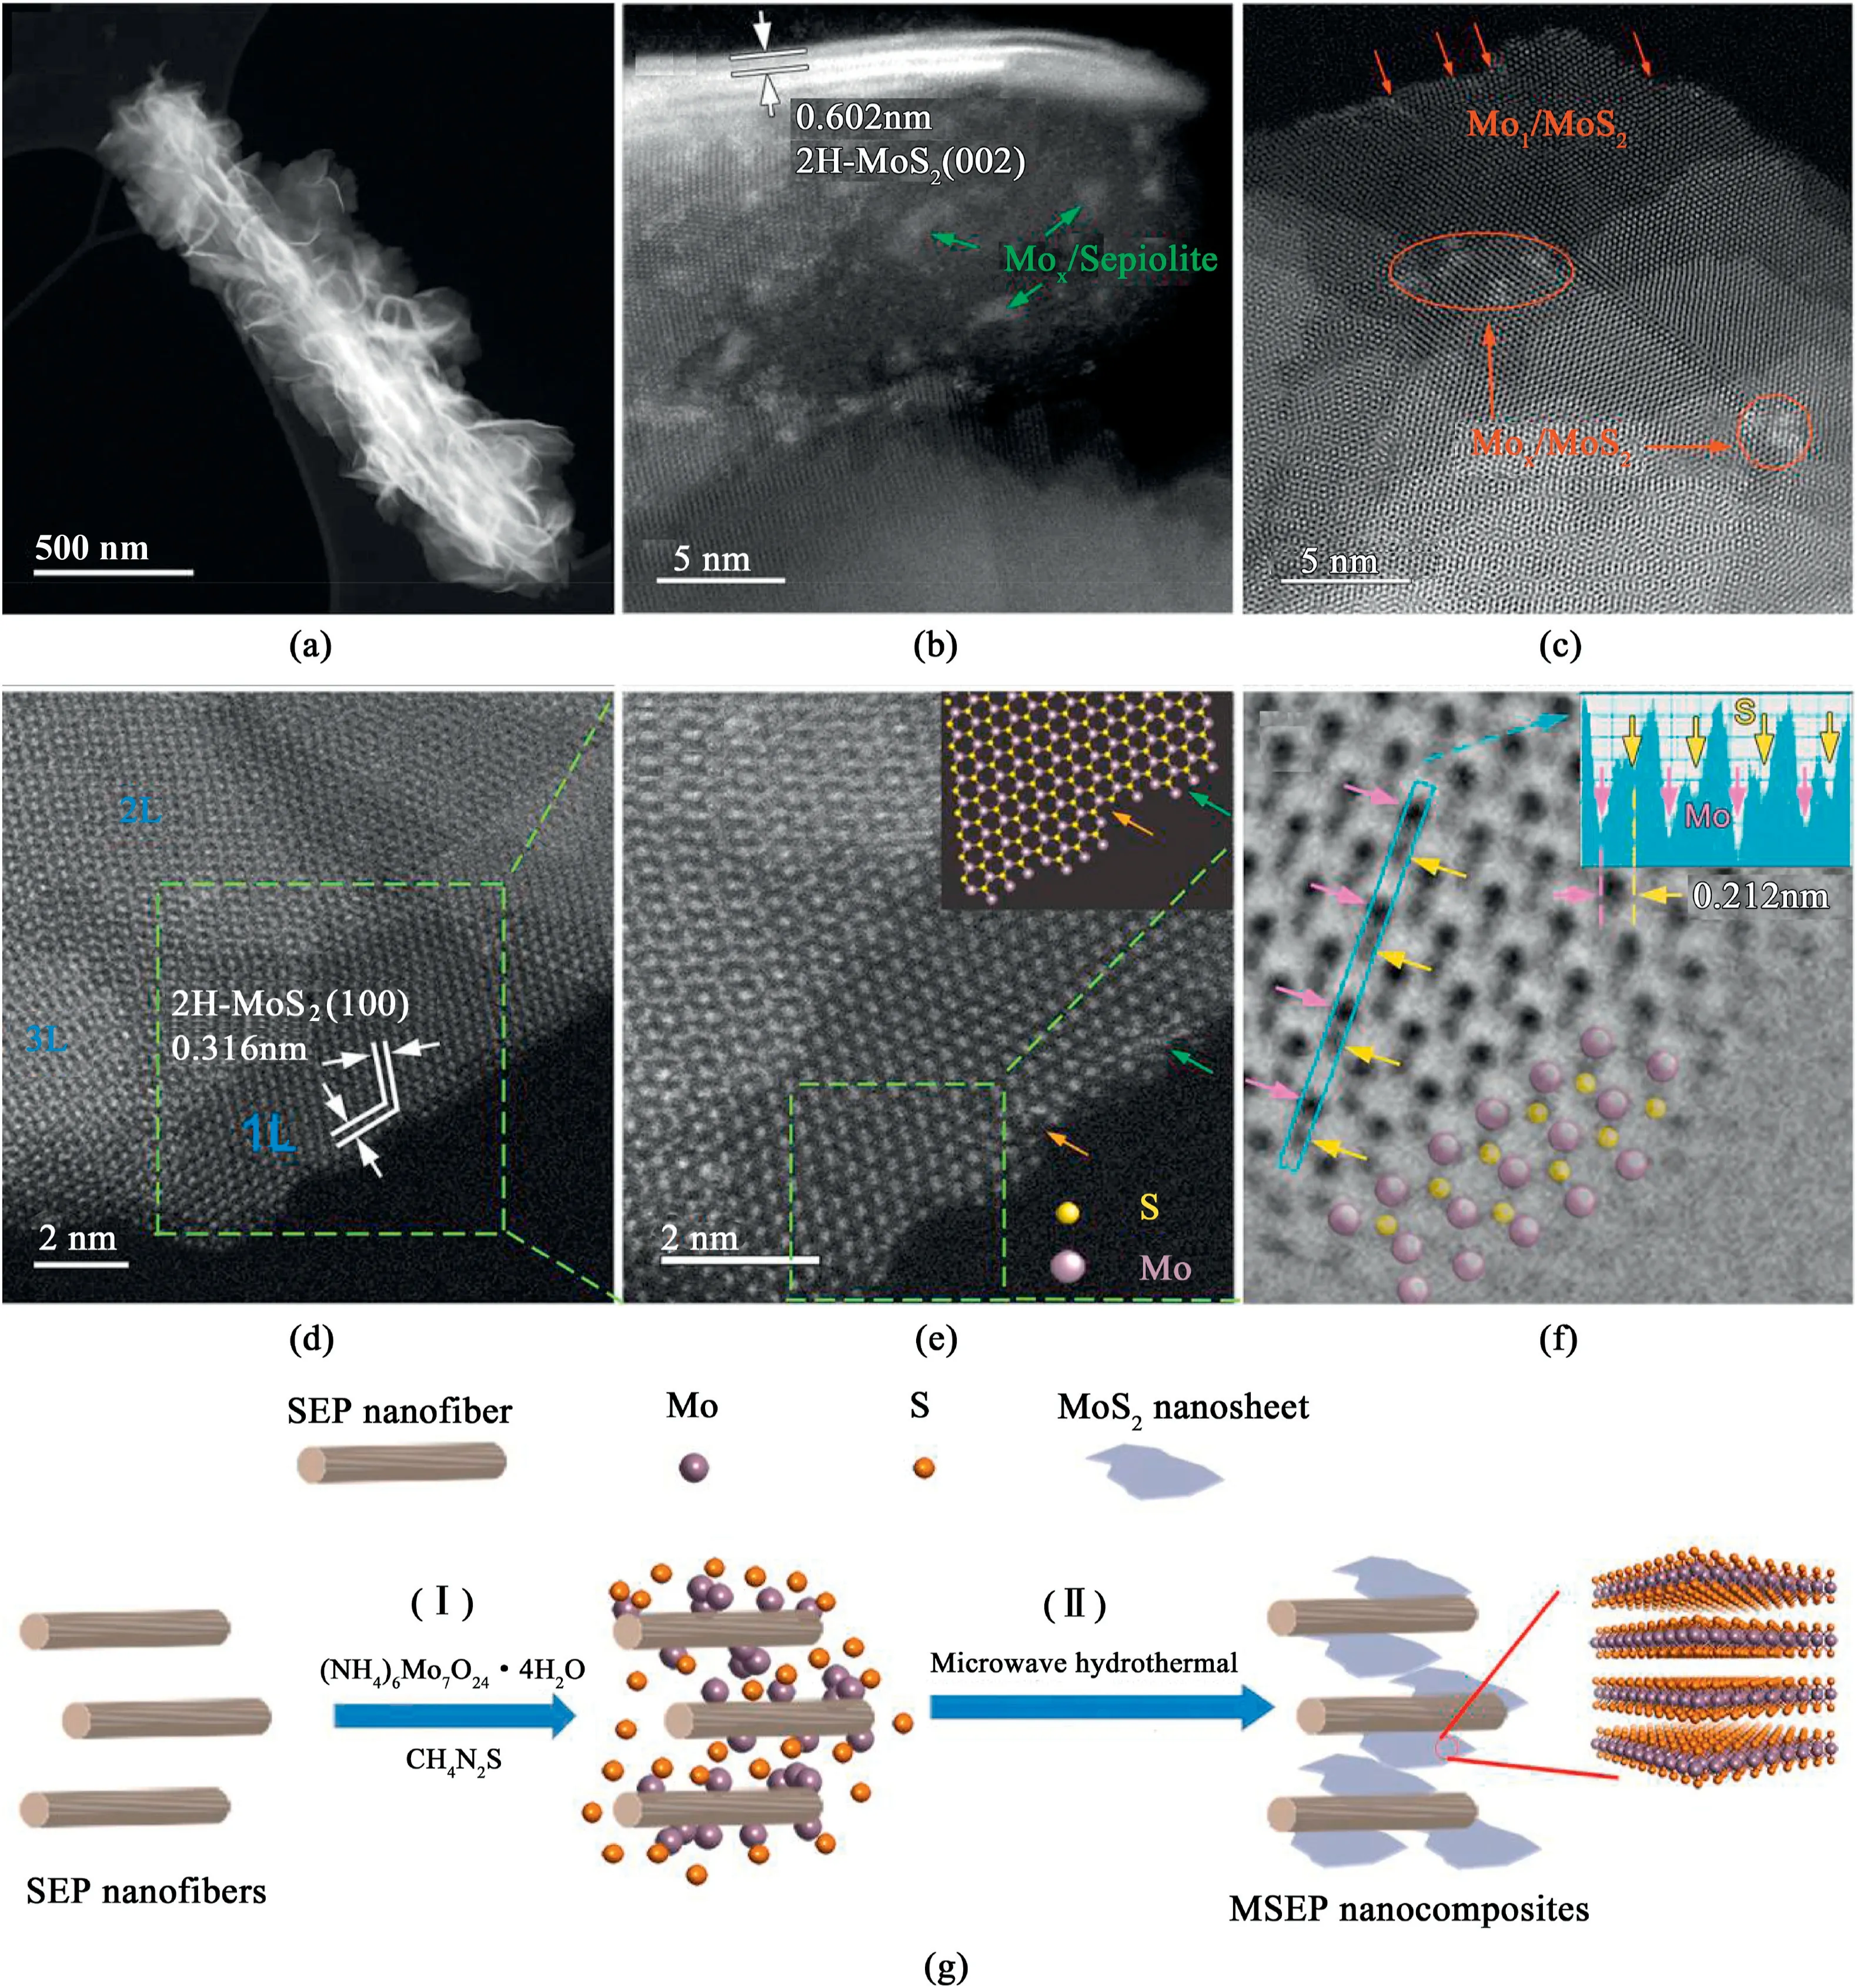
Fig.2.STEM analysis of the atomic structure of MSEP(S-220)nanocomposites.(a)A low-magnified DF-STEM image shows2D MSNSs assembled along the SEP nanofibers.(b–d)Enlarged HAADF images:(b)The atomic structure details of the MoS2-SEP interface,(c,d)the staggered stacking of MoS2monolayers.(e)Highresolution HAADF image revealing atomic defects at the edge of MoS2monolayer.(f)Atom-resolved ABF image which identifies the precise positions of the Mo and S atoms.(g)Growth mechanism of MSEP nanocomposites(I:Adsorption of Mo atoms and clusters on the surface of SEP;II:Microwave hydrothermal synthesis of MSEP nanocomposites).
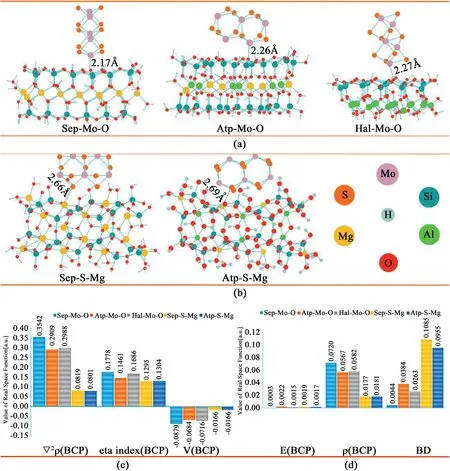
Fig.3.DFT calculations of different MoS2composites.(a)Optimized composite structures of MoS2loaded on the silica tetrahedron surface of SEP,ATP,and HAL.(b)MoS2supported on the magnesia octahedron surfaces of SEP and ATP.(c–d)Real space function values for the BCP of the Mo–O and S–Mg bonds of SEP-Mo-O,ATPMo-O,HAL-Mo-O,SEP-S-Mg,and ATP-S-Mg;with reference to the Laplacian of the electron density(▽2ρ),ŋindex(ŋ),potential energy(V),energy density(E),density of all electrons(ρ),and bond degree(BV).
In order to further study the growth mechanism of the as-synthesized MSEP nanocomposites,attapulgite(ATP)and halloysite(HAL),two other one-dimensional clay mineral nanomaterials,were used as control experiments(Fig.S9,Supporting Information).There were obvious differences in morphology between the as-synthesized MSEP nanocomposites and the two controls,which were modeled and evaluated using Density Functional Theory(DFT)calculations(Fig.3and Fig.S1,Supporting Information).As shown in Fig.3a and b,there are mainly two routes for loading the MoS2onto the surfaces of Sep,Atp,and Hal:one is on the surface of silica oxygen tetrahedral,where the Mo atom forms a Mo–O bond with the O atom;the other is through the S atom binding to the Mg atom on the octahedron in Sep and Atp.The calculated results indicate that the bond distances of Mo–O are2.17Å(SEP-Mo-O),2.26Å(ATP-Mo-O),and2.27Å(HAL-Mo-O),while the bond distances of S–Mg are2.66Å(SEP-S-Mg)and2.69Å(ATP-S-Mg),respectively.MoS2has a stronger Mo–O bond at the surface of the SEP than it does in either the ATP or the HAL.This conclusion is further supported by the real space function and topology analysis(quantum theory of atoms in molecules,QTAIM)[26,31–33].The bond strength analysis(Fig.3c and d)indicates that MoS2forms a non-covalent interaction with the surfaces of the SEP,ATP,and HAL.However,the Mo–O bonds of SEP-Mo-O still have a certain covalent bond feature making it stronger than the ATP-Mo-O or HAL-Mo-O bonds.SEP-Mo-O has the highest bond strength among all of the MoS2/mineral configurations.For the S–Mg bond type,it is clear that the interactions between the S in MoS2and the Mg in SEP and ATP are significantly stronger than others(Fig.3d).Analyzed by bond degree,these phenomena can be interpreted through the distances between two atoms and crystal structure property[34].Although the S–Mg bond is much longer than the Mo–O,the bond degree index of S–Mg is larger than the others(Fig.3b),revealing that the S–Mg of the MSEP is more difficult to break.The S–Mg bond could even be comparable to the S–Mo bond within the MoS2crystal[35–37].Therefore,we conclude that the high Mg content of the SEP contributes to the strong combination between the MoS2and the SEP nanofibers except for the primary Mo–O interactions,as indicated in our DFT calculations.

Fig.4.Photocatalytic performance and mechanism for RhB degradation.(a)Time-dependent absorption spectra variations of RhB solution(for the as-synthesized S-220catalyst).Error bar=SD(N=3);(b)Photocatalytic activity of the MSEP nanocomposites prepared at different temperatures;(c–d)Illustration of the photocatalytic sites and the reaction steps involved in the MSEP nanocomposites and the pure MoS2microspheres photocatalysts.
The distinct bonding between MoS2nanostructure and sepiolite fibers gives the origin of the high dispersion of the atomically thinned MoS2layers,thus yielding abundant active sites for adsorption and charge transportion for catalysis.The photocatalytic activity of the MSEP nanocomposites was evaluated using RhB degradation as a probe reaction,as shown in Fig.4.The initial absorption intensity at553nm continuously decreased with the increased irradiation time(Fig.4a),indicating that the RhB concentration also gradually decreased.The degradation processes of all the MSEP nanocomposites obtained under different temperatures exhibit much higher efficiencies than that(ca.37%)of the pure MoS2after photocatalytic reaction for150min(Fig.4b).The S-220sample reaches the highest degradation efficiency of ca.90%,roughly2.5times the degradation efficiency of the pure MoS2,suggesting that the architecture of the MSEP nanocomposite facilitates photocatalytic activity.Fig.4c illustrates the exposed catalytic active sites for the as-synthesized MoS2microspheres and the MSEP nanocomposite.Although the as-synthesized MoS2microspheres are assembled by MSNSs,most are encapsulated inside the microspheres,which have little-to-zero access to visible light irradiation and thus contribute much less to the photocatalytic degradation of RhB compared with the outmost MSNSs in the microspheres.In contrast,the MSNSs in the MSEP nanocomposite are highly dispersed,offering much more exposed MSNSs with highly active Mo-terminated edges for photocatalysis.Fig.4d further illustrates the synergic effects between the SEP and the grown MSNSs in the MSEP nanocomposite.First,the SEP nanofibers can restrict the MSNSs to1–4atomic layers,creating very abundant exposed active edges.Second,the SEP provides more active adsorption sites for adsorbates(i.e.,RhB),which can be transferred easily to the catalytically active sites to initiate the photocatalytic degradation(as shown in step1)[38].Third,the rich hydroxyl groups(e.g.,Si–OH)on the SEP surface and the abundance of water molecule adsorption are also beneficial to the formation of⋅OH(as shown in step2)[39,40].Fourth,the large specific surface area of SEP provides more active sites,allowing O2to be adsorbed on the catalytic surface to generate more⋅O2-(as shown in step3).Both⋅O2-and⋅OH are critical factors that influence the photocatalytic degradation of dyes(as shown in step4)[41,42].Fifth,these effects of SEP significantly decrease the recombination of the photo-generated electron-hole pairs.The MSEP demonstrates much higher photocatalytic activity than the pure MoS2microspheres.The main steps of the synergistic effects are as follows:
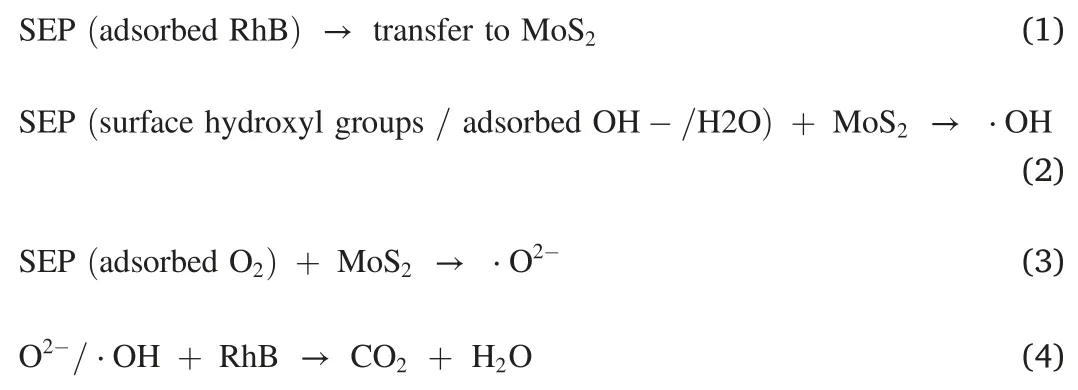
The S-240sample exhibits a slightly lower degradation rate than the S-220,which may be due to the messy clustering of MSNSs resulting from the higher temperature.For all MSEP samples,the fabrication temperature(Fig.4b)and fabrication time(Fig.S10,Supporting Information)show similar tendencies in the photocatalytic degradation of RhB,implying the same catalytic mechanism for the MSEP photocatalysts.Comparing the performance of pure MoS2nanospheres and the MSEP sample shows the advantage of promoting dispersion via mineral supporting(Fig.4c).Compared with the pure MoS2microspheres,the structure of the MSEP facilitates photocatalytic degradation.Table S3,Supporting Information shows the comparsion with some recent works on photocatalytic degradation of RhB.In addition,radical trapping experiments were proposed to verify the main active species during photodegradation by MSEP.The result show the order of influence on the photocatalytic performance is:⋅h+>⋅O2->⋅OH,and the h+as well as⋅O2-play an important role in the photocatalytic process(Fig.S11,Supporting Information).
4.Conclusion
In summary,MSNSs of1–4atomic layers were uniformly grown on SEP nanofibers via a facile microwave hydrothermal method at one thousandth of commercial costs.In this unique hybrid architecture,atom-resolved microscopy showed that the Mo atoms on the mineral surface serve as growth nucleates and a large number of atomic steps exist on the outer edge of the NSs,yielding a high density of atomic defects.In a typical photocatalytic application,the as-developed MSEP has demonstrated considerably enhanced photocatalytic RhB degradation due to abundant exposed Mo-terminated edges.To the best of our knowledge,this is the first report on the successful combination of atomically-thin2D MoS2NSs and1D mineral fibers.DFT calculations disclose that MoS2shows much stronger to the surface of SEP than other minerals due to the Mo–O bond and the high Mg content in the SEP.This work provides an innovative strategy for the low-cost mass production of high quality,atomically-thin2D materials supported on mineral materials.
Author contributions
The manuscript was written through contributions of all authors.All authors have given approval to the final version of the manuscript.
Declaration of competing interest
There are no conflicts to declare.
Acknowledgments
This work was financially supported by the National Natural Science Foundation of China(No.51874115);the CAS Youth Innovation Promotion Association(No.2019190);the Postdoctoral Science Foundation funded project of China(No.2020T130166);the Major Projects of the Natural Science Foundation of Gansu Province,China(No.18JR4RA001);and the Excellent Young Scientist Foundation of Hebei Province,China(No.E2018202241).
Appendix A.Supplementary data
Supplementary data to this article can be found online at https://doi.org/10.1016/j.nanoms.2020.10.007.
杂志排行
Namo Materials Science的其它文章
- Hierarchically electrospun nanofibers and their applications:A review
- RTV silicone rubber composites reinforced with carbon nanotubes,titanium-di-oxide and their hybrid:Mechanical and piezoelectric actuation performance
- Advanced carbon materials with different spatial dimensions for supercapacitors
- Surface microstructure-controlled ZrO2for highly sensitive room-temperature NO2sensors
- Applications of carbon nanomaterials in perovskite solar cells for solar energy conversion
- Synthesis of hexagonal boron nitrides by chemical vapor deposition and their use as single photon emitters
