Key factors and potential drug combinations of nonalcoholic steatohepatitis: Bioinformatic analysis and experimental validation-based study
2021-11-08GuangHanFanRongLiWeiXuYongWeiChenZhiZhangZheTuoQiHaiYangXieShuSenZhengXiaoXu
Guang-Han Fan , Rong-Li Wei , Xu-Yong Wei , Chen-Zhi Zhang , Zhe-Tuo Qi , Hai-Yang Xie , Shu-Sen Zheng , , Xiao Xu , ∗
a Department of Hepatobiliary and Pancreatic Surgery, Affiliated Hangzhou First People’s Hospital, Zhejiang University School of Medicine, Hangzhou 310 0 06, China
b Department of Hepatobiliary and Pancreatic Surgery, the First Affiliated Hospital, Zhejiang University School of Medicine, Hangzhou 310 0 03, China
c NHC Key Laboratory of Combined Multi-organ Transplantation, Hangzhou 310 0 03, China
d Department o f Hepatobiliary and Pancreatic Surgery, Shulan (Hangzhou) Hospital, Hangzhou 310 0 0 0, China
Keywords: Nonalcoholic steatohepatitis Hepatocellular carcinoma microRNA Bioinformatic analysis Drug combination
ABSTRACT Background: Nonalcoholic fatty liver disease and its advanced stage, nonalcoholic steatohepatitis (NASH), are the major cause of hepatocellular carcinoma (HCC) and other end-stage liver disease. However, the potential mechanism and therapeutic strategies have not been clarified. This study aimed to identify po-tential roles of miRNA/mRNA axis in the pathogenesis and drug combinations in the treatment of NASH. Methods: Microarray GSE59045 and GSE48452 were downloaded from the Gene Expression Omnibus and analyzed using R. Then we obtained differentially expressed genes (DE-genes). DAVID database was used for Gene Ontology (GO) analysis and Kyoto Encyclopedia of Genes and Genomes (KEGG) enrich-ment pathway analysis. Protein-protein interaction (PPI) networks were used for the identification of hub genes. We found upstream regulators of hub genes using miRTarBase. The expression and correlation of key miRNA and its targets were detected by qPCR. Drug Pair Seeker was employed to predict drug com-binations against NASH. The expression of miRNA and hub genes in HCC was identified in the Cancer Genome Atlas database and Human Protein Atlas database. Results: Ninety-four DE-genes were accessed. GO and KEGG analysis showed that these predicted genes were linked to lipid metabolism. Eleven genes were identified as hub genes in PPI networks, and they were highly expressed in cells with vigorous lipid metabolism. hsa-miR-335-5p was the upstream regu-lator of 9 genes in the 11 hub genes, and it was identified as a key miRNA. The hub genes were highly expressed in NASH models, while hsa-miR-335-5p was lowly expressed. The correlation of miRNA-mRNA was established by qPCR. Functional verification indicated that hsa-miR-335-5p had inhibitory effect on the development of NASH. Finally, drug combinations were predicted and the expression of miRNA and hub genes in HCC was identified. Conclusions: In the study, potential miRNA-mRNA pathways related to NASH were identified. Targeting these pathways may be novel strategies against NASH.
Introduction
Nonalcoholic fatty liver disease (NAFLD), which is character-ized by ≥5% hepatic fat accumulation, has become an increasingly serious clinical burden [1] . According to epidemiological studies, around 25% of people in the United States have NAFLD of varying severity [2] .
Nonalcoholic steatohepatitis (NASH) is the most advanced stage of NAFLD. Around 20%-27% of the NAFLD patients develop NASH [3] . NAFLD and NASH lead to cirrhosis, hepatocellular carcinoma (HCC), and other end-stage liver diseases necessi-tating liver transplantation. They thus exact a rigorous global burden [4] . NAFLD/NASH is a risk factor for HCC, and 59% HCC patients also suffer from NAFLD/NASH [5] . However, the NAFLD/NASH-related HCC is harder to diagnose in comparison to other etiologies. Around 35% NAFLD/NASH-related HCC patients do not have cirrhosis, and NAFLD/NASH patients have more than five-fold risk of developing into HCC without cirrhosis compared with hepatitis C virus (HCV) patients [6] . Therefore, NAFLD/NASH-related HCC is more often diagnosed at a later stage [7] . The current screening methods cannot help the early diagnosis of NAFLD/NASH-related HCC. Because the genetics and environment determine the occurrence and development of NAFLD/NASH, more risk factors and biomarkers at the molecular level should be pre-dicted.
A previous study has discovered some genetic and epigenetic factors including patatin-like phospholipase domain-containing protein 3 (PNPLA3) I148M, DNA methylation, chromatin remodel-ing, and unusual expression of non-coding RNAs [8] . The 148M variant can prevent PNPLA3 from ubiquitylation and degradation, hence induce the accumulation of PNPLA3. Besides, the 148M vari-ant results in lipid accumulation and NASH [9] . microRNAs (miR-NAs) are small non-coding RNAs with ~22 nucleotides. One study has shown that non-coding RNAs including miRNAs are closely related to multiple diseases such as cancer, neurological, cardio-vascular, and developmental diseases [10] . miR-122 is the most abundantly expressed miRNA in the liver, and downregulating the level of miR-122 contributes to abnormal lipid metabolism and NASH [11] . Another study showed that miR-33a and miR-144 are related with NASH in morbidly obese subjects [12] . These stud-ies provided important references for other upcoming studies and clinical practice. Currently, there is no drug therapy approved for the treatment NAFLD/NASH. In this study, we aimed to find key genes and their upstream regulators in NASH and predict the po-tential drug combinations.
In the present study, we identified differentially expressed (DE)-genes by analyzing data from the Gene Expression Omnibus (GEO) database. Gene Ontology (GO) analysis and Kyoto Encyclopedia of Genes and Genomes (KEGG) enrichment pathway analysis revealed the processes that these DE-genes enriched. Protein-protein inter-action (PPI) network revealed the hub genes. Cancer Cell Line En-cyclopedia (CCLE) database introduced the expression of hub genes in cells with vigorous lipid metabolism. The miRTarBase was used to predict the potential miRNAs targeting hub genes. Data from the Cancer Genome Atlas (TCGA) were used to identify the correla-tion between the predicted miRNA and its possible target genes. The expression of miRNA/hub genes and their corrections was ver-ified in the cell and mouse models. Potential drug combinations targeting NASH were predicted by Drug Pair Seeker (DPS). Lastly, the expression of miRNA/hub genes in protein and mRNA levels in HCC was identified in the TCGA database and Human Protein Atlas (HPA) database.
Methods
The mRNA microarray and identification of DE-genes
Using the GEO database ( https://www.ncbi.nlm.nih.gov/geo ), we filtered suitable datasets about the gene expression in NASH pa-tients. We then collected two datasets: GSE59045 and GSE48452. GSE59045 was a dataset based on platform GPL15207 [PrimeView] Affymetrix Human Gene Expression Array, which had the gene expression data of 6 healthy controls and 5 NASH patients. GSE48452 was a dataset based on platform GPL11532 [HuGene-1_1-st] Affymetrix Human Gene 1.1 ST Array [transcript (gene) ver-sion], which had the gene expression data of 14 healthy controls and 18 NASH patients. Because some patients from this database underwent bariatric surgery, we excluded the data of these pa-tients. Finally, we obtained the data of 12 healthy controls and 14 NASH patients.
Next, we chose the healthy control group and NASH group for further research. Data were normalized firstly using R (Version 4.0.2). Then, we used the R package ‘LIMMA’ for differential anal-ysis [13] . Screening criteria of DE-genes were: thePvalue<0.05 and |log 2 FC|>0.9. DE-genes were showed in volcano plots and heatmaps were drawn using R. Lastly, we checked the expression of DE-genes from two datasets. Genes that were only highly ex-pressed or lowly expressed in both databases were retained as DE-genes.
GO and KEGG pathway analysis
To determine the functions in biological process (BP), cellular component (CC), molecular function (MF), and potential enriched pathway, we used the database for annotation, visualization, and integrated discovery (DAVID 6.8, https://david.ncifcrf.gov ) to per-form GO and KEGG pathway analysis. APvalue<0.05 was re-garded as a significant difference.
PPI network construction and identification of hub genes
DE-genes were mapped to the STRING database ( http:// string-db.org ) and constructed as a PPI network. Screening crite-rion of significant network was: interaction with a combined score>0.4. We used the CytoHubba application in Cytoscape software (Version 3.6.1) to determine the hub genes based on the calculated degree.
Gene expression in CCLE
Through the CCLE ( https://portals.broadinstitute.org/ccle ) database, we obtained gene expression data in more than 10 0 0 cancer cell lines. Firstly, we searched hub genes and limited the condition to “liver”. Then, data were downloaded and displayed using GraphPad Prism Software (Version 7).
miRNA prediction and miRNA-gene network construction
The miRTarBase ( http://miRTarBase.mbc.nctu.edu.tw/ ) is a database that provides experimentally validated miRNA-target interactions (MTIs) [14] . We predicted the potential upstream miRNAs of hub genes. Then we used Cytoscape software (Version 3.6.1) to construct the miRNA-gene network.
Correlation analysis between miRNA and gene
Linked Omics ( http://www.linkedomics.org/ ) provides a conve-nient way to analyze the correlation between the two cancer fac-tors from TCGA data [15] . In this study, we used the data to ana-lyze the correlation between hsa-miR-335 and its potential genes in HCC patients. Negative correlation indicated that there could be a connection between them. The miRNA/gene axis might play an important roleinvivo. Statistical results were displayed through GraphPad Prism Software (Version 7).
Cell culture and transfection
HepG2 and Huh7 cell lines were purchased from the cell bank of the Chinese Academy of Sciences (Shanghai, China). The cells were cultured in Dulbecco’s Modified Eagle Medium (DMEM, Thermo ScientificTM,Waltham, MA, USA) with 10% fetal bovine serum (FBS, Thermo ScientificTM). The cell culture environment was 37◦C with 5% CO 2 .
Cells were digested for 2 min using trypsin-EDTA (Gibco, Thermo ScientificTM), inoculated into a six-well plate, and trans-fected using Lipo30 0 0 Transfection Reagent (Thermo ScientificTM) in the period of logarithmic growth. miRNA mimic and non-targeting mimic (final concentration: 50 nmol/L) were purchased from GenePharma (Shanghai, China).
Animal experiments
Male C57BL/6 mice (age: 4 weeks) were purchased from Zhe-jiang Academy of Medical Sciences. The animals were housed in cages at 20◦C with a 12:12 light-dark cycle. They were caged for one week before the experiment to adapt to the new environment. The procedures were approved by the Institutional Animal Care and Use Committee and the Ethics Committee of Zhejiang Univer-sity. The experiments complied with the ARRIVE guidelines and the National Institute of Health guide for the care and use of laboratory animals.
Eight mice were divided into two groups randomly, control group was fed with a normal chow diet whereas NASH group was fed using a high-fat diet (60 kcal% fat, D12492, Research Diets, New Brunswick, NJ, USA). All animals were fed for 6 months and sacri-ficed. Livers were used for hematoxylin-eosin (HE) staining and Oil Red O staining to determine the existence of NASH (Fig. S1) and gene expression.
RNA extraction and quantitative-PCR (qPCR)
Total RNA was extracted from cells and tissues using TRIzol reagent (Thermo ScientificTM) following the standard protocol. We used Nanodrop (Thermo ScientificTM) to determine RNA concentra-tion, then used a reverse transcription reagent kit from GENESEED (Guangzhou, China) to obtain cDNA. Finally, qPCR was performed in triplicates on Applied Biosystems 7500 Real-Time PCR Detection Systems (Thermo ScientificTM) using the SYBR supermix (Bio-Rad, Hercules, CA, USA). Gene expression was relative toβ-actin or U6. Sequences of primers that were used in the study are listed in Ta-ble S1.
Triglyceride assays
The cells were washed twice with phosphate buffer saline (PBS) buffer, then they were suspended in PBS and broken by ultra-sound. The amount of triglyceride was quantified using a triglyc-eride quantification kit supplied by Nanjing Jiancheng Bioengineer-ing Institute (Nanjing, China). Bicinchoninic acid (BCA) supplied by FUDEBIO (Hangzhou, China) was used to measure the protein con-centration to indicate cell mass.
Oil Red O staining
Cell supernatant was removed, cells were washed twice with PBS and immobilized using 4% formaldehyde for 2 h, and tissues from mice were prepared as a frozen slice. Then, immobilized cells or tissues were stained with filtered Oil Red O solution for 1 h at room temperature, and hematoxylin was used for staining the nu-cleus for 5 min. Stained lipid droplets and nucleus were observed using a microscope.
Prediction of the drug combination and drug-gene network construction
Drug Pair Seeker (DPS, Version 1.4.0, http://www.maayanlab. net/DPS/ ) is a program that can predict and prioritize pairs of drugs based on DE-genes [16] . Through uploading DE-genes, we obtain the top 10 potential drug combinations and the connections between drugs and genes. We constructed a drug-gene network by Cytoscape software (Version 3.6.1).
Analysis of gene expression in HCC using TCGA and HPA databases
UALCAN ( http://ualcan.path.uab.edu/ ) is a comprehensive re-source for analyzing cancer data from TCGA [17] . Using UALCAN, we got the expression data of hub genes. We obtained human protein expression information through the HPA database ( https://www.proteinatlas.org/ ).
Statistical analysis
Data were analyzed using GraphPad Prism Software (Version 7) and represented as mean ±standard deviation (SD). All the results were independently repeated three times. A two-tailed Student’st-test was conducted for comparing the differences between the two groups. APvalue<0.05 was considered statistically significant.
Results
Identification of DE-genes in NASH patients
Firstly, we downloaded original data of GSE59045 and GSE48452 from GEO. Data were normalized and shown in Fig. S2. Then, the data were analyzed using the LIMMA software package, and results were shown in volcano plots ( Figs. 1 A, 2 A). After re-moving the blank probes and merging duplicate probes, we fi-nally got 86 DE-genes from GSE59045, including 67 upregulated and 19 downregulated DE-genes. As for GSE48452, 67 DE-genes were filtered, including 42 upregulated and 25 downregulated DE-genes. To better present the results, the top 15 most upregulated DE-genes and top 15 most downregulated DE-genes of the two datasets were displayed through heatmaps ( Figs. 1 B, 2 B). Then we merged these DE-genes from two datasets, got 94 DE-genes finally, and they expressed consistently in both datasets ( Table 1 ).
GO functional enrichment analysis
Three categories of GO functional enrichment analyses were performed on the 94 DE-genes ( Fig. 3 ). In particular, the enriched GO functions for the 94 DE-genes included cholesterol biosynthetic process, oxidation-reduction process, isoprenoid biosynthetic pro-cess, unsaturated fatty acid biosynthetic process, and cholesterol biosynthetic process via desmosterol in the BP category; endo-plasmic reticulum membrane, endoplasmic reticulum, intracellular membrane-bounded organelle, organelle membrane, and extracel-lular space in the CC category; oxidoreductase activity, iron ion binding, protein homodimerization activity, nicotinamide adenine dinucleotide phosphate (NADP) binding, and heme-binding in the MF category ( Table 2 ).
KEGG pathway enrichment analysis
KEGG pathway enrichment analysis revealed that these DE-genes were enriched in some key lipid metabolism pathways such as steroid biosynthesis, metabolic pathways, and fatty acid metabolism. In addition, we observed that these genes were also enriched in PPAR signaling pathway and AMPK signaling pathway which are closely related to both inflammation and metabolism. Inflammation is also one of the important features of NASH ( Table 3,Fig. 4 ). Results of GO and KEGG indicated that these DE-genes are closely related to lipid metabolism and NASH.
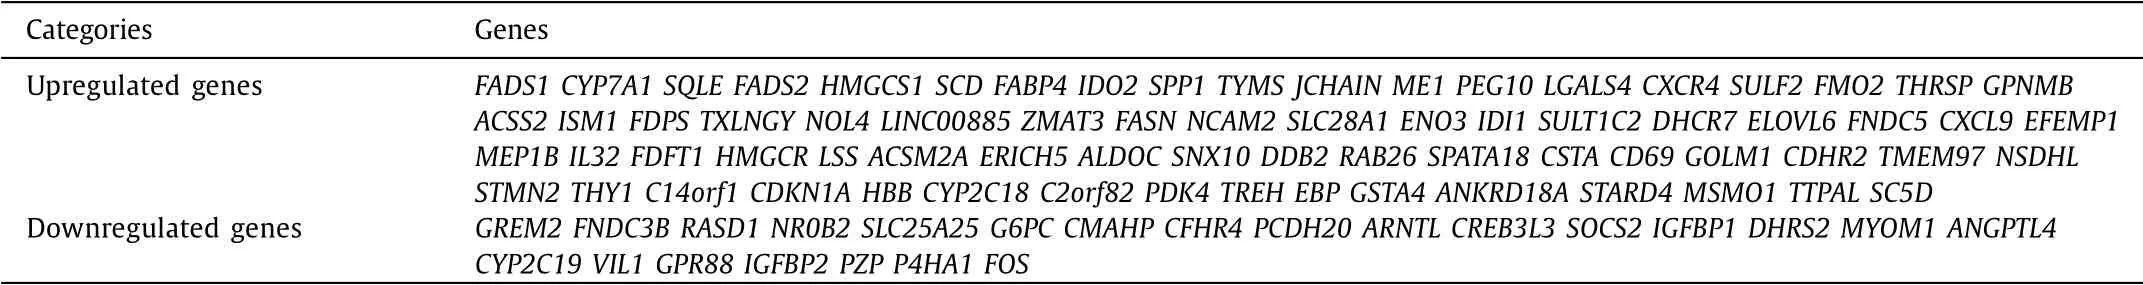
Table 1 Ninety-four DE-genes from two datasets.
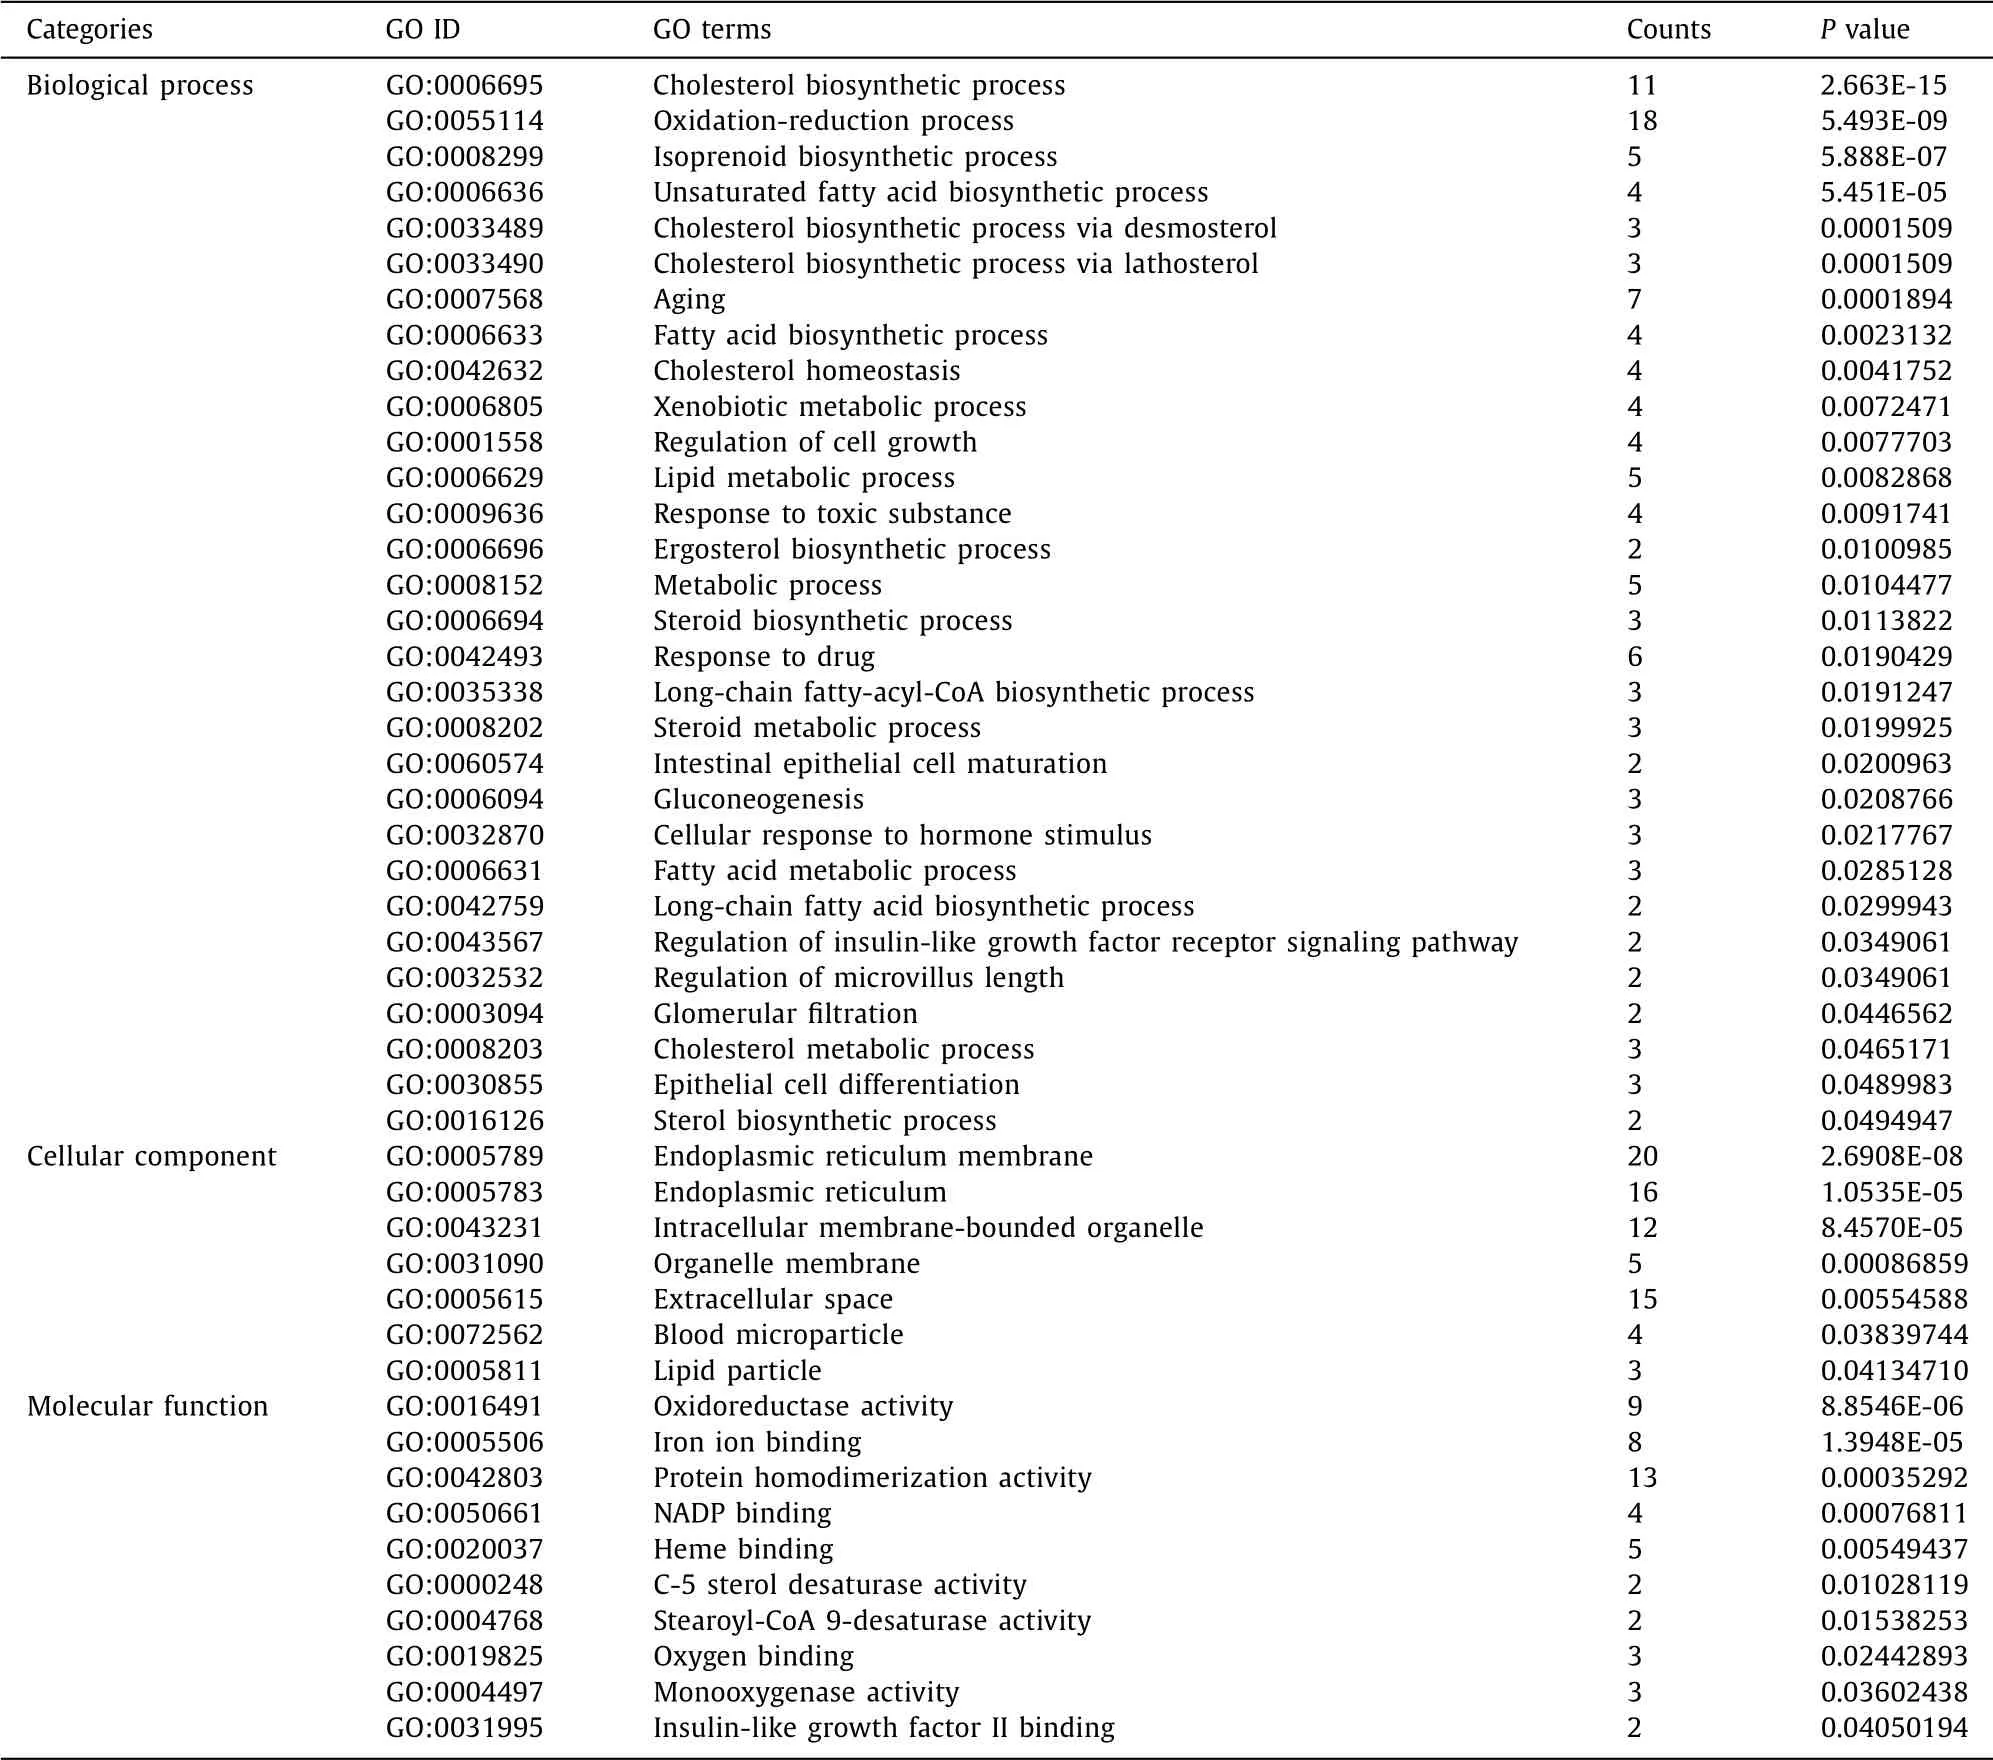
Table 2 Significant GO terms enriched by DAVID.

Fig. 1. Volcano plot and heatmap of the differentially expressed genes (DE-genes) in GSE59045. A: Volcano plot of the DE-genes. Grey dots represent genes that are not differentially expressed in the control group and NASH group; red dots and green dots represent genes that are upregulated and downregulated significantly in NASH. B: Heatmap of the DE-genes. Red rectangles mean that genes are upregulated in these samples, and blue ones mean downregulated. NASH: nonalcoholic steatohepatitis.
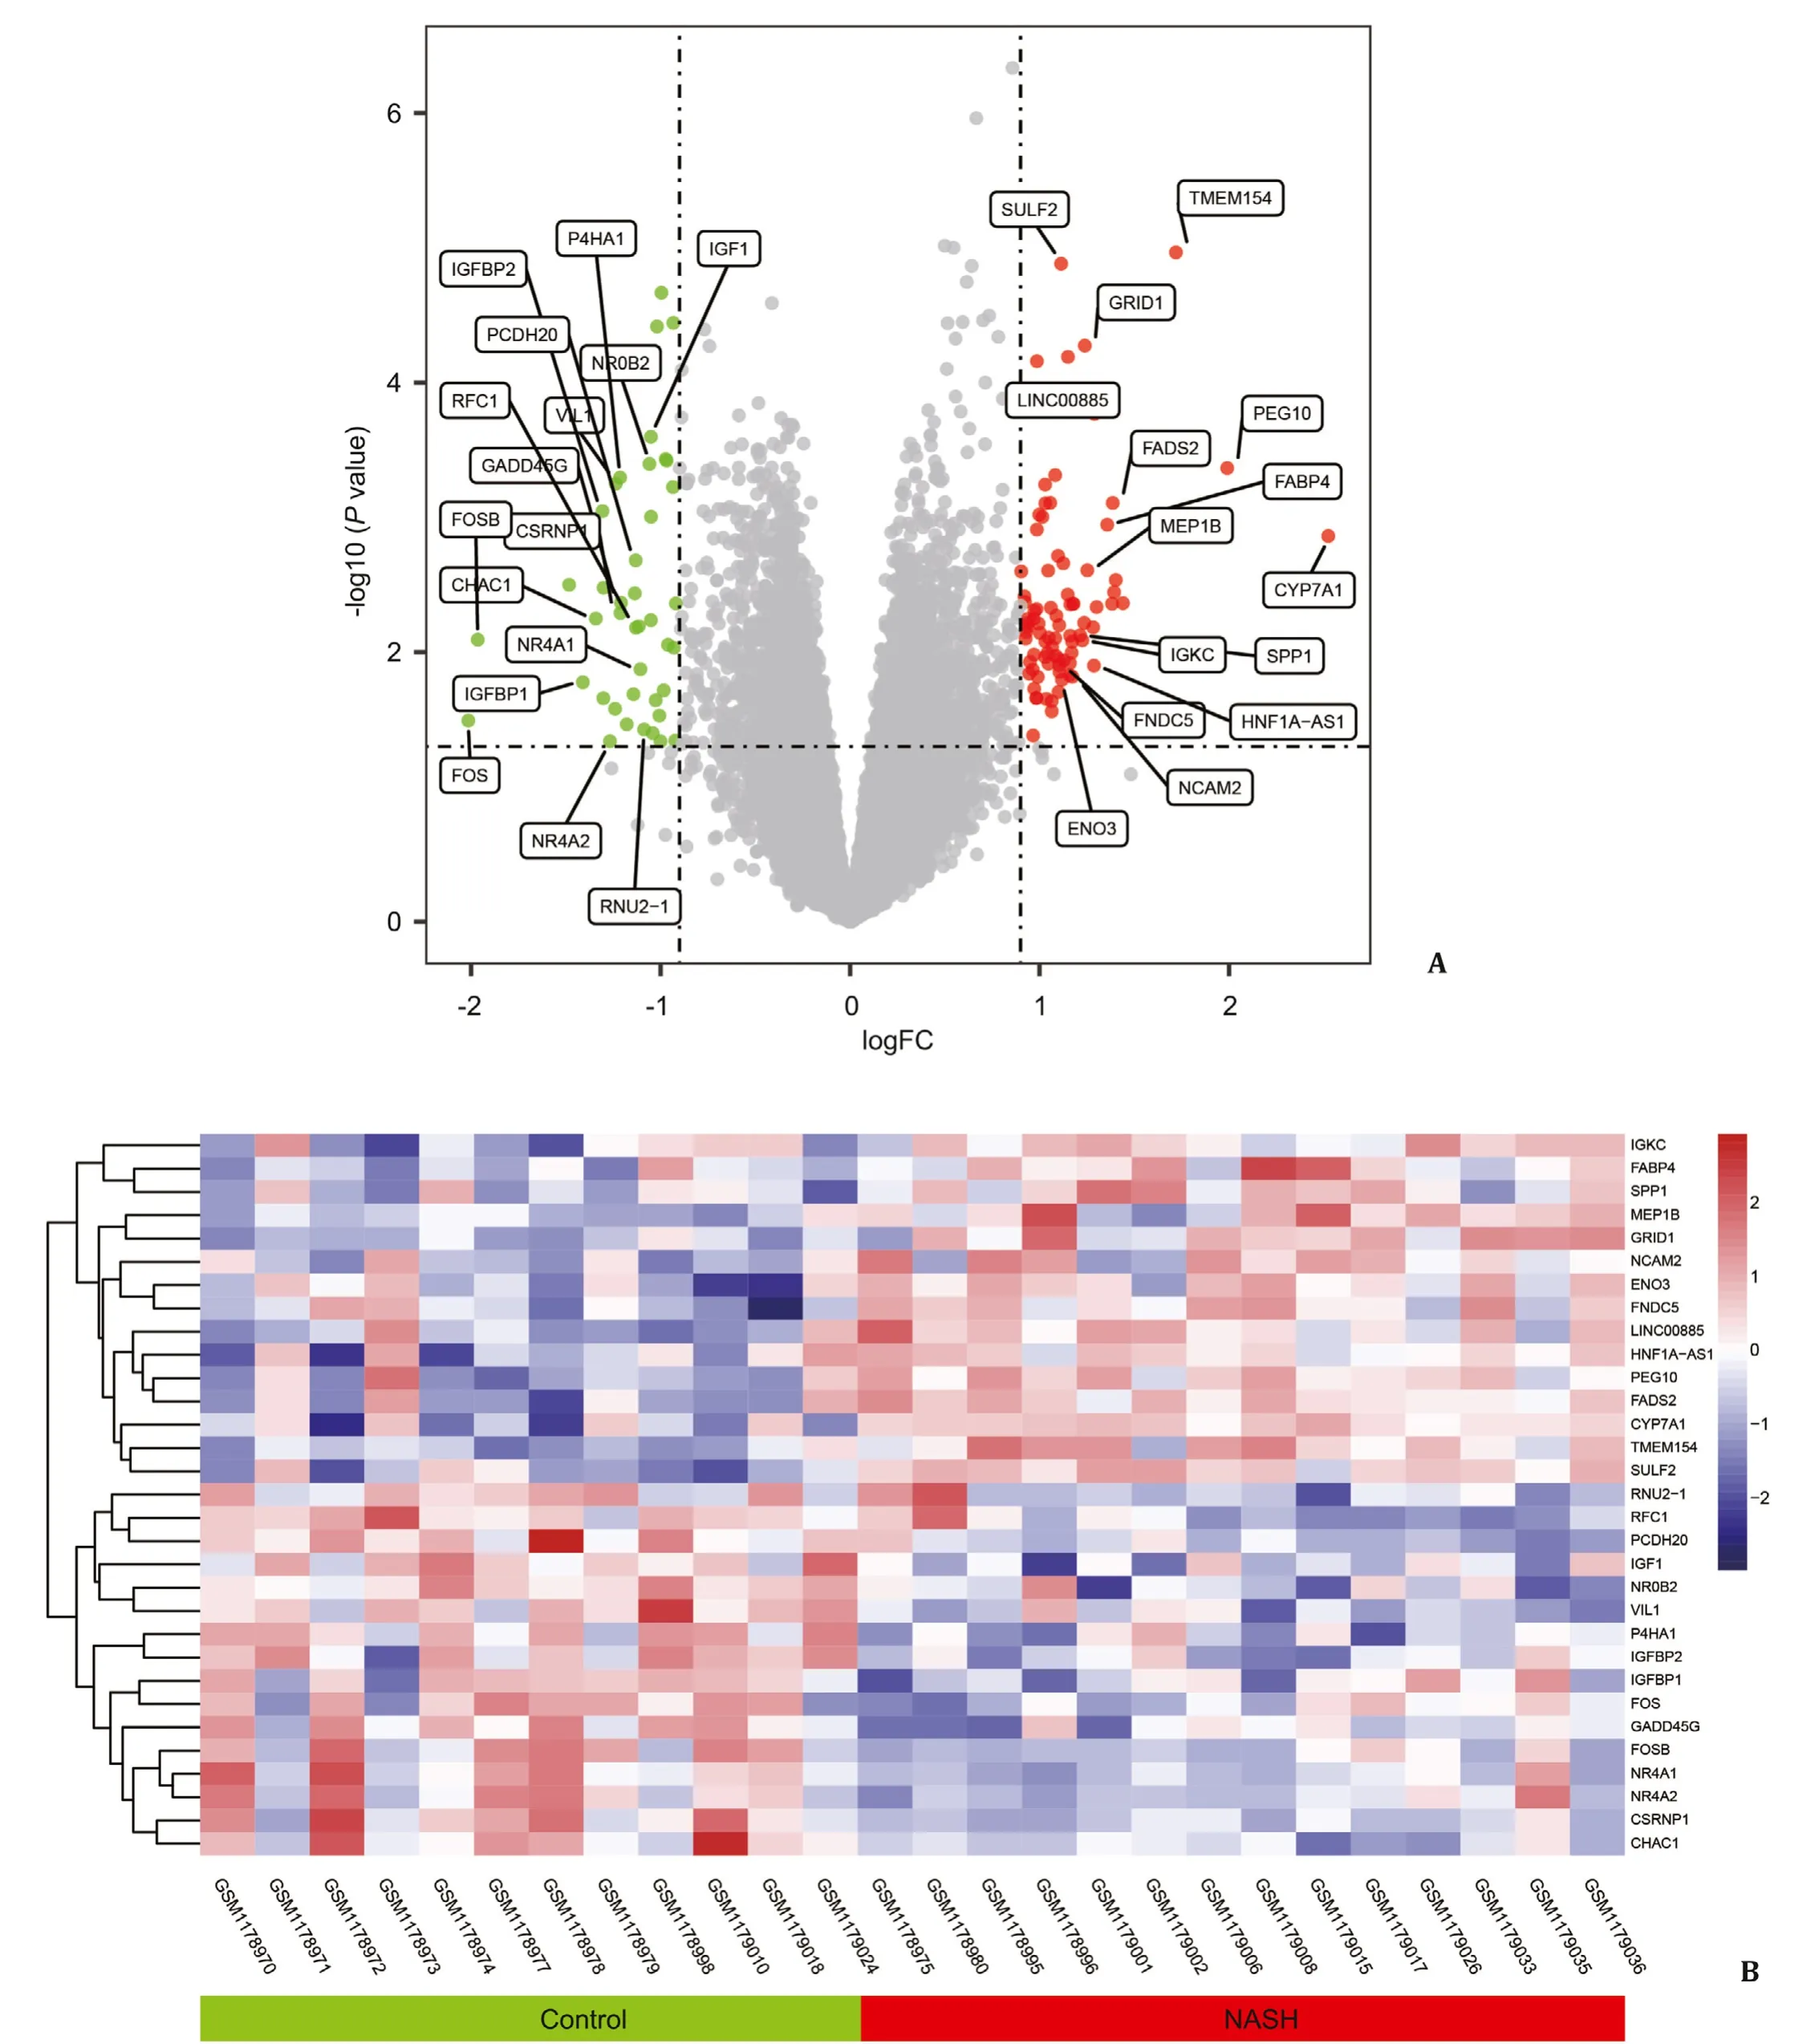
Fig. 2. Volcano plot and heatmap of the differentially expressed genes (DE-genes) in GSE48452. A: Volcano plot of the DE-genes. Grey dots represent genes that are not differentially expressed in the control group and NASH group; red dots and green dots represent genes that are upregulated and downregulated significantly in NASH. B: Heatmap of the DE-genes. Red rectangles mean that genes are upregulated in these samples, and blue ones mean downregulated. NASH: nonalcoholic steatohepatitis.

Fig. 3. GO functions for DE-genes. The left side of the circle includes all related genes, and the right side is GO terms. Red and blue rectangles mean that genes are upregulated and downregulated in NASH. DE-genes: differentially expressed genes; NASH: nonalcoholic steatohepatitis.
Construction and analysis of PPI network
Using the STRING database, we constructed the PPI network of 94 DE-genes ( Fig. 5 A). We found that there were strong connec-tions between these genes. To find hub genes, the degree of con-nectivity in the PPI network was calculated using Cytoscape soft-ware. The top 11 hub genes in the network and connections be-tween them were shown in Fig. 5 B. Fig. 5 C presented the node de-grees of the top 11 hub genes. Then we explored the expression of these hub genes, and we found that all genes were upregulated in NASH ( Table 4 ).
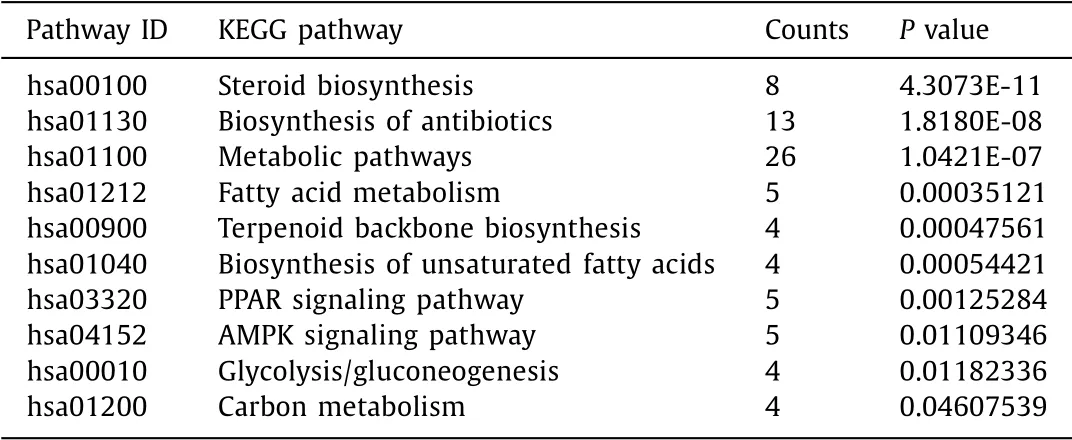
Table 3 Significant KEGG terms enriched by DAVID.
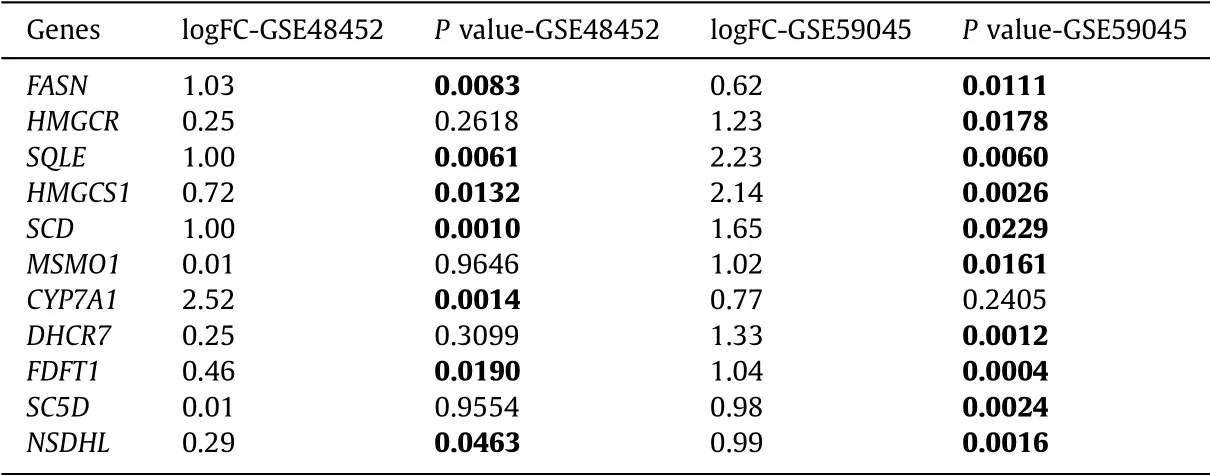
Table 4 Expression of the top 11 hub genes related to NASH.
Expression of hub genes in CCLE database
Huh7 and HepG2 cell lines are two HCC cell lines which are often used in lipid metabolism studies because of their vigorous lipid metabolism [18] . We used the CCLE database and obtained the relative expressions of the hub genes in 25 liver cancer celllines. We found that these 11 hub genes were all highly expressed in Huh7 and HepG2 cell lines. This interesting result showed that these genes were related to lipid metabolism and they could play important roles in the development of NASH ( Fig. 6 ).

Fig. 4. KEGG pathway enrichment for DE-genes. The sizes of the circle represent the number of genes enriched in pathways, the color of the circle means significance. DE-genes: differentially expressed genes.
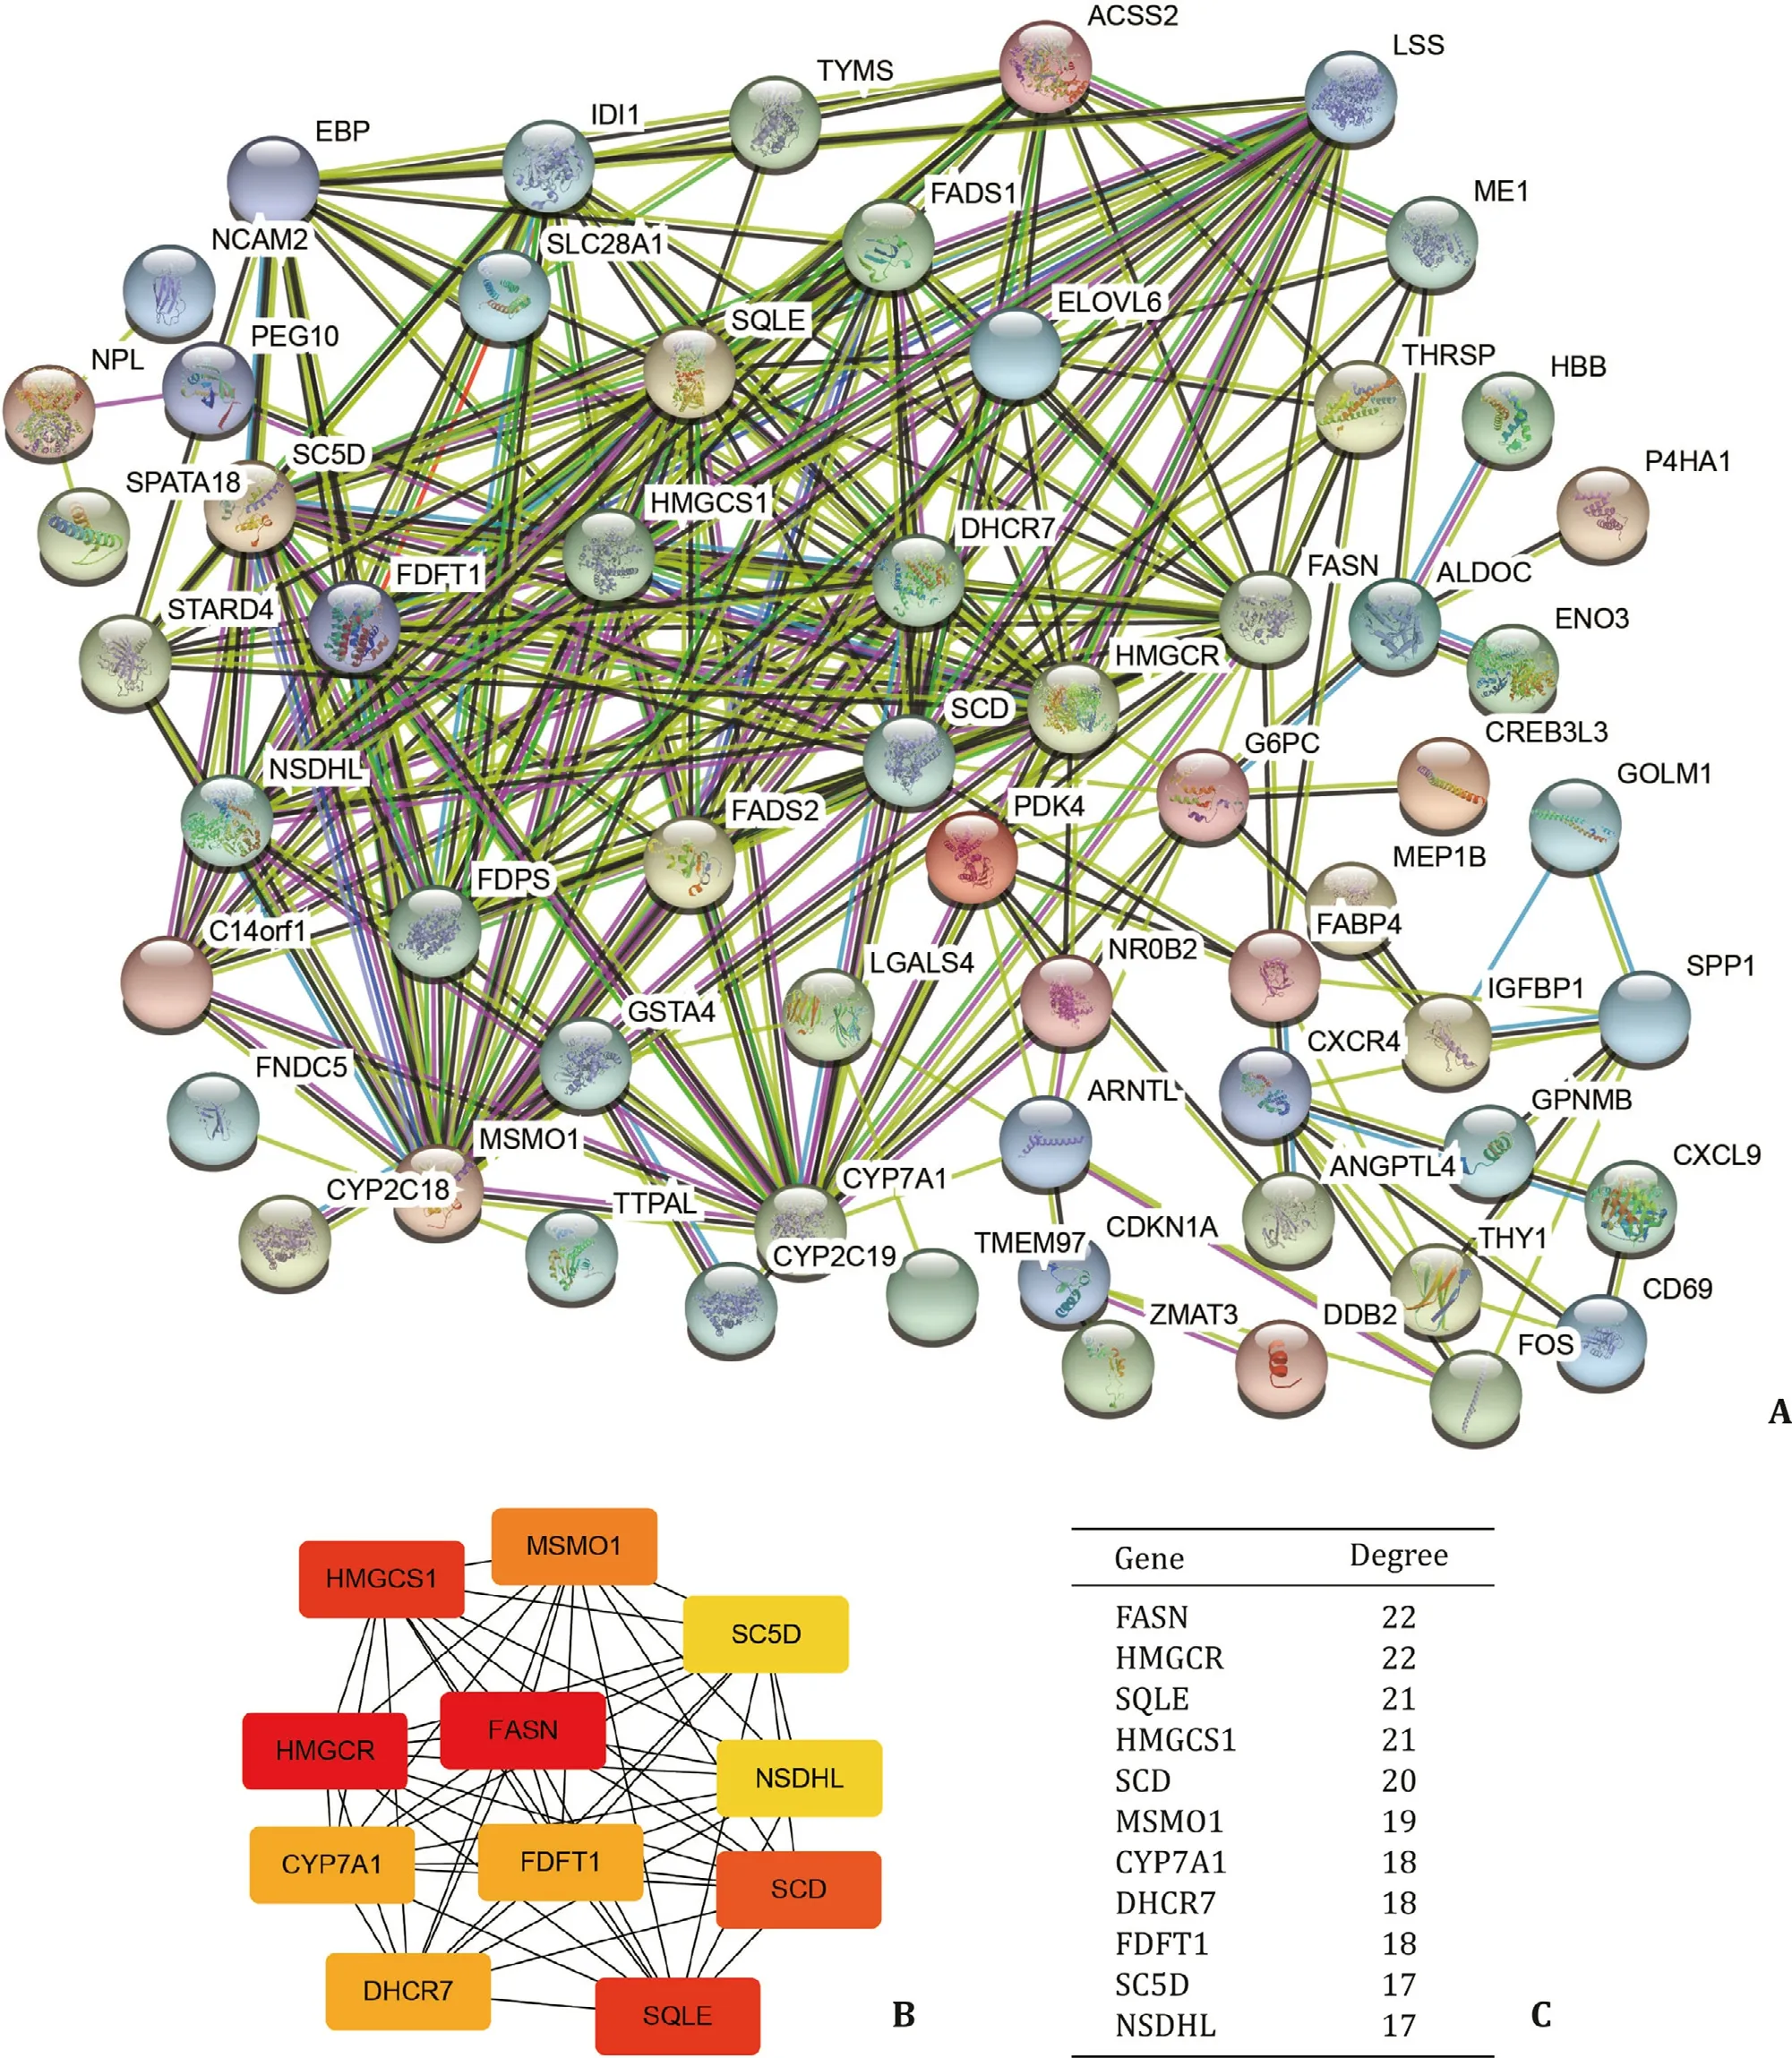
Fig. 5. Identification of hub genes. A: PPI network of DE-genes, the combined score of interactions are more than 0.4. B: Links between the top 11 hub genes. C: Node degree of hub genes. DE-genes: differentially expressed genes.
miRNA prediction and identification of key miRNAs
To identify the key miRNAs in the development of NASH, we used miRTarBase to find upstream regulators of hub genes. Among the miRNAs predicted, we found that hsa-miR-335-5p was the common upstream regulator of 9 genes in the 11 hub genes (CYP7A1,DHCR7,FDFT1,HMGCR,HMGCS1,SC5D,SCD,SQLE,andMSMO1). This result suggests that miR-335-5p may play an impor-tant role in NASH.
Linked Omics database can analyze the correlation between genes and miRNAs by obtaining data from the TCGA database. We found thatHMGCR,SCD,andMSMO1had a significantly negative correlation with hsa-miR-335-5p in HCC patients. This phenomenon indicates that hsa-miR-335-5p is a potential im-portant upstream moderator of these lipid metabolism-related genes. Furthermore,SQLE,HMGCS1,andCYP7A1showed a nega-tive correlation with hsa-miR-335-5p but it was not significant;DHCR7,FDFT1,andSC5Dhad positive correlation with hsa-miR-335-5p with no significance. In a word, hsa-miR-335-5p might be an important regulator of multiple lipid metabolism-related genes. Its disorder may contribute to NASH development ( Figs. 7 and S3).
Expression of hub genes and hsa-miR-335-5p in mouse and cell models
We verified the expression of hub genes and hsa-miR-335-5p in mouse and cell models. The expectedFASNgenes were found to be highly expressed in NASH mouse models compared with those in the normal diet group. We observed thatFASNwas not highly expressed, even lowly expressed in NASH mouse models ( Fig. 8 A).FASNis a key regulator in fatty acid (FA) synthesis [19] . But the high-fat diet model can exogenously supplement FA, which causes the expression ofFASNto remain unchanged. Further re-search about the expression ofFASNin NASH should be conducted using clinical cases and spontaneous NASH mouse models.

Fig. 6. Expression of hub genes in 25 liver cancer cell lines. These hub genes were upregulated in Huh7 and HepG2 cell lines.
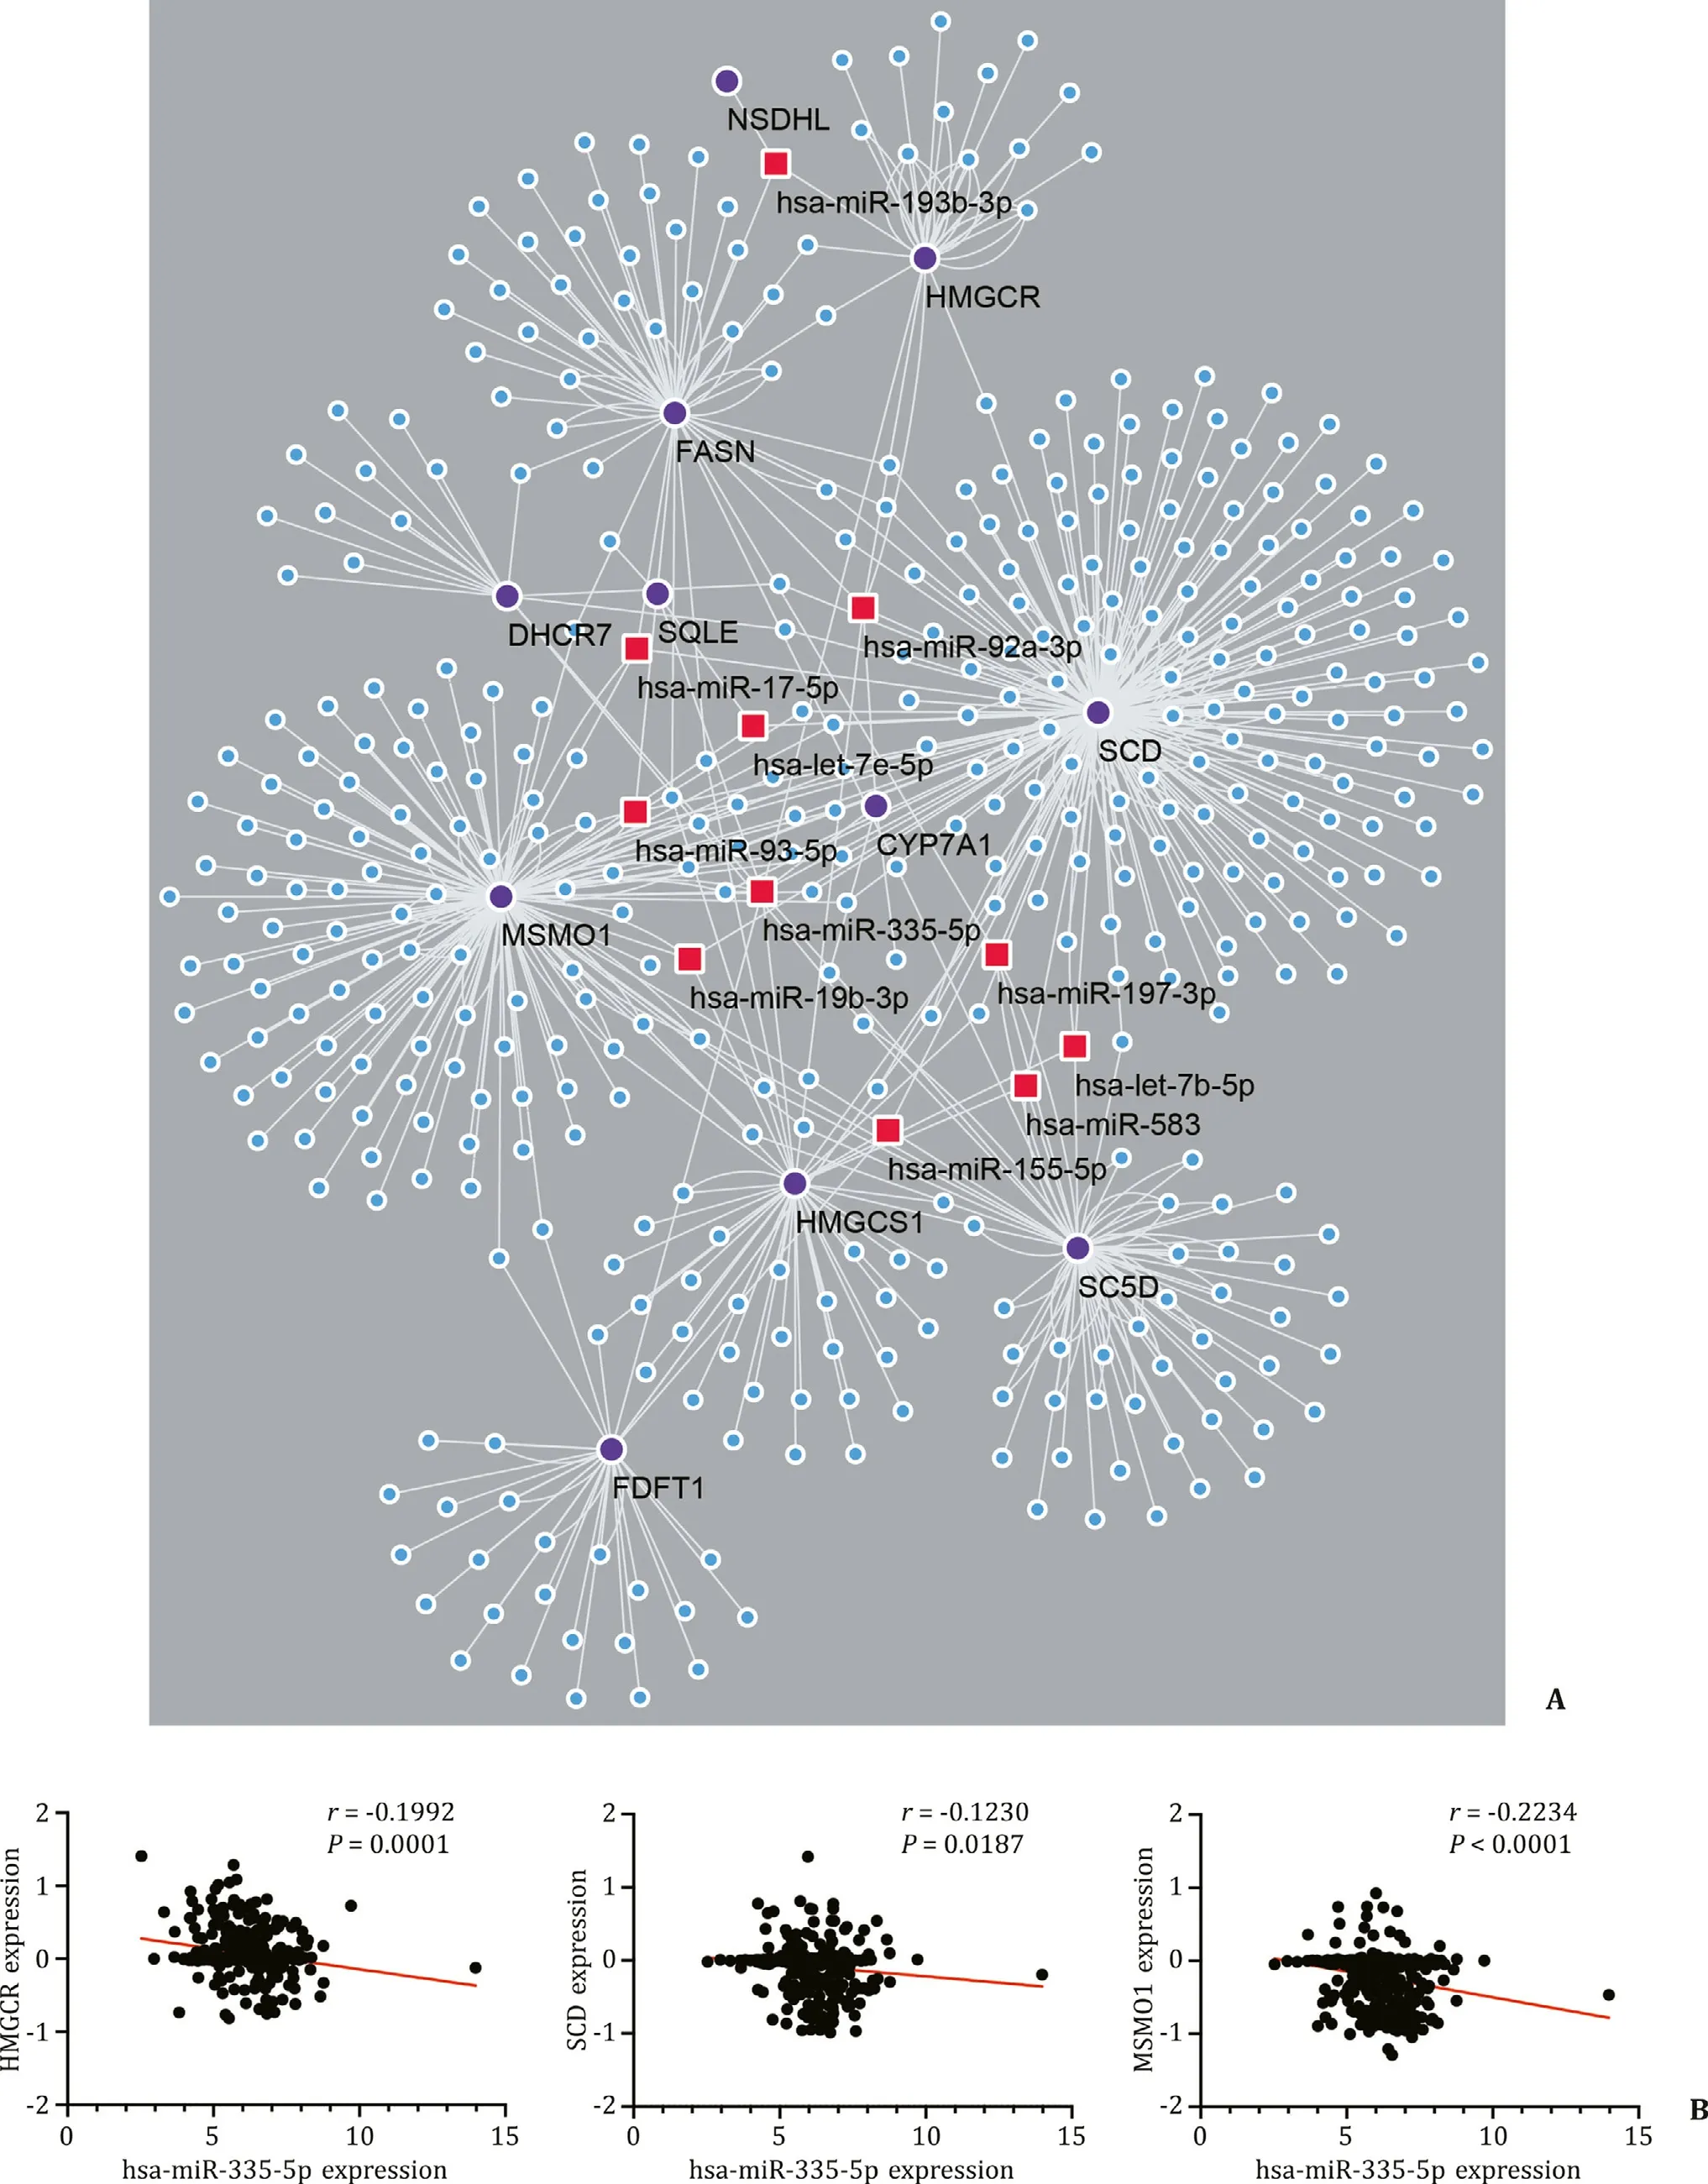
Fig. 7. Identification of key miRNAs related to NASH. A: Constructions of the miRNA-gene network. Purple dots represent hub genes, blue dots and red squares mean miRNAs and red squares are miRNAs that have connections with multiple genes. B: Correlation of hsa-miR-335-5p and HMGCR/SCD/MSMO1 .
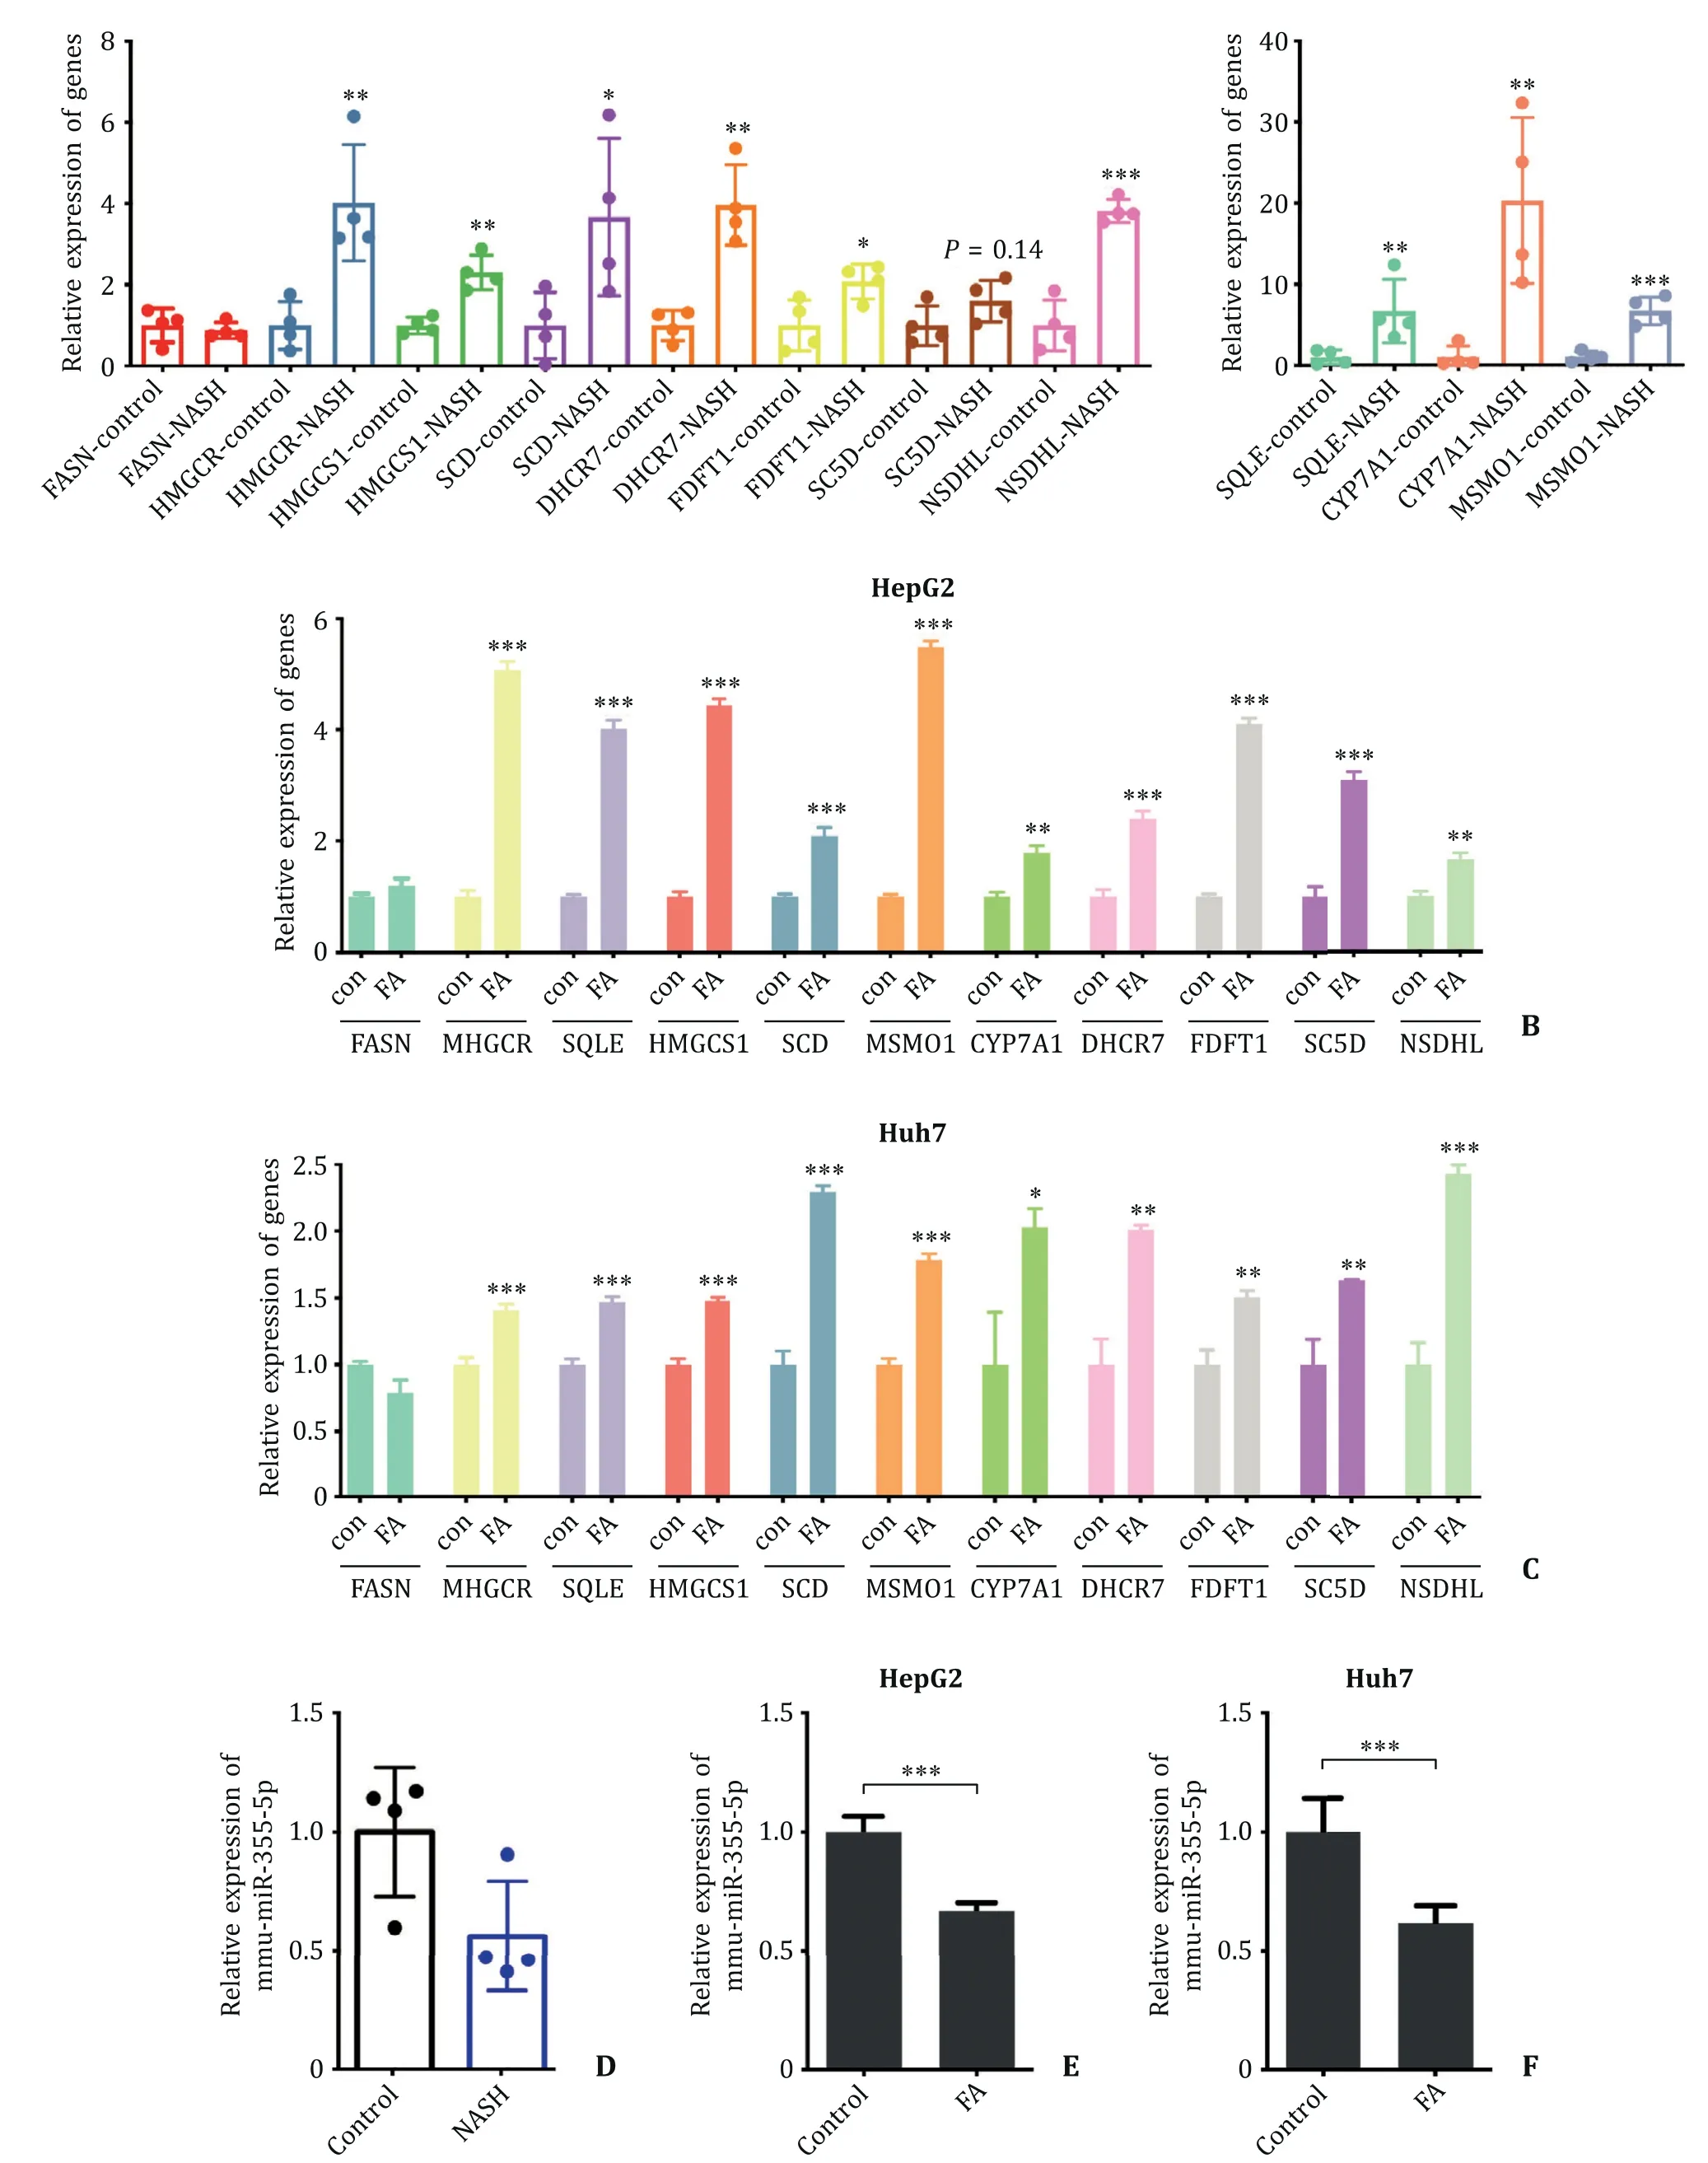
Fig. 8. Expression of hub genes and hsa-miR-335-5p in mouse and cell models. A: Expression of 11 hub genes in NASH mouse models detected by qPCR. B, C: Expression of 11 hub genes in NASH HepG2 and Huh7 cell models detected by qPCR. D: Expression of mmu-miR-335-5p in mouse NASH models detected by qPCR. E, F: Expression of hsa-miR-335-5p in NASH HepG2 and Huh7 cell models detected by qPCR. *P < 0.05, ∗∗P < 0.01, ∗∗∗P < 0.001. The experiments were independently repeated at least three times. con: control; FA: fatty acid.
Through treating Huh7 and HepG2 cell lines by 200μmol/L oleic acid and 100μmol/L palmitic acid, we created steatosis cell models. Then we analyzed the differences between steatosis cells and normal cells, and obtained similar results with mouse models. The predicted genes exceptFA SNwere overexpressed in FA-treated cells, and we did not observe a significant difference inFASNex-pression ( Fig. 8 B, C).
We identified the expression of miR-335-5p in mouse and cell models and observed downregulated expression levels in the high-fat diet group and the FA-treated group. Though the difference was not significant in mouse models, the reason could be due to the number of samples ( Fig. 8 D-F). We speculated that hsa-miR-335-5p and the hub genes were related to NASH.
Verification of the correlation between hsa-miR-335-5p and its targeted genes
We predicted 9 hub genes as target genes of hsa-miR-335-5p and observed correlation in the clinical sample. Next, we focused on experimental validation. After transfection with hsa-miR-335-5p mimic, we found a significant decline in all genes ( Fig. 9 A, B). This result indicated that hsa-miR-335-5p was a potential up-stream regulator of the genes.
The function of hsa-miR-335-5p in lipid metabolism
We aimed to define the role of hsa-miR-335-5p in lipid metabolism. Because the main type of lipid deposited in the liver in NASH patients is triglyceride [20],we detected the level of triglyceride and observed a significant decrease after transfecting with an hsa-miR-335-5p mimic in both cell lines. Oil red O stain-ing also showed similar results with triglyceride assays ( Fig. 9 C, D). We concluded that hsa-miR-335-5p plays an important role in lipid metabolism, and it may inhibit the development of NASH.
Prediction of the potential drug combinations for NASH
We predicted the potential drug combinations by uploading the 94 DE-genes to DPS ( Fig. 10 A). We noticed that two drugs, san-guinarine and pregnenolone, had the highest frequency and could have an ideal treatment effect. DPS also showed the target rela-tionship between the genes and drugs ( Fig. 10 B).
Roles of DE-genes and hsa-miR-335-5p in HCC
Based on bioinformatic analysis and experimental validation, we realized that hsa-miR-335-5p and 11 hub genes were closely related to NASH. Therefore, we aimed to determine whether they were also risk factors of HCC. Using the UALCAN database, we analyzed data from TCGA, and the result was shown in Fig. 11 . hsa-miR-335-5p was downregulated in the HCC group, but we ob-served a decrease without significance; as for 11 hub genes, most of them were upregulated significantly exceptMSMO1andSC5D. We also detected the protein levels through the HPA database ( Fig. 12 A), and we got similar results. In short, the expression of hsa-miR-335-5p and the 11 hub genes in HCC was consistent with their expression in NASH. Intervening abnormal expression of these factors as early as possible may be a therapeutic strategy against NASH and HCC.
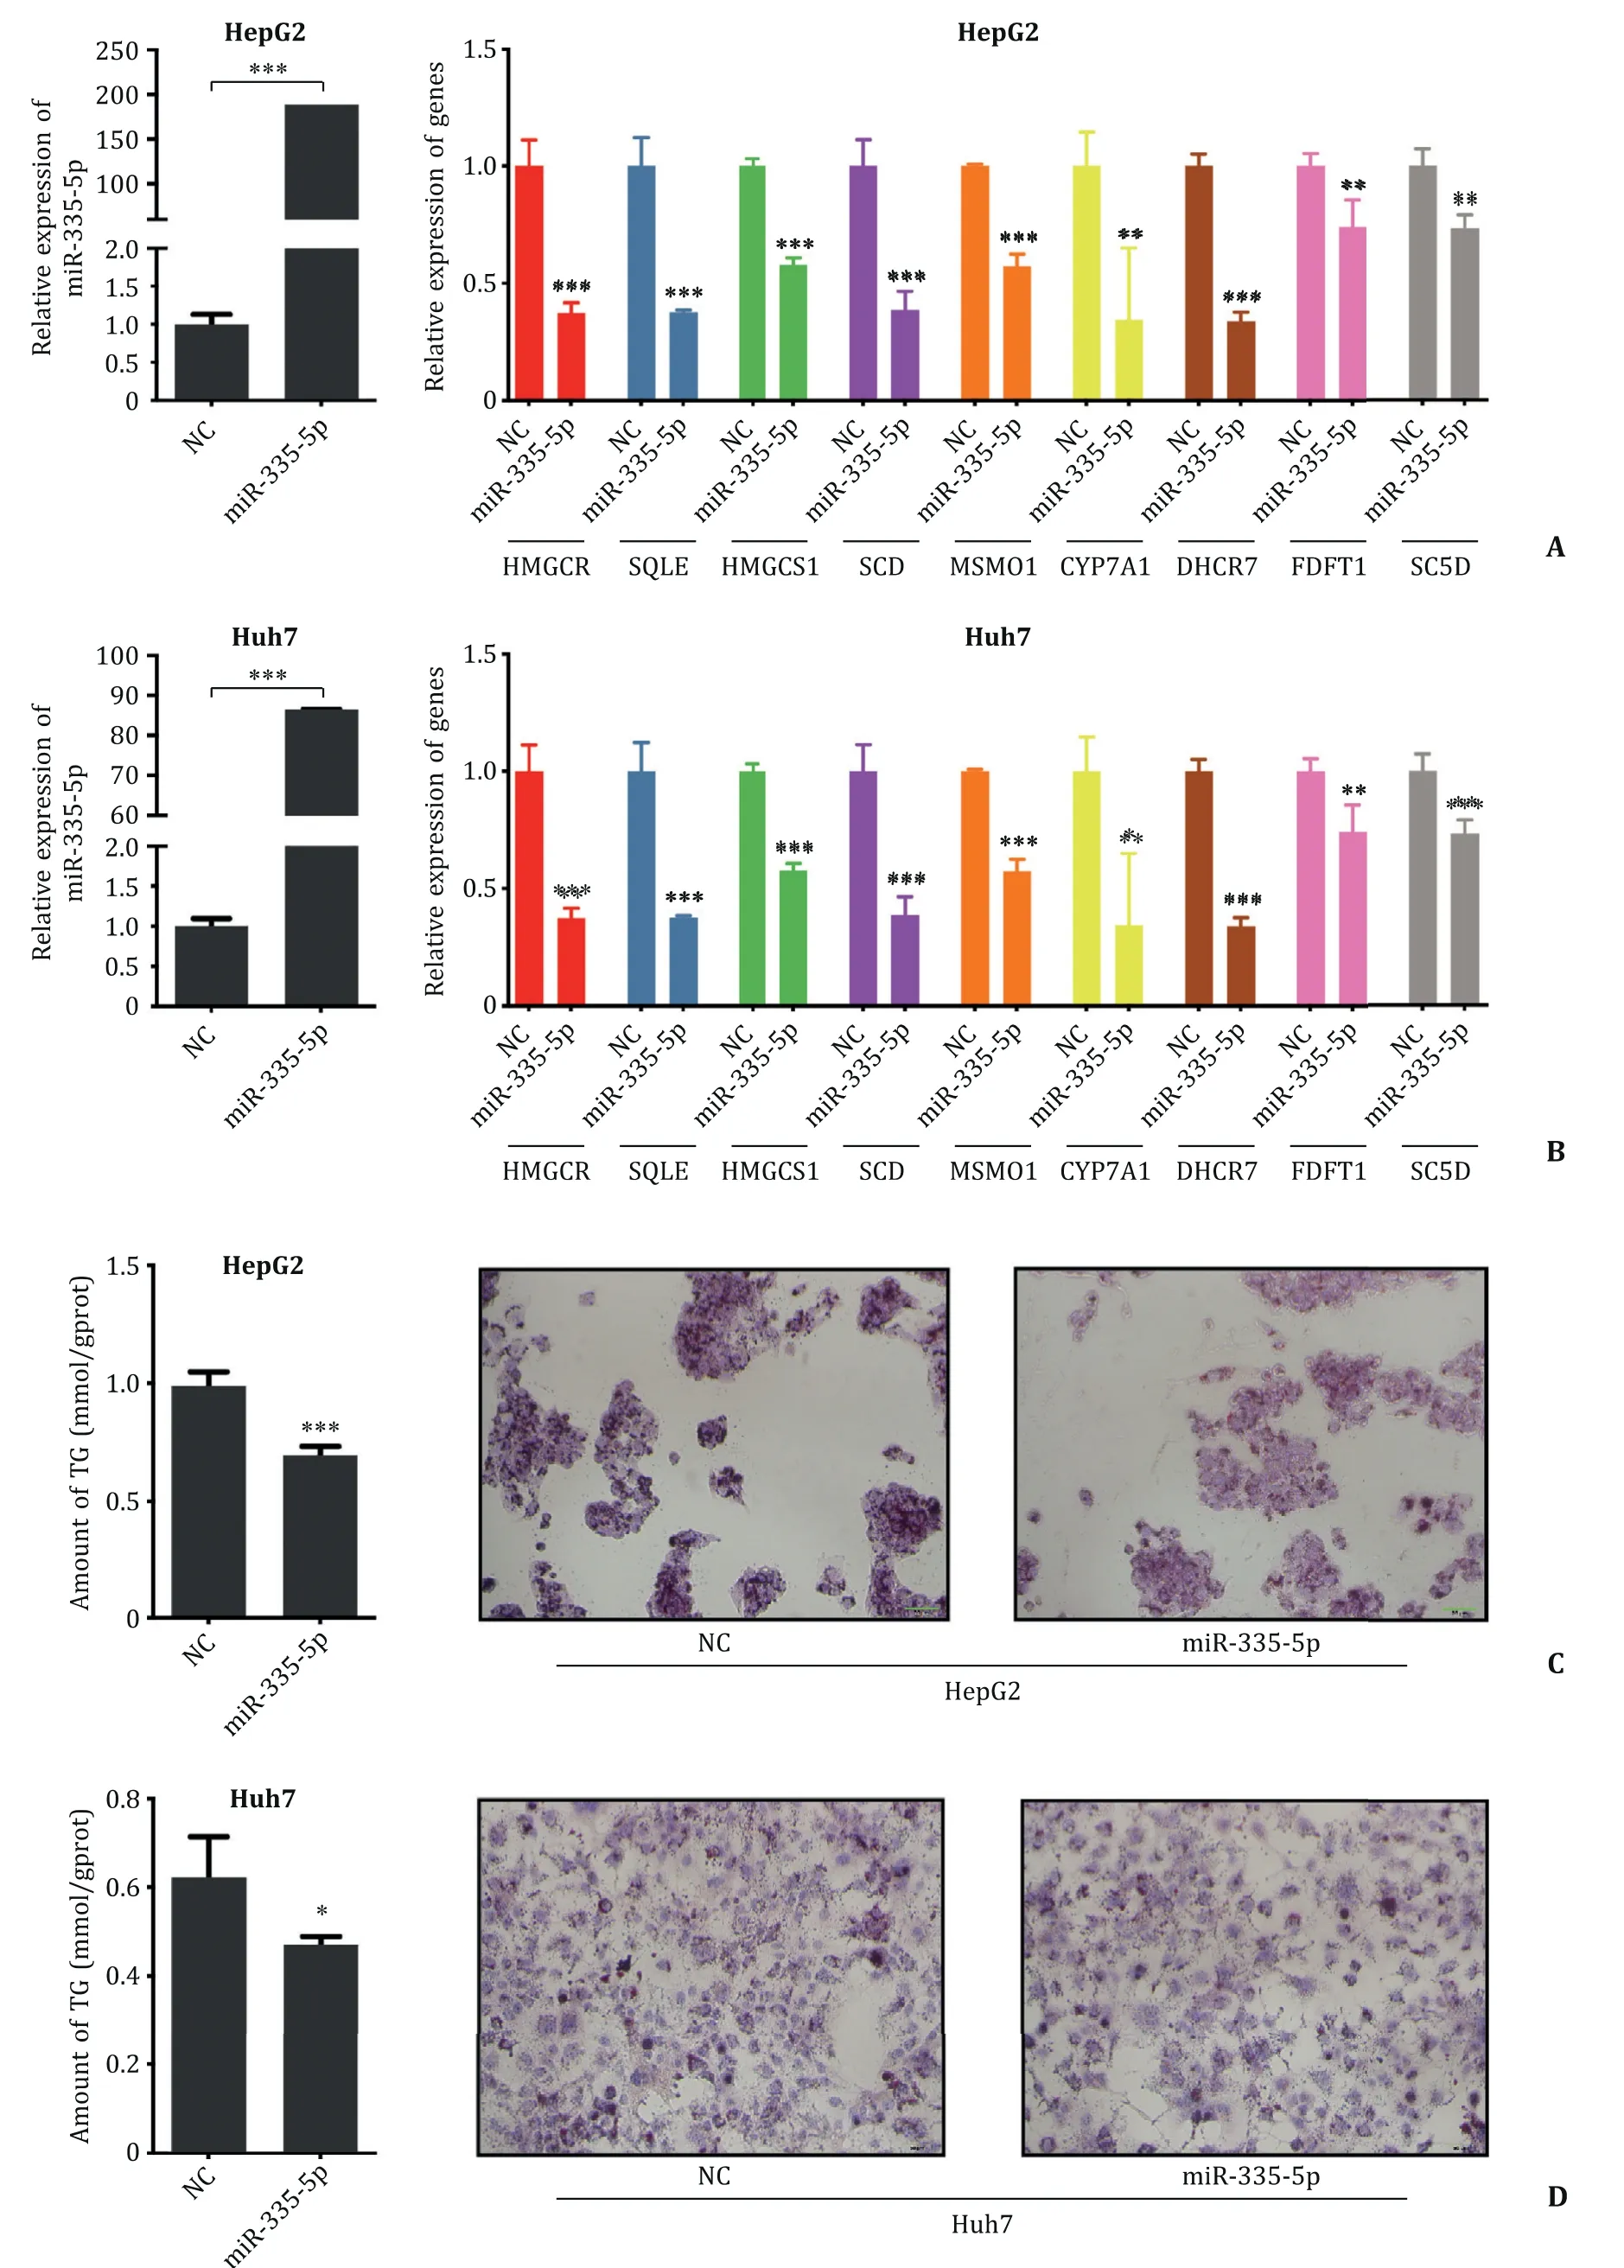
Fig. 9. Verification of the regulatory relationship between hsa-miR-335-5p and its potential targets. A, B: The efficiency of hsa-miR-335-5p mimic, and expression of potential targets after overexpressing hsa-miR-335-5p in HepG2 and Huh7 cell lines. C, D: Triglyceride levels in hsa-miR-335-5p mimic group and the control detected by triglyceride quantification kit and Oil Red O staining in Huh7 and HepG2 cell lines (original magnification ×200). *P < 0.05, ∗∗P < 0.01, ∗∗∗P < 0.001. The experiments were independently repeated at least three times. NC: control; TG: triglyceride.
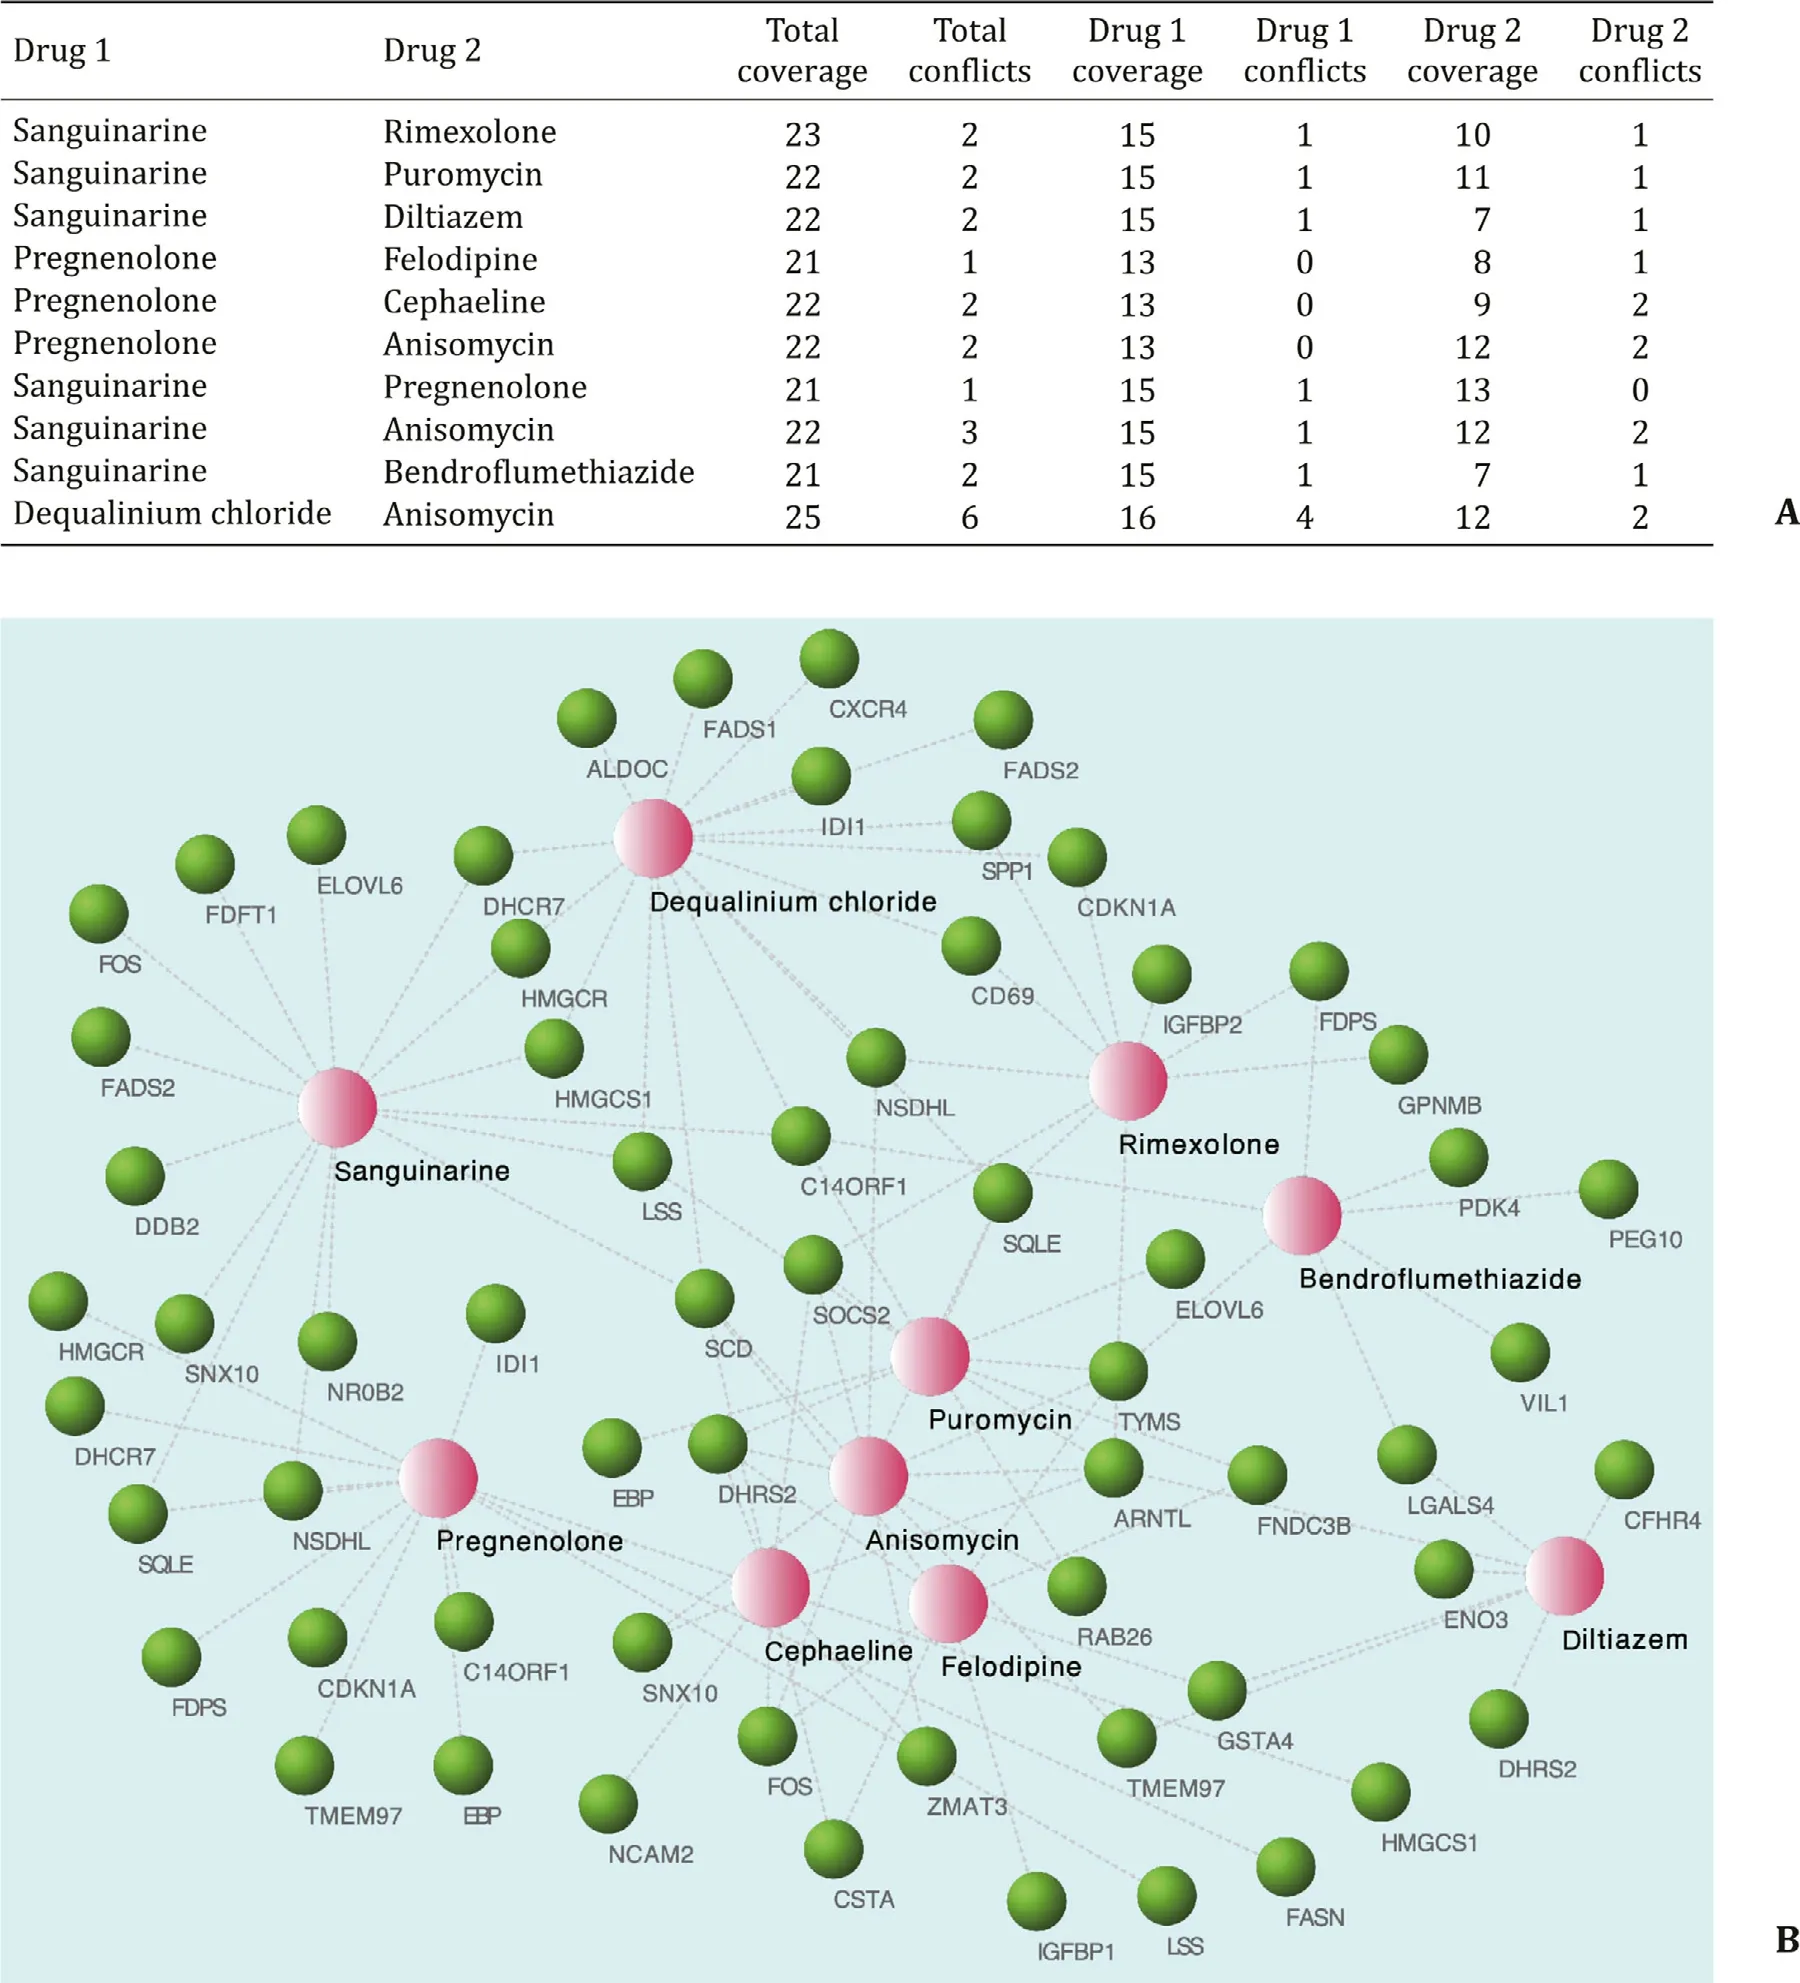
Fig. 10. Prediction of drug combinations for NASH. A: Drug combinations that may play reversal roles predicted by DPS. Coverage is the number of the drug’s favorable targets, conflict is the number of genes that the drug may cause an unfavorable outcome. B: Constructions of the drug-gene network. Pink dots represent drugs, green dots mean genes. NASH: nonalcoholic steatohepatitis; DPS: Drug Pair Seeker.
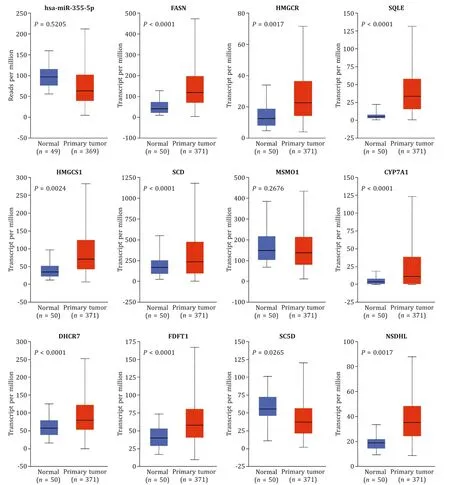
Fig. 11. Expression of hsa-miR-335-5p and hub genes in HCC in TCGA. Expression of hsa-miR-335-5p and hub genes analyzed by UALCAN. HCC: hepatocellular carcinoma.
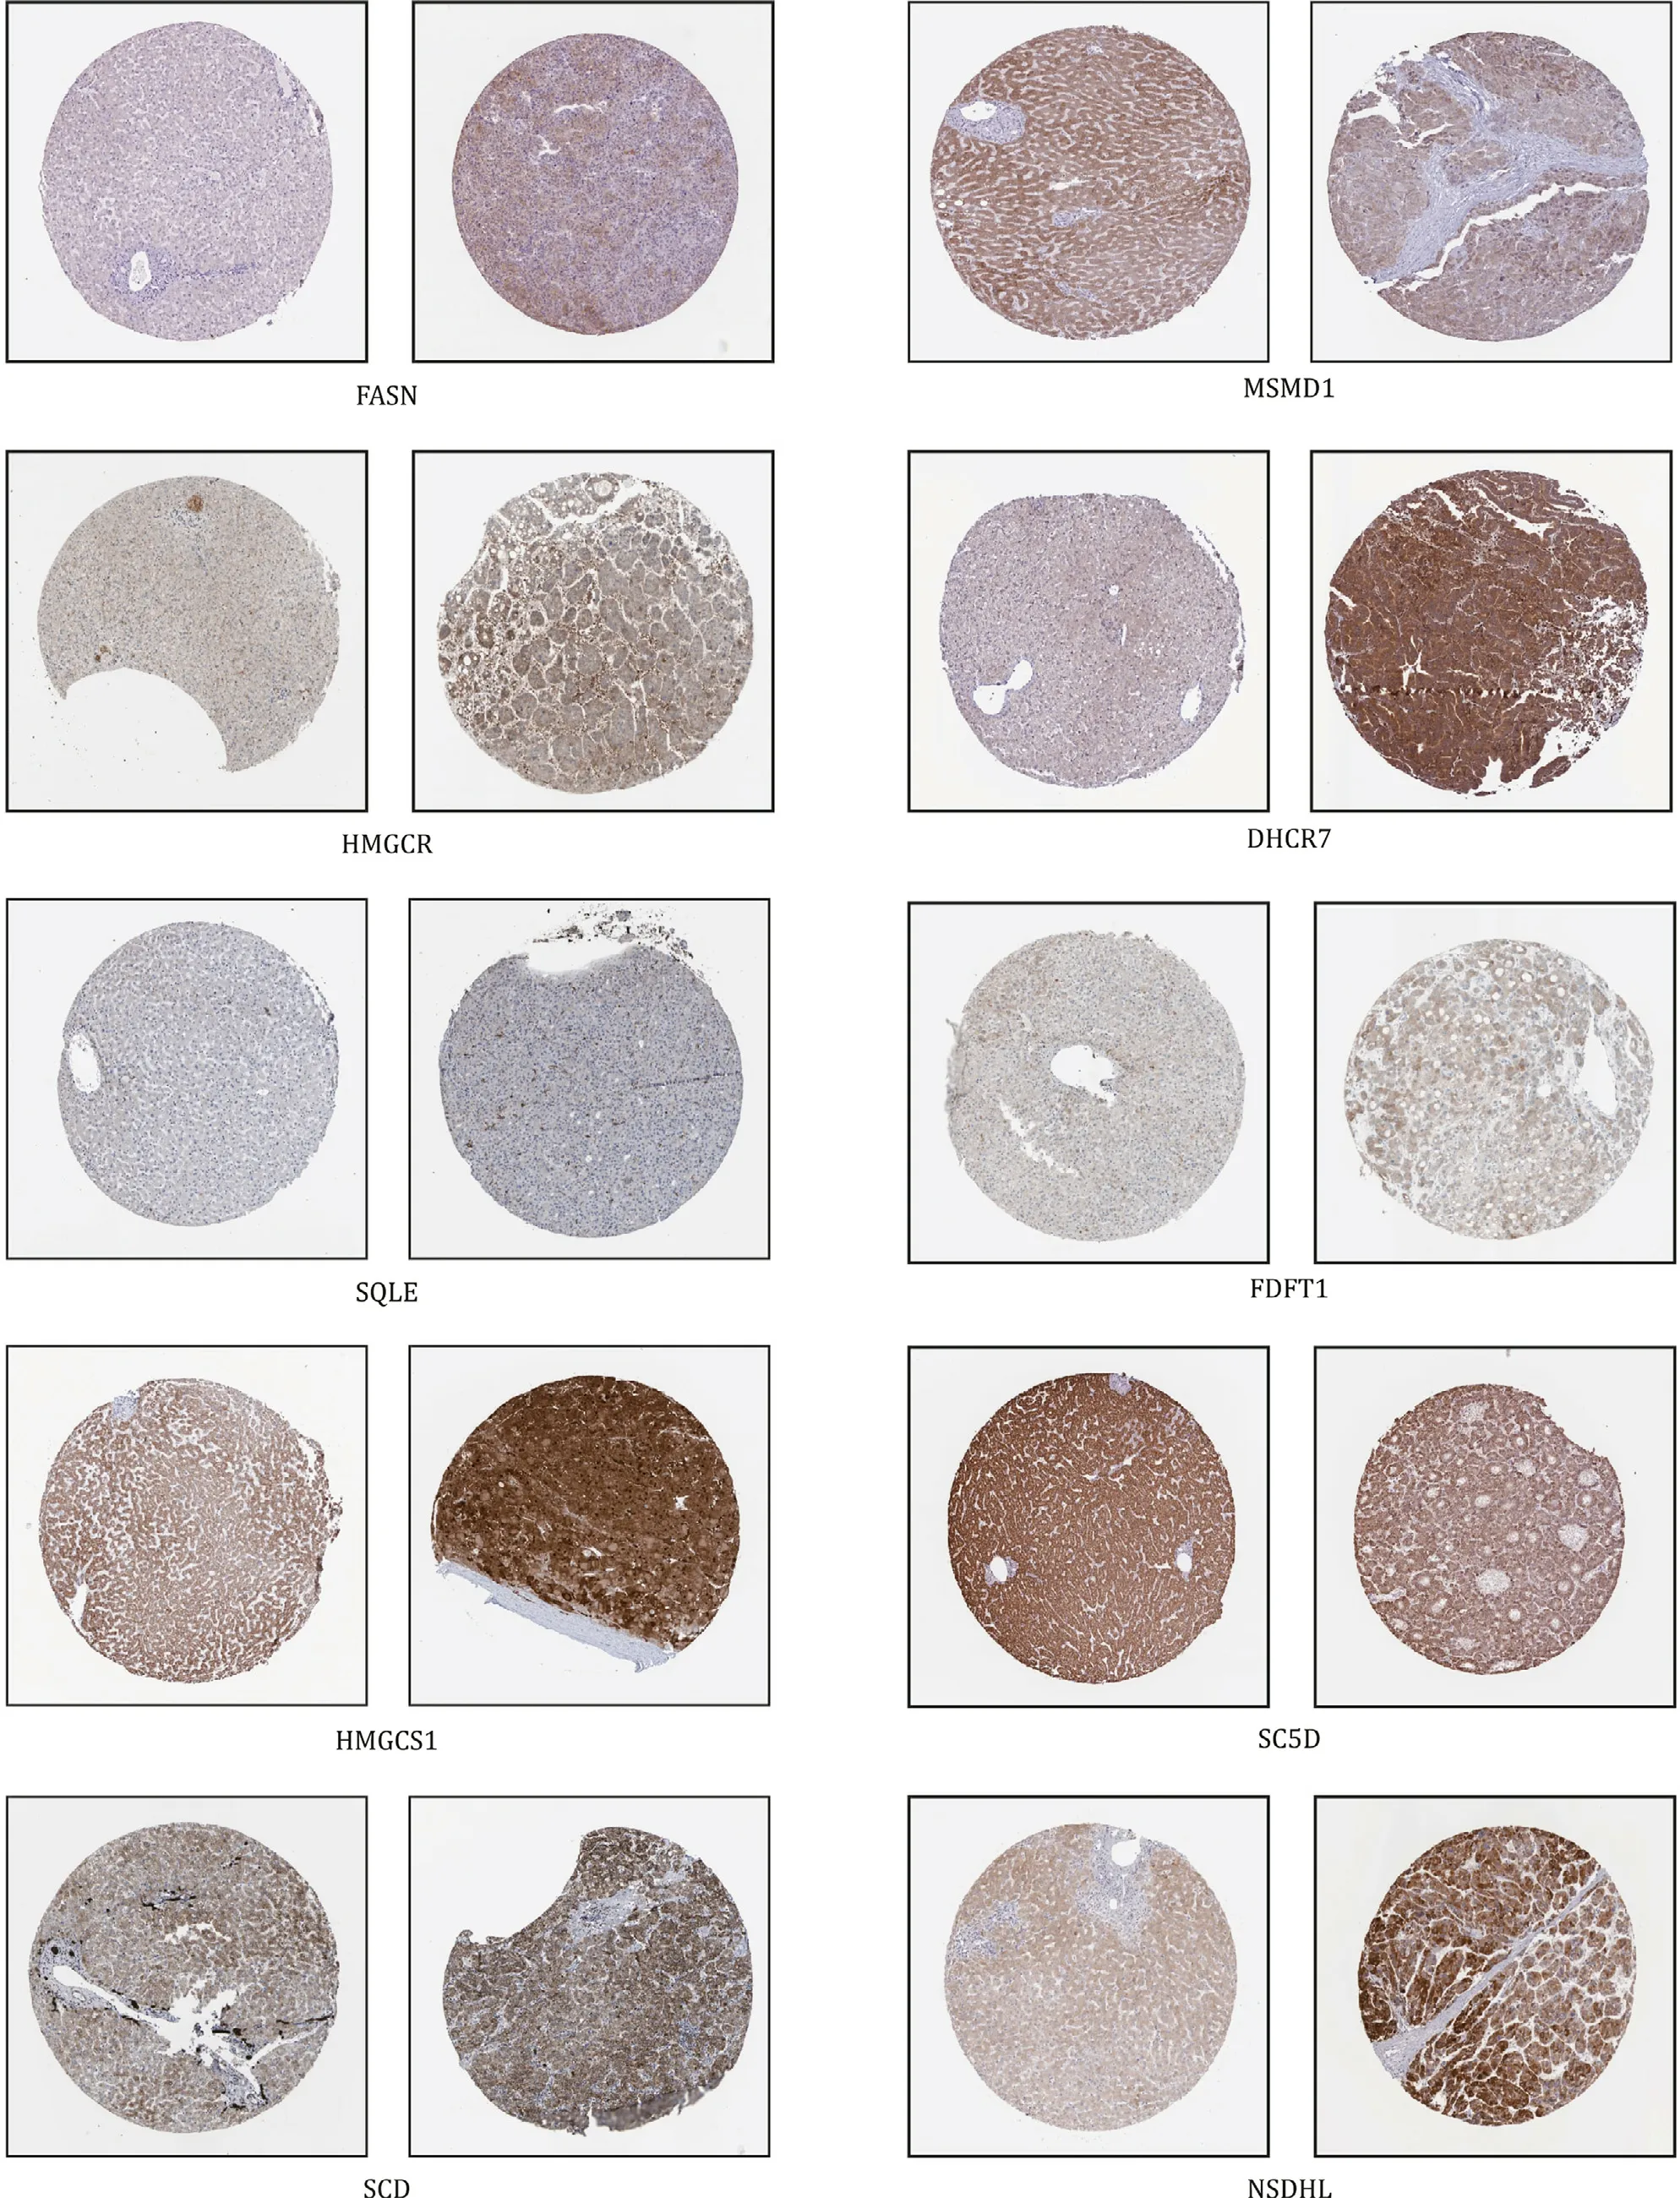
Fig. 12. Expression of hub genes in HCC in HPA (original magnification ×80). Expression of hsa-miR-335-5p and hub genes was analyzed in the HPA database and data of CYP7A1 were unavailable. HCC: hepatocellular carcinoma.
Discussion
The disorder of miRNA/target gene axis has been proved to be related with multiple human diseases including NASH and HCC [21–23] . Previous studies have reported several key miRNAs and genes related with NASH and hence provided the right direc-tions for clinical research.
In this study, we filtered 11 key genes and one key miRNA which may participate in lipid metabolism and the development of NASH. hsa-miR-335-5p (previous ID: hsa-miR-335) is widely dys-regulated in multiple cancers including HCC [24] . Dohi et al. re-ported that hsa-miR-335-5p is reduced because of aberrant DNA methylation in HCC [25] . Overexpression of hsa-miR-335-5p car-ried by exosome may be a novel therapeutic strategy in HCC [26] . The role of hsa-miR-335-5p in lipid metabolism is still unclear. One study showed that it was overexpressed in the liver and adipose tissue of obese mice [27],but another study reported that low cir-culating hsa-miR-335-5p had a significant association with child-hood obesity [28] . The reasons for the divergence of the above two studies may be the differences in the models used, or the overexpression of hsa-miR-335-5p in obese mice may be compen-satory. Another study using a chronic rhinosinusitis mouse model showed that overexpression of hsa-miR-335-5p reduces inflamma-tion [29] which is another major symptom of NASH besides lipid accumulation. There is no detailed study about the relationship be-tween hsa-miR-335-5p and lipid synthesis, and there is no study indicating the direct connection between NASH and hsa-miR-335-5p. This study demonstrated that, hsa-miR-335-5p was downregu-lated in NASH cell and mouse models, and overexpression of hsa-miR-335-5p reduced the level of triglyceride in hepatocytes which might help reverse symptoms of NASH and HCC. Further research should be conducted to determine the expression of hsa-miR-335-5p in NASH patients. Knockout cell and mouse models should be employed to further clarify the function of hsa-miR-335-5p in lipid metabolism. Besides, transgenic mouse models should be used to explore the role of hsa-miR-335-5p in the development of NASH and HCC.
Our study also identified 11 hub genes that may be related with NASH. These genes (exceptFASN) are upregulated in NASH models.FASNis a widely accepted lipid synthesis-related gene. However, in this study, exogenous FA did not change the ex-pression ofFASN.SCDis responsible for the transformation from saturated FAs to monounsaturated FAs [30] . Inhibitors targetingSCDattenuates hepatic lipid accumulation in NASH model [31] . HMGCR and SQLE are enzymes involved in cholesterol metabolism, and their abnormal expressions lead to lipid accumulation and NASH [ 32,33 ]. HMGCS1, MSMO1, NSDHL, DHCR7, FDFT1, and SC5D are also responsible for cholesterol synthesis and their abnormal expressions have a significant impact on lipid metabolism but there are no evidence showing the direct connections with NASH or HCC [34–38] . CYP7A1 is an enzyme for bile acid synthesis, and hence it is an enzyme involved in cholesterol degradation. Erickson et al. found that theCYP7A1gene knockout mouse showed hyper-cholesterolemic [39] . Our result showed thatCYP7A1was upregu-lated in NASH mouse and cell models, and this seems contradic-tory to the previous study [39] . However, another study showed that treatment with cholesterol can upregulate the expression ofCYP7A1. Therefore, the high expression ofCYP7A1might be com-pensatory [40] . However, there is no study about the relationship betweenCYP7A1and NASH. Further research should be conducted to determine the role ofCYP7A1in NASH.
NASH is one of the important causes of HCC, and our study showed the potential of these genes in the treatment for HCC. Previous studies have identified that high expressions ofFASN,HMGCR,HMGCS1,SQLE,andCYP7A1are closely related to HCC [ 38,41–46 ]. Our research also revealed the potential reg-ulatory relationship between hsa-miR-335-5p and the 9 genes. Gao et al. reported that hsa-miR-335-5p reduces inflammatory re-sponses in sepsis by targetingFASN[47] . There is no study about the connections between hsa-miR-335-5p and other 8 genes. The current study did not find the role of hsa-miR-335-5p in HCC. We speculated that these genes may play important roles in NASH and NASH-related HCC but not in other etiologies-related HCC.
Based on the predicted hub genes, we explored the potential drug combinations targeting NASH. We found that sanguinarine and pregnenolone had the greatest potential. Sanguinarine, a natu-ral product, has various pharmacological properties. Previous stud-ies found that sanguinarine inhibits lipid accumulation, inflamma-tion, and development of cancer [48–50],but there is no evidence on sanguinarine and NASH. Pregnenolone is a type of steroid which is a derivative cholesterol. Using hormone restorative therapy to supplement steroids has been proven as an effective strategy for treating hypercholesterolemia [ 51,52 ]. There is no study about the effect of pregnenolone on NASH. Our study showed the potential of these drug combinations and provided directions for further re-search.
Our study about the roles and the mechanism of hsa-miR-335-5p and hub genes in lipid metabolism, lipid synthesis, and in-flammation is still preliminary. We found many factors influenc-ing cholesterol production. Because cholesterol is not detectable in cells, we did not verify the level of cholesterol in our current models.
In conclusion, our study identified NASH-related genes and miRNAs through bioinformatic analysis and experimental valida-tion. The genes are also likely to participate in the development of HCC. As such targeting these miRNAs and mRNAs through potential drug combinations may be novel strategies against NASH.
Acknowledgments
We thank for the technical support by the Core Facilities, Zhe-jiang University School of Medicine.
CRediT authorship contribution statement
Guang-Han Fan:Conceptualization, Data curation, Formal anal-ysis, Visualization, Writing -original draft.Rong-Li Wei:Data cu-ration, Resources, Writing -original draft.Xu-Yong Wei:Formal analysis, Funding acquisition, Validation.Chen-Zhi Zhang:Investi-gation, Validation.Zhe-Tuo Qi:Validation, Visualization.Hai-Yang Xie:Supervision, Writing -review & editing.Shu-Sen Zheng:Su-pervision, Writing -review & editing.Xiao Xu:Conceptualization, Funding acquisition, Supervision, Writing -review & editing.
Funding
This study was supported by grants from Key Program, National Natural Science Foundation of China ( 81930016 ), National Natural Science Foundation of China ( 81702858 ), Key Research & Develop-ment Plan of Zhejiang Province ( 2019C03050 ), National S&T Major Project ( 2017ZX10203205 ) and National Natural Science Funds for Distinguished Young Scholar of China ( 81625003 ).
Ethical approval
The study was approved by the Institutional Animal Care and Use Committee and the Ethics Committee of Zhejiang University.
Competing interest
No benefits in any form have been received or will be received from a commercial party related directly or indirectly to the sub-ject of this article.
Supplementary materials
Supplementary material associated with this article can be found, in the online version, at doi:10.1016/j.hbpd.2021.06.001 .
杂志排行

Hepatobiliary & Pancreatic Diseases International的其它文章
- Comparison and development of advanced machine learning tools to predict nonalcoholic fatty liver disease: An extended study
- Hepatobiliary&Pancreatic Diseases International
- Influence of weight management on the prognosis of steatohepatitis in chronic hepatitis B patients during antiviral treatment
- LC-MS-based lipidomic analysis in distinguishing patients with nonalcoholic steatohepatitis from nonalcoholic fatty liver
- Cryptococcosis in patients with liver cirrhosis: Death risk factors and predictive value of prognostic models
- Gene knockout or inhibition of macrophage migration inhibitory factor alleviates lipopolysaccharide-induced liver injury via inhibiting inflammatory response