Comparison and development of advanced machine learning tools to predict nonalcoholic fatty liver disease: An extended study
2021-11-08YunXingLiuXiLiuChoCenXinLiJiMinLiuZhoYnMingSongFengYuXioFengTngLinZhouJunYuKeJieHungShuSenZheng
Yun-Xing Liu ,Xi Liu ,Cho Cen ,Xin Li ,Ji-Min Liu ,Zho-Yn Ming ,Song-Feng Yu ,Xio-Feng Tng ,Lin Zhou ,Jun Yu ,Ke-Jie Hung ,Shu-Sen Zheng ,
a Department of Hepatobiliary and Pancreatic Surgery, the First Affiliated Hospital, Zhejiang University School of Medicine, Hangzhou 310 0 03, China
b College of Information Science and Electrical Engineering, Zhejiang University, Hangzhou 310 0 27, China
c Department of Pathology and Molecular Medicine, Faculty of Health Sciences, McMaster University, 120 0 Main Street West, Hamilton L8S 4K1, Canada
d College of Computer Science and Tech nology, Zhejiang University, Hangzhou 310027, China
Keywords: Nonalcoholic fatty liver disease Machine learning Population screening Prediction model Body mass index
ABSTRACT Background: Nonalcoholic fatty liver disease (NAFLD) is a public health challenge and significant cause of morbidity and mortality worldwide. Early identification is crucial for disease intervention. We recently proposed a nomogram-based NAFLD prediction model from a large population cohort. We aimed to ex-plore machine learning tools in predicting NAFLD. Methods: A retrospective cross-sectional study was performed on 15 315 Chinese subjects (10 373 train-ing and 4942 testing sets). Selected clinical and biochemical factors were evaluated by different types of machine learning algorithms to develop and validate seven predictive models. Nine evaluation indicators including area under the receiver operating characteristic curve (AUROC), area under the precision-recall curve (AUPRC), accuracy, positive predictive value, sensitivity, F1 score, Matthews correlation coefficient (MCC), specificity and negative prognostic value were applied to compare the performance among the models. The selected clinical and biochemical factors were ranked according to the importance in predic-tion ability. Results: Totally 4018/10 373 (38.74%) and 1860/4942 (37.64%) subjects had ultrasound-proven NAFLD in the training and testing sets, respectively. Seven machine learning based models were developed and demonstrated good performance in predicting NAFLD. Among these models, the XGBoost model revealed the highest AUROC (0.873), AUPRC (0.810), accuracy (0.795), positive predictive value (0.806), F1 score (0.695), MCC (0.557), specificity (0.909), demonstrating the best prediction ability among the built mod-els. Body mass index was the most valuable indicator to predict NAFLD according to the feature ranking scores. Conclusions: The XGBoost model has the best overall prediction ability for diagnosing NAFLD. The novel machine learning tools provide considerable beneficial potential in NAFLD screening.
Introduction
Nonalcoholic fatty liver disease (NAFLD) is now considered the hepatic manifestation of metabolic syndrome. The dramatically ris-ing prevalence of NAFLD has brought significant healthcare and economic burdens worldwide. NAFLD encompasses a spectrum of disease, which ranges from nonalcoholic fatty liver (NAFL) to non-alcoholic steatohepatitis (NASH), cirrhosis and even hepatocellular carcinoma [1] . It is critical to identify patients in high risk of de-veloping NAFLD for early medical interventions. Liver biopsy re-mains the golden standard for the diagnosis of NAFLD. However, it is considered impractical for its invasive nature and high cost as a screening tool.
Over the past decade, some non-invasive biomarkers of NAFLD have been developed and validated to differentiate NAFLD from normal population or to differentiate sim ple steatosis from NASH. Of these biomarkers, the fatty liver index is commonly applied with relatively good performance in predicting NAFLD in differ-ent populations [ 2,3 ], but still has its limitation. The NAFLD fi-brosis score and the fibrosis-4 index are useful screening tools for advanced fibrosis with relatively low cost. Other markers such as the enhanced liver fibrosis test, the FibroTest and the FibroMeter have higher diagnostic accuracy for advanced fibrosis but with high cost [4] . Recently, we conducted a retrospective cross-sectional study on a large population and developed a nomogram-based NAFLD prediction tool [5] . That model was composed of six clinical and biochemical parameters, including body mass index (BMI), di-astolic blood pressure (DBP), uric acid, fasting blood glucose (FBG), triglyceride and alanine aminotransferase (ALT) based on logistic regression analysis. It was an easy model which can be used as a screening tool in the office or hospital settings. Logistic regression analysis is a traditional statistical model to identify certain patterns in large-scale data. However, it has its limitations,i.e. the logistic regression model performs poorly when dealing with a large num-ber of high-dimensional features or variables. Compared with the traditional statistical model, which formalizes the relationships be-tween variables in the form of mathematical equations, machine learning takes full consideration of the interactions among the data and updates models by its own training, generalization, self-organization and learning ability [6] . Thus, the machine learning might optimize the prediction ability of a pre-treatment model, re-sulting in making more efficient and reasonable decisions. To con-tinue our previous study, we applied the advanced machine learn-ing to establish NAFLD prediction models [5] .
Methods
Subjects
The study population was recruited from adults (18–75 years old) who had annual physical examinations at the International Health Care Center, the First Affiliated Hospital, Zhejiang Univer-sity School of Medicine during the year 2014, as described pre-viously [5] . The enrollment was limited to participants who had complete records of anthropometric, biochemical data, as well as results of hepatic ultrasonography. A total of 15 315 subjects were included in the study. The personal information of each partici-pant was de-identified at collection, prior to analysis. The study was approved by the Ethics Committee of the First Affiliated Hos-pital, Zhejiang University School of Medicine.
Diagnosis of N AFLD
The diagnosis of NAFLD requires the presence of significant hepatic steatosis confirmed by imaging or histological examination, in the absence of other causes for fatty liver diseases, especially excluding overconsumption of alcohol (>210 g/week in men and>140 g/week in women), according to the criteria described by the Chinese Liver Disease Association [7] . In this study, hepatic ul-trasonography examinations were performed by experienced radi-ologists who were unaware of the clinical and laboratory data.
Model construction and validation
The dataset was randomly divided into a training set of 10 373 participants and a testing set of 4942 participants in a ratio of 7:3, as described previously [5],and then 1153 (1153/10 373) subjects were randomly selected from the training set (1/9 of the train-ing set), forming the validation set of the developed models while training.
All clinical and biochemical data from the 10 373 participants in the training set were used to build seven models to predict NAFLD, including an extreme gradient boosting (XGBoost) model, a logis-tic regression classifier, a support vector machine (SVM) model, a stochastic gradient descent (SGD) classifier, a multilayer perceptron (MLP) model, a convolutional neural network (CNN) and a long short-term memory (LSTM) model. Similar data from 4942 partici-pants in the testing set were collected to validate and confirm the performance of the seven built models.
XGBoost is an integrated learning algorithm based on gradient boosting, which aims to achieve better classification performance through iterative computations of weak classifiers. In addition, the network structure of XGBoost makes it process high-level sparse features more efficiently, costing less time for training model and predicting results. XGBoost has been widely used in risk analy-sis, recommender systems and other areas. The logistic regression model mainly forms a multiple regression relationship between a dependent variable and multi-independent variables, in order to predict the probability of an event. The mechanism of the SVM is to find an optimal classification hyperplane to improve classifica-tion accuracy and maximize the blank areas on both sides of the hyperplane at the same time. Besides, the SVM can also be used to solve nonlinear problems after introducing the kernel method. The SGD classifier is an estimator which uses SGD learning to op-timize regularized linear models. The MLP, the CNN and the LSTM all belong to the category of deep learning. Among all, the MLP is one of the simplest and most common neural network structures, including input layer, hidden layer and output layer parts. The con-volutional layer and the pooling layer of the CNN make it expert in extracting high-dimensional features. In addition, the parame-ter sharing mechanism of the CNN greatly reduces the number of network parameters. Compared with the CNN, the LSTM has bet-ter performance on representing and learning timing information in time series.
Performance metrics
Nine evaluation indicators including the area under the re-ceiver operating characteristic curve (AUROC), the area under the precision-recall curve (AUPRC), accuracy, positive predictive value (PPV), sensitivity, F1 score, Matthews correlation coefficient (MCC), specificity and negative predictive value (NPV) were evaluated to compare the performance of the seven models. The AUROC is a popular and strong metric in evaluating binary classifiers, while the AUPRC is more suitable for unbalanced data [ 8,9 ].
Features ranking score rules
Feature ranking evaluation refers to a measurement to assess the importance of each feature in the feature set through the impact on the final classification result. The feature average gain method is one of the most commonly used methods when apply-ing the XGBoost model. It was adopted in the current study, which represented the average gain of all weak decision trees when the feature was split.
Statistical analysis
In our experiment, the XGBoost, the SVM, the SGD classifier and the logistic regression model were built by the python scikit-learn library while the MLP, the CNN and the LSTM models were imple-mented using the Tensorflow. In XGBoost model, we used the early stopping method to avoid overfitting. The MLP model contained one input layer, two hidden layers and one output layer, while the CNN model had two convolutional layers and two pooling layers. In the LSTM model, the number of hidden states was defined as 35. It is worth noting that we also used the dropout layer to pre-vent overfitting.
Continuous variables were expressed as mean ±standard devi-ation or median [interquartile range (IQR)], while categorical val-ues were expressed using frequencies and proportions. The Stu-dent’sttest or Mann-WhitneyUtest was used for comparisons of continuous data, while the Chi-square test was used for compar-isons of categorical variables. All statistical analysis was performed on R software (version 3.4.1). For all analyses, aP<0.05 was con-sidered statistically significant.
Results
Clinical characteristics of the participants
In the training set, 10 373 participants were enrolled and 4018 (38.74%) were diagnosed with NAFLD by ultrasound examina-tion. In the testing set, 4942 participants were enrolled and 1860 (37.64%) were diagnosed with NAFLD. There were significant differ-ences between the subjects with and without NAFLD in sex, age, BMI, waist circumference (WC) in both training and testing sets (P<0.001). In addition, with respect to the biochemical param-eters, uric acid, FBG, triglyceride, and ALT were significantly dif-ferent between the subjects with and without NAFLD in both sets. Other clinical and biochemical parameters with significant differ-ence between NAFLD and without NAFLD were shown in Tables 1 and S1. There were no significant differences in any basic charac-teristics between the two sets (Table S2). Continuous variables of the two sets were presented as violin plots ( Fig. 1 ).
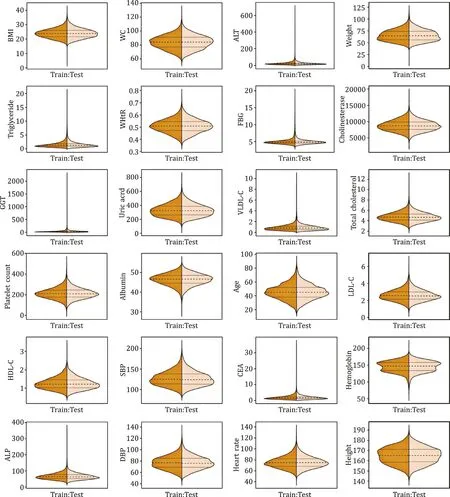
Fig. 1. The distribution of continuous variables in the training and testing groups. BMI: body mass index; WC: waist circumference; ALT: alanine aminotransferase; WHtR: waist-to-height ratio; FBG: fasting blood glucose; GGT: gamma-glutamyl transpeptidase; VLDL-C: very-low-density lipoprotein cholesterol; LDL-C: low-density lipoprotein cholesterol; HDL-C: high-density lipoprotein cholesterol; SBP: systolic blood pressure; CEA: carcinoembryonic antigen; ALP: alkaline phosphatase; DBP: diastolic blood pres-sure.
Comparison of seven prediction models in the training set
A total of seven models were established in this study. Each model was evaluated by AUROC, AUPRC, accuracy, PPV, sensitiv-ity, F1 score, MCC, specificity and NPV and depicted in Table 2 . All models had above 0.8 AUROC values, and only the XGBoost model had a higher value, above 0.9. The AUPRC values were all above 0.8 except the SGD and the LSTM models. With respect to the accu-racy and the PPV, the XGBoost model demonstrated a significantly higher value while the SGD model obtained a significantly lower value. The seven built models had comparable sensitivity values, F1 scores and NPV. Among all the models, the XGBoost model had the highest AUROC value (0.926), AUPRC value (0.897), accuracy (0.846), PPV (0.891), F1 score (0.768), MCC (0.670), and specificity (0.950). The results suggested that the XGBoost model had the best performance in the training set ( Fig. 2 ). Therefore, this model was applied to analyze the importance and the features ranking scores intuitively to reflect the ranking of each variable ( Fig. 3 ). The re-sults showed that BMI was the most valuable indicator to predict NAFLD.
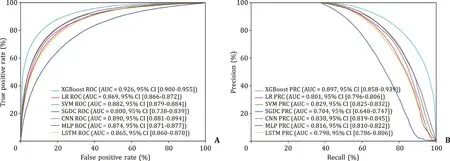
Fig. 2. Evaluation of the predictive models. A: AUROC curves of the seven models in the training set; B: AUPRC curves of the seven models in the training set. XGBoost: extreme gradient boosting; LR: logistic regression; SVM: support vector machine; SGD: stochastic gradient descent; MLP: multilayer perceptron; CNN: convolutional neural network; LSTM: long short-term memory; AUROC: area under the receiver operating characteristic curve; AUPRC: area under the precision-recall curve.

Fig. 3. Analysis of the importance of each variable. The histogram describes the relative importance of each variable in the XGBoost model. BMI: body mass index; WC: waist circumference; WHtR: waist-to-height ratio; ALT: alanine aminotrans-ferase; FBG: fasting blood glucose; GGT: gamma-glutamyl transpeptidase; VLDL-C: very-low-density lipoprotein cholesterol; LDL-C: low-density lipoprotein choles-terol; HDL-C: high-density lipoprotein cholesterol; SBP: systolic blood pressure; ALP: alkaline phosphatase; DBP: diastolic blood pressure.

Table 1 Clinical features of the training set.
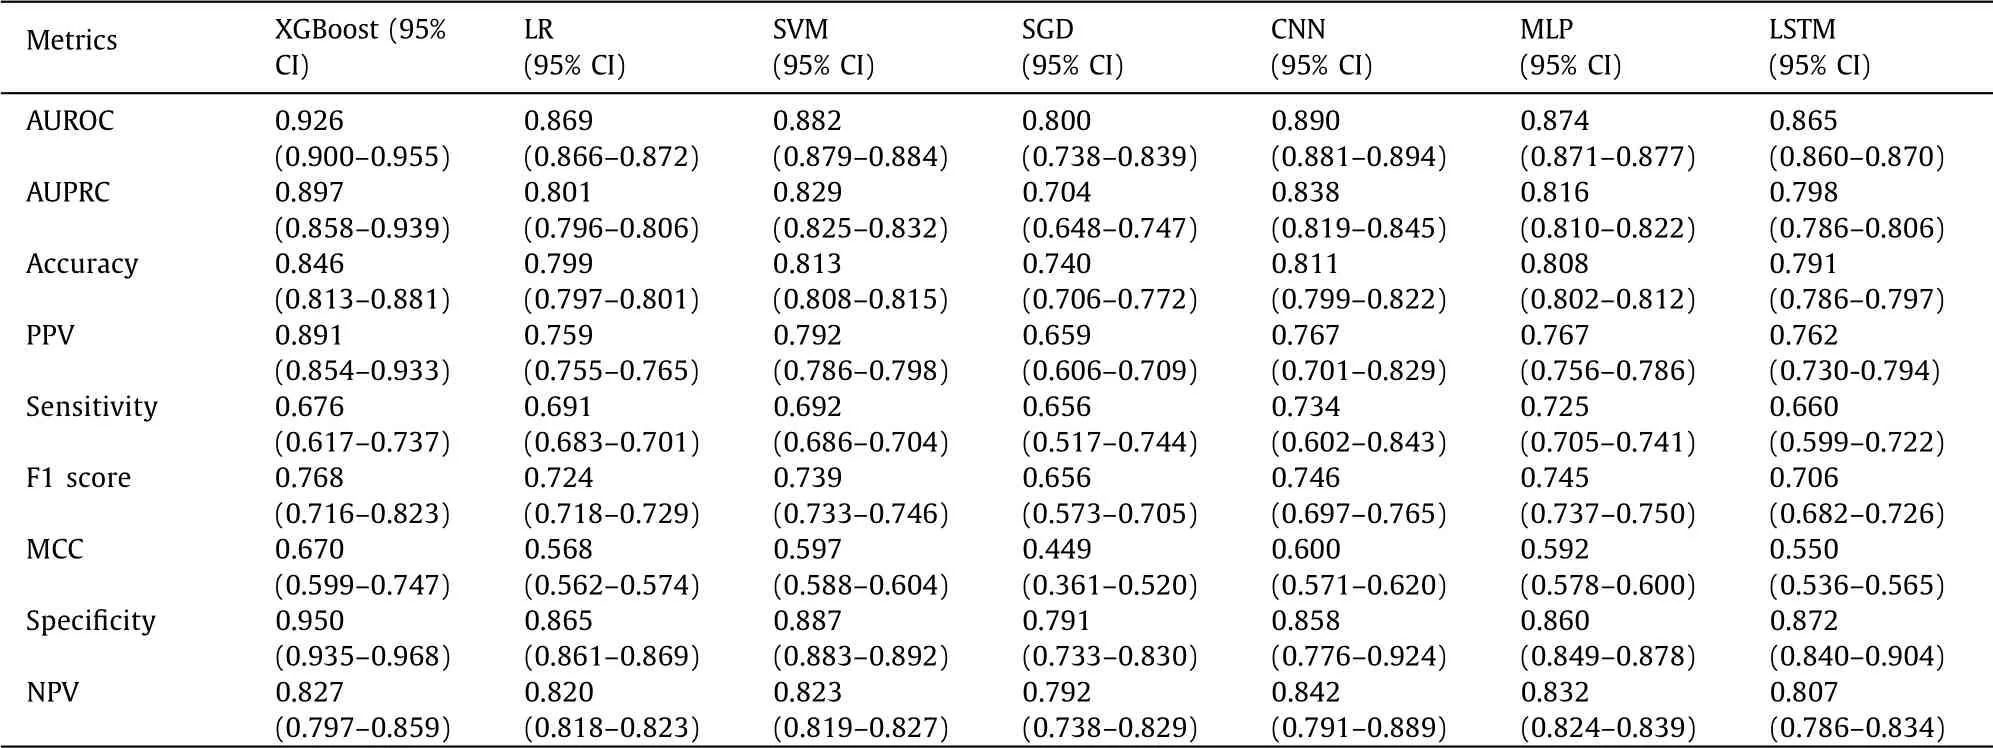
Table 2 The efficacy of XGBoost, LR, SVM, SGD, CNN, MLP and LSTM in the training set.
Validation of the seven models in the testing set
We further validated the seven models in the testing set ( Table 3 ). Similarly, the XGBoost model demonstrated the highest AUROC (0.873), AUPRC (0.810) and specificity (0.909) ( Fig. 4 ). The other six metrics: accuracy, PPV, sensitivity, F1 score, MCC and NPV were all comparable among the seven models. These results con-firmed that the XGBoost model was the best-performing model to predict NAFLD.
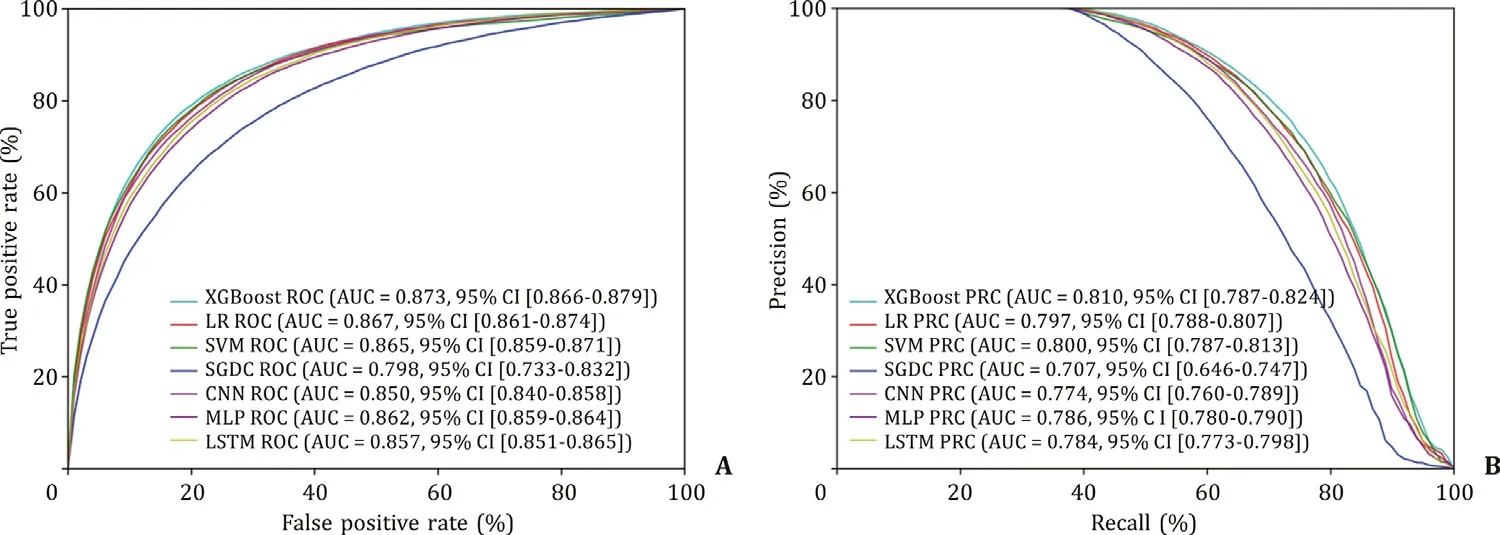
Fig. 4. Validation of the training set. A: AUROC curves of the seven models in the test set; B: AUPRC curves of the seven models in the test set. XGBoost: extreme gradient boosting; LR: logistic regression; SVM: support vector machine; SGD: stochastic gradient descent; MLP: multilayer perceptron; CNN: convolutional neural network; LSTM: long short-term memory; AUROC: area under the receiver operating characteristic curve; AUPRC: area under the precision-recall curve.
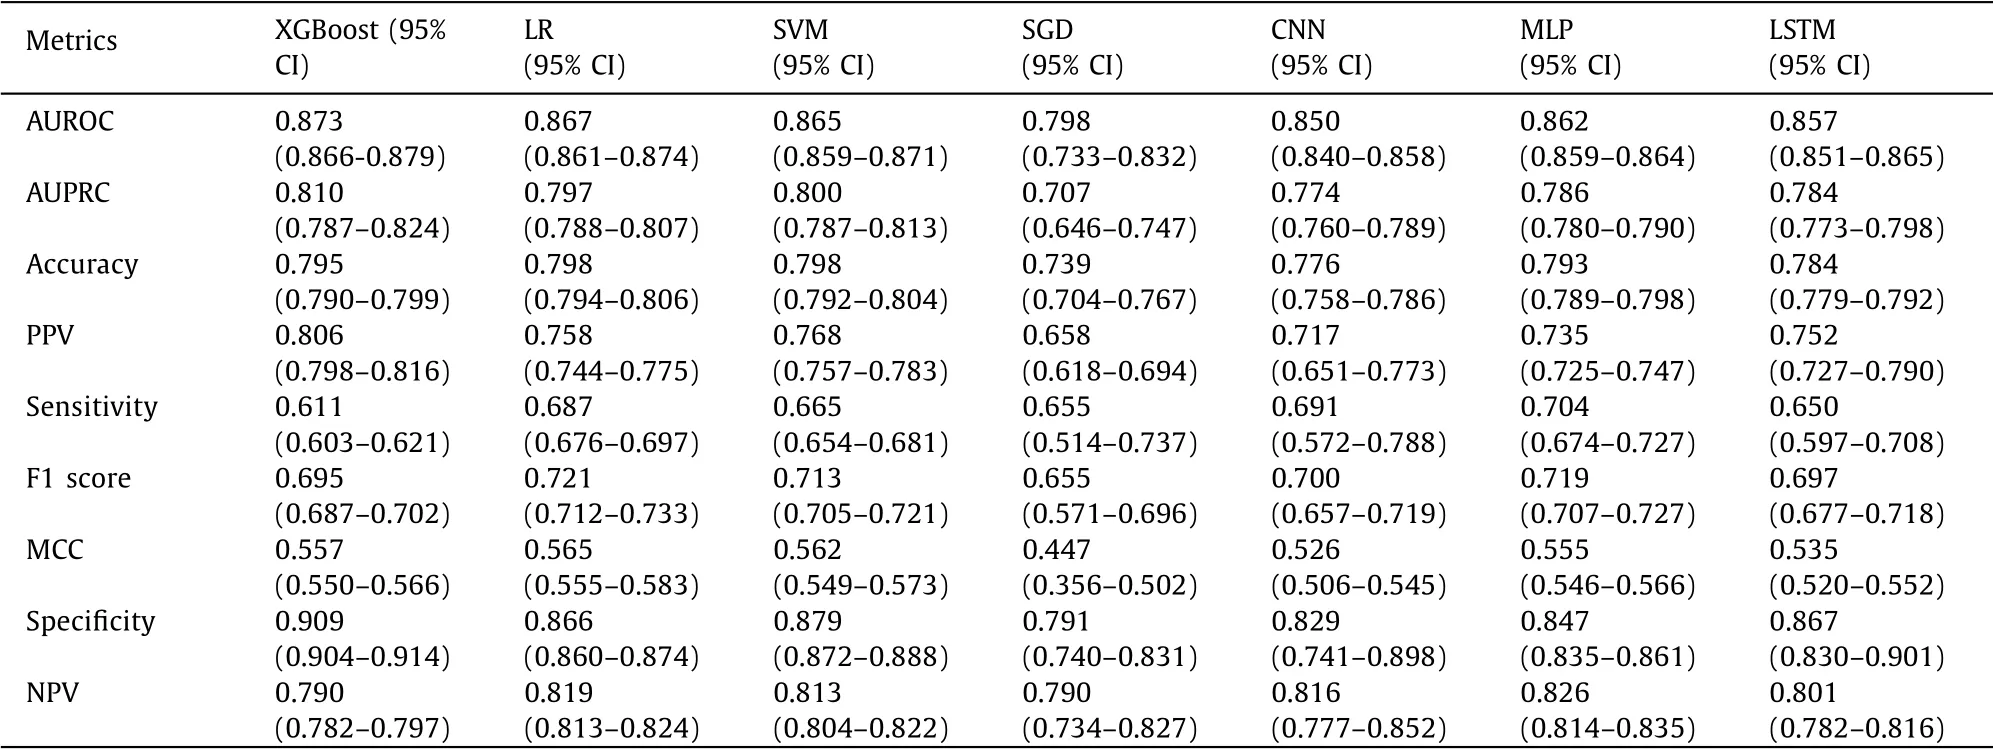
Table 3 The efficacy of XGBoost, LR, SVM, SGD, CNN, MLP and LSTM in the test set.
Discussion
Nowadays artificial intelligence along with its subset of ma-chine learning is playing an increasingly remarkable role in health-care and medicine for the rapid advances in computing power, learning algorithms, and establishing large databases sourced from electronic health records, medical imaging, genomic sequencing, pharmaceutical research, as well as health monitors [10] . Learn-ing algorithms perform more precisely and accurately when they are trained repeatedly on subsets of the training data, allowing re-searchers to get unprecedented insights into diagnostics, therapeu-tic options, and patient outcomes. With the help of artificial intelli-gence applications and big data in healthcare, clinicians gain a bet-ter understanding of epidemiology, etiology and treatment options of diseases. Therefore, healthcare professionals could better iden-tify patients requiring extra need and provide personalized recom-mendations for each individual [11] .
There are many traditional machine learning algorithms, such as the nearest neighbor algorithm, the naive Bayes algorithm, the SVM model and the logistic regression algorithms. According to the characteristics of our data, two advanced machine learning algo-rithms: the XGBoost model and the SGD classifier were applied to predict NAFLD. With the rapid growth of data scale and the development of data computing, deep learning algorithms which contain several hidden layers can analyze data more sufficiently and extract higher-dimensional features. Deep learning has demon-strated good performance in the fields of computer vision [12] and natural language processing [13] . In the current study, three pop-ular deep learning algorithms (MLP, CNN and LSTM) were applied to build models to predict NAFLD.
Recent machine learning advances have brought a major impact within the field of biomarker discovery and disease diagnosis. The range established machine learning algorithms to predict thyroid malignancy demonstrated a comparable performance of an expert cytopathologist [14] . Hyun et al. [15] introduced a machine learn-ing approach to identify histological subtypes of lung cancer with high accuracy. Sato et al. [16] built a predictive machine-learning model for the diagnosis of hepatocellular carcinoma. In addition, there have been several previous works applying machine learning methods for diagnosing NAFLD by leveraging electronic medical record [17–20] . Our study applied the advanced machine learning methods (including XGBoost and CNN) based on the most compre-hensive clinical and biochemical variables (including WC and blood pressure). We compared the predictive capability of the seven ad-vanced machine learning methods and confirmed that the XGBoost model demonstrated the best performance, with the highest AU-ROC (0.873).
Considerable studies have shown that BMI was an independent risk factor of NAFLD [21–24] . A recent study demonstrated that the risk of fatty liver in overweight subjects was 3.55 times higher than that of the normal subjects while in the obese subjects it was 7.59 times of that of the normal subjects. BMI was a significant risk factor of NAFLD in a nonlinear fashion (approx-imatelyJ-shaped fashion) [25] . Consistent with these previous studies, our current study revealed that BMI was the most im-portant indicator among all the clinical and biochemical factors. In addition, the WC was the second most important indicator. Similarly, the identified parameters,i.e.triglyceride, WHtR, ALT and weight also played significant roles in predicting NAFLD, though in a less degree.
Several limitations of the present study should be acknowl-edged. First, this study was an extension of our previous study and the data were retrospectively collected. Second, abdominal ultra-sound served as the reference standard. The accuracy and intra-/inter-rater reliability were not evaluated, which is an inevitable limitation of this study. Third, various genetic factors were not in-cluded in this study, which could be significantly associated with the occurrence and development of NAFLD [26–30] . A larger cohort study consisting of multicenter, diverse races and various occupa-tions is in urgent need for further validation.
In conclusion, we developed seven machine learning based models to predict NAFLD with high accuracy. The XGBoost model showed the best overall prediction ability. Our study revealed that the machine learning demonstrated good performances in predict-ing NAFLD and was beneficial for understanding the contribut-ing factors, making accurate and evidence-based rules and facil-itating clinicians to select optimal management strategies. This method can be used to predict other types of diseases arising from metabolic syndrome.
Acknowledgments
None.
CRediT authorship contribution statement
Yuan-Xing Liu:Conceptualization, Data curation, Funding acquisition, Methodology, Writing -original draft, Writing review & editing.Xi Liu:Conceptualization, Data curation, Methodology.Chao Cen:Conceptualization, Data curation, Funding acquisition, Methodology, Writing -original draft.Xin Li:Data curation, Methodology.Ji-Min Liu:Conceptualization, Writing -original draft.Zhao-Yan Ming:Data curation, Methodology.Song-Feng Yu:Conceptualization, Funding acquisition, Methodology, Writing -original draft.Xiao-Feng Tang:Conceptualization, Methodology, Writing -original draft.Lin Zhou:Conceptualization, Methodology, Writing -original draft.Jun Yu:Conceptualization, Methodology, Writing -original draft.Ke-Jie Huang:Conceptualization, Data curation, Methodology.Shu-Sen Zheng:Conceptualization, Super-vision, Writing -review & editing.
Funding
This work was supported by grants from the National Natural Science Foundation of China ( 81970543 and 81570591 ), Zhejiang Provincial Medical & Hygienic Science and Technology Project of China (2018KY385), Zhejiang Provincial Natural Science Foundation of China (LY20H160023).
Ethical approval
The study was approved by the Ethics Committee of the First Affiliated Hospital, Zhejiang University School of Medicine.
Competing interest
No benefits in any form have been received or will be received from a commercial party related directly or indirectly to the sub-ject of this article.
Supplementarymaterials
Supplementary material associated with this article can be found, in the online version, at doi:10.1016/j.hbpd.2021.08.004 .
杂志排行

Hepatobiliary & Pancreatic Diseases International的其它文章
- Hepatobiliary&Pancreatic Diseases International
- Influence of weight management on the prognosis of steatohepatitis in chronic hepatitis B patients during antiviral treatment
- Key factors and potential drug combinations of nonalcoholic steatohepatitis: Bioinformatic analysis and experimental validation-based study
- LC-MS-based lipidomic analysis in distinguishing patients with nonalcoholic steatohepatitis from nonalcoholic fatty liver
- Cryptococcosis in patients with liver cirrhosis: Death risk factors and predictive value of prognostic models
- Gene knockout or inhibition of macrophage migration inhibitory factor alleviates lipopolysaccharide-induced liver injury via inhibiting inflammatory response