Sparse Reduced-Rank Regression with Outlier Detection
2021-10-14
( School of Data Science, University of Science and Technology of China, Hefei 230026, China.)
Abstract: Based on the multivariate mean-shift regression model, we propose a new sparse reduced-rank regression approach to achieve low-rank sparse estimation and outlier detection simultaneously.A sparse mean-shift matrix is introduced in the model to indicate outliers.The rank constraint and the group-lasso type penalty for the coefficient matrix encourage the low-rank row sparse structure of coefficient matrix and help to achieve dimension reduction and variable selection.An algorithm is developed for solving our problem.In our simulation and real-data application, our new method shows competitive performance compared to other methods.
Keywords: Reduced-rank regression; Sparsity; Outlier detection; Group-lasso type penalty
§1.Introduction
Multivariate linear regression model is widely applied in the scenrios where several response variables are affected by some common predictors.Many commonly used models can be transformed into multivariate linear regression model and be solved.
Consider the multivariate regression model withnobservations ofppredictors andqresponse variables

whereYis then×qresponse matrix,Xis then×ppredictor matrix, denoted byY=(y1,...,yn)T,X=(x1,...,xn)T,xi ∈Rpandyi ∈Rqfori=1,2,...,n,E=(e1,...,en)T∈Rn×qis a random error matrix,ei ∈Rqfori=1,2,...,n.B∈Rp×qis the unknown coefficient matrix we are interested in.
The ordinary least squares ignores the relationships between responses and is equivalent to perform regression on each response independently [6], which may not work in real-data application.Thus reduced-rank regression [1,8,10]has been developed.Given a constraint on the rank of coefficient matrixB, reduced-rank regression solves the problem [8,10]

The constraint on the rank of coefficient matrixBimplies thatBcan be written as a product of two lower dimensional matrices that are of full ranks [10].If we rewriteB=MNTwhereM∈Rp×randN∈Rq×r, we can regardXMas r latent variables to achieve dimension reduction, which can reduce the number of free parameters.Furthermore, the responses can be seen affected by r common latent variables and the relationships among responses have been taken into account.Similarly, a lot of methods using different penalties such as nuclear norm on the coefficient matrixBcan also achieve dimension reduction [5,9,17].
Many sparse estimation methods have been developed for linear regression problems such as lasso [15]and group lasso [18].Combined with these methods, a lot of kinds of penalties are introduced in reduced-rank regression methods to achieve sparse estimation.Chen and Huang use a group-lasso type penalty to encourage the row sparsity of the coefficient matrix to choose important predictors.They proposed the sparse reduced-rank regression method (SRRR) [6].Similar idea can be seen in the RCGL method[3].Sparse singular value decomposition and eigen decomposition are also popular-used methods in sparse coefficient matrix estimation [4,16,19].However, these methods are sensitive to outliers, which are almost inevitable in real data application.Shen and Chen proposed the robust reduced-rank regression method to achieve low-rank coefficient estimation and outlier detection jointly [13]and demonstrate that jointly rank reduction and outlier detection can improve the prediction accuracy [13].
We propose a new approach for low-rank sparse coefficient matrix estimation and outlier detection simultaneously, called sparse reduced-rank regression with outlier detection(SROD).A mean-shift matrix is introduced to the model (1.1) to reflect the effect of outliers and indicate outliers.We assume the coefficient matrix is of low rank and introduce a group-lasso type penalty on it to encourage its row sparsity.A penalty constructed from threshold function is added on the mean-shift matrix to ensure its sparsity since the outliers account for only a small fraction of samples.We develope an iterative algorithm for soving our SROD problem, see Section 2.We compare the new method with other reduced-rank regression methods in Section 3 and our proposed method performs well in our simulation.In Section 4 we apply our SROD method to real-data analysis to see its performance.Discussion and conclusions can be found in Section 5.
Notation 1.1.For any vectora=(a1,...,an)T∈Rn, we use ‖a‖p to denote the lp norm of vectora, defined by1≤p<+∞.Given any m×n matrixA, let r(A)and tr(A)denote the rank and trace of matrixA.‖A‖F denotes the Frobenius norm for matrixAand1≤p<+∞denotes the order-p operator norm ofA.We useAi andAj to denote the ith row and the jth column of matrixArespectively.Ai,j denotes the element in the ith row and jth column of matrixA.Let |·| denote the cardinality of enclosedset and we define ‖A‖0=|(i,j):Ai,j≠0|, ‖A‖2,1=
We also define the threshold functions as follow [13].
Definition 1.1 (Threshold function).If a real-valued functionΘ(t;λ)with parameter λ for t∈Rand0≤λ<+∞satisfies:

§2.Model
2.1.Multivariate mean-shift regression model
Our method is based on the multivariate mean-shift regression model introduced by She and Chen [13,14].Taking outliers into account, She and Chen introduce a mean-shift component to model (1.1), leading to the multivariate mean-shift regression model [13]

whereBis the unknown coefficient matrix andCisn×qmean-shift matrix describing the effect of outliers on responses.Ehas i.i.d.rows fromN(0,Σ).
Since outliers only account for a small part of samples in practice,Cis usually assumed to be row-wise sparse or element-wise sparse with a few nonzero entries.We consider the case whereCis row sparse, that is, if theith row ofCis set as zeros, then sample (xi,yi) is regarded as an outlier.
Based on (2.1), She and Chen proposed the robust reduced-rank regression problem [13]

whereP(C,λ) is the penalty function forCwith penalty parameterλ≥0 to ensure sparsity andΓis a positive definite weighting matrix.
Although robust reduced-rank regression takes outliers into account, it cannot achieve variable selection.Motivated by robust reduced-rank regression method [13]and SRRR method[6], we propose our new method.
2.2.Sparse reduced-rank regression with outlier detection (SROD)
Taking outliers into account, we propose the sparse reduced-rank outlier detection (SROD)problem for low-rank sparse coefficient matrix estimation by solving

whereλi,1≤i≤pare penalty parameters for coefficient matrixB,μis the penalty parameter for matrixC,P(·;μ) is the penalty function for mean-shift matrixC.
We assume the coefficient matrixBis of low rank and introduce a row-sparse penalty on it to encourage row-wise sparsity.SettingBi=0, which is equivalent to setting‖Bi‖2=0, implies that theith predictor can be removed from the model [6].Thus we focus on the row-wise sparse estimation of coefficient matrixBto achieve variable selection by removing unimportant predictors.If we setλi’s all equal to zero, then problem(2.3)reduces to the robust reduced-rank regression (2.2).
Different forms ofP(C;μ) can handle different types of outliers.We mainly consider the row-wise outliers

whereCiis theith row ofC.It can also handle element-wise outliers by penalizing each element of matrixC
Similar to robust reduced-rank regression,P(·;μ) is constructed from any threshold function Θ(·;μ) with parameterμ[13]

for someq(·,μ) satisfyingq(s,μ)≥0 andq{Θ(s;μ);μ}=0 for alls∈R
The association (2.5) between threshold rule Θ(·,μ) and penalty functionP(·;μ) covers a lot of popular-used penalties [12].
For instance, when Θ is the soft-thresholding ΘS(t;μ)=sgn(t)(|t|-μ)1(|t|≥μ), the penalty function constructed from (2.5) is the penaltyP(t;μ)=μ|t|.Thus the form (2.4) is the groupl1penaltyIt also coverslpand other penalties [12].
2.3.Algorithm for SROD
An iterative algorithm is developed to solve SROD problem by updating the coefficient matrixBand mean-shift matrixCin turn.
Note that for fixedB, problem (2.3) is equivalent to the problem
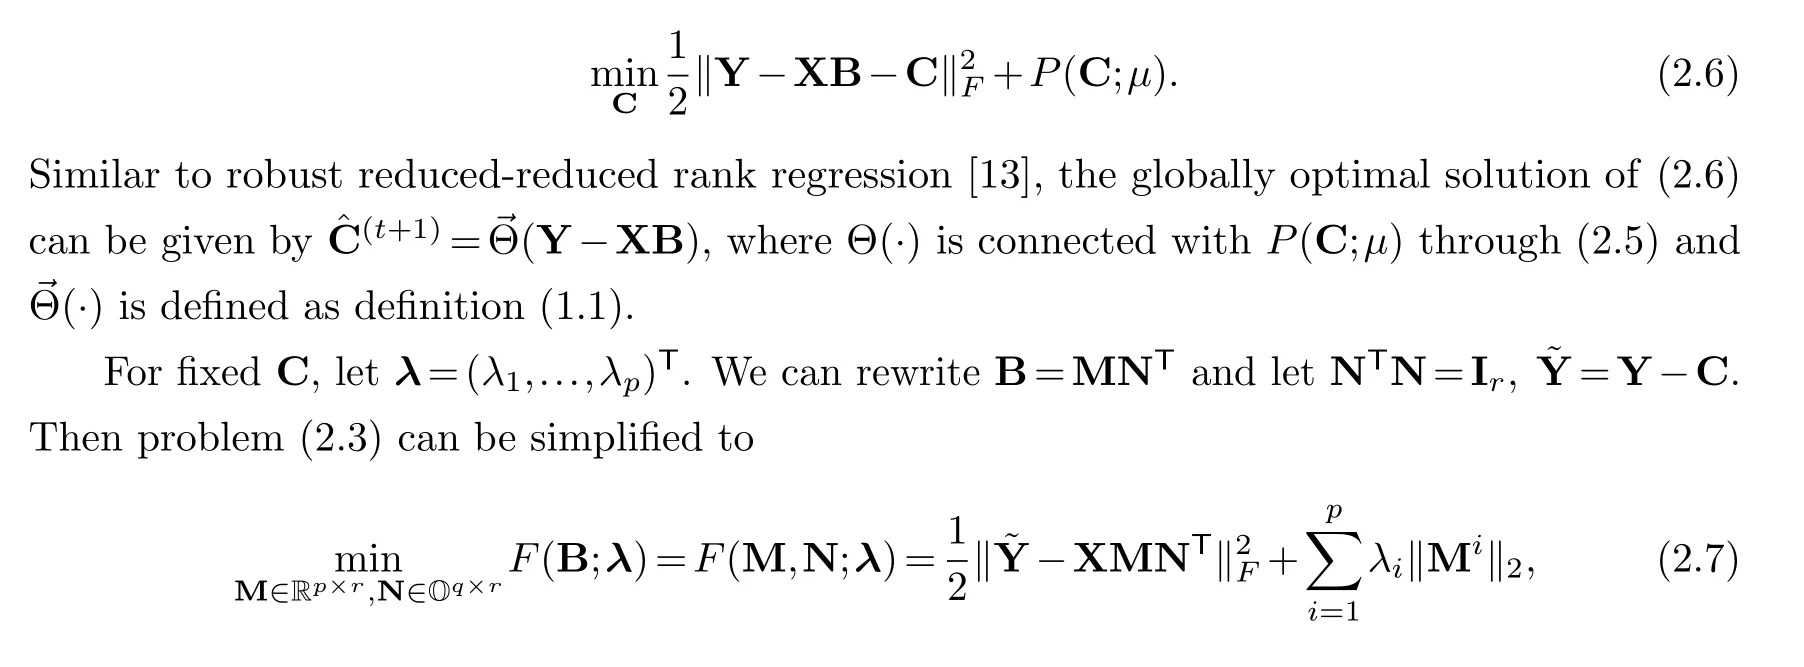
where Oq×r={N∈Rq×r:NTN=Ir}.Since we minimize (2.7) over allp×qmatrices satisfyingr(B)≤r,we cannot directly give the explicit solution to(2.7).We can use an iterative algorithm similar to RCGL method [3]to solve (2.7) with matricesMandNupdated in turn, which is described as follow.
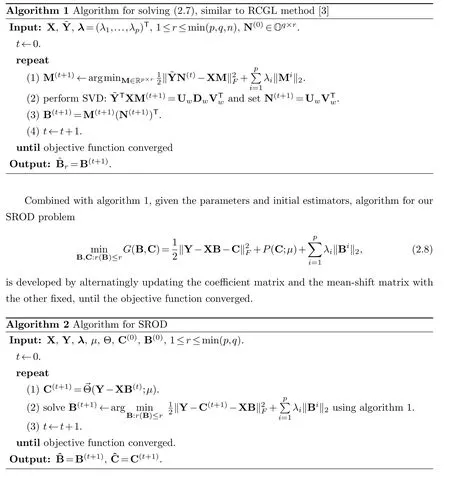
Theorem 2.1.For any threshold functionΘsatisfies definition(1.1), G(B,C)defined by(2.8)and penalty function P(·,μ)constructed fromΘthrough(2.5):

Proof.Part (1): The proof is based on the lemma 1 of She [12].The details can be seen in the paper [12]and thus omitted.Using this lemma, we can get the globally optimal solution for problem (2.8) given fixedBby
Part (2): First we prove that in algorithm 1, we haveF(B(t))≥F(B(t+1)),whereF(B) is defined as (2.7).The proof is similar to RCGL method [3].We can rewrite

which is convex inM, so the global minimum can be achieved at someM.And for fixedM,(2.7) is equivalent to

The global maximum can also be achieved and the global optimal solution is the one used in algorithm 1.Thus we have

That isF(B(t))≥F(B(t+1)), which is equivalent toG(B(t),C(t))≥G(B(t+1),C(t)).
And for algorithm 2, combined with part (1), we have

Consequently, the proof is completed.
§3.Simulation
3.1.Simulation setups
We consider three model setups to compare our proposed method with some reduced-rank regression methods.Denoterx=r(X) andr★is the true rank of coefficient matrixB★.In all the models, the design matrixXis generated fromX1byX=X1X2Δ1/2.BothX1andX2have i.i.d.elements fromN(0,1).Δhas diagonal elements 1 and off-diagonal elements
We construct sparse coefficient matrixB★with form
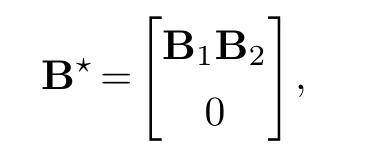
whereB1andB2have i.i.d.entries fromN(0,1).JBis the number of nonzero rows of true coefficient matrix.Error matrixEhas i.i.d.rows fromN(0,σ2Σ), whereΣhas diagonal elements 1 and off-diagonal elementsρe.Similar to She and Chen [13],σ2is defined as the ratio between ther★th sigular value ofXB★and‖E‖F, which is to control the signal to noise ratio.
Outliers are added by setting the first 10% rows ofC★to be nonzero.Specifically, the elements of the first 10% rows ofC★are random uniformly sampled from [-15,-10]∪[10,15].Finally, the response matrixYis constructed fromY=XB★+C★+E.
Three models have different sample sizes.Model 1 and 2 consider the situation wheren>p.In model 1 we setn=100,p=30,q=10,r★=3,ρe=0.3,ρx=0.5,JB=10 andrx=20.In model 2 we setn=200,p=50,q=10,r★=5,ρe=0.3,ρx=0.5,JB=10 andrx=20.In model 3 we consider the situation wherep>n.We setn=50,p=100,q=10,r★=5,ρe=0.3,ρx=0.5,JB=10.
3.2.Methods and evaluation matrices
We compare our proposed method SROD with some reduced-rank regression methods.We consider the plain reduced-rank regression(RRR) [2], sparse reduced-rank regression(SRRR) [6],SOFAR [16], RSSVD [4]and robust reduced-rank regression [13](R4) method.SRRR, SOFAR and RSSVD methods can achieve sparse coefficient estimation but are sensitive to outliers.Robust reduced-rank regression can achieve outlier detection but cannot select important variables.
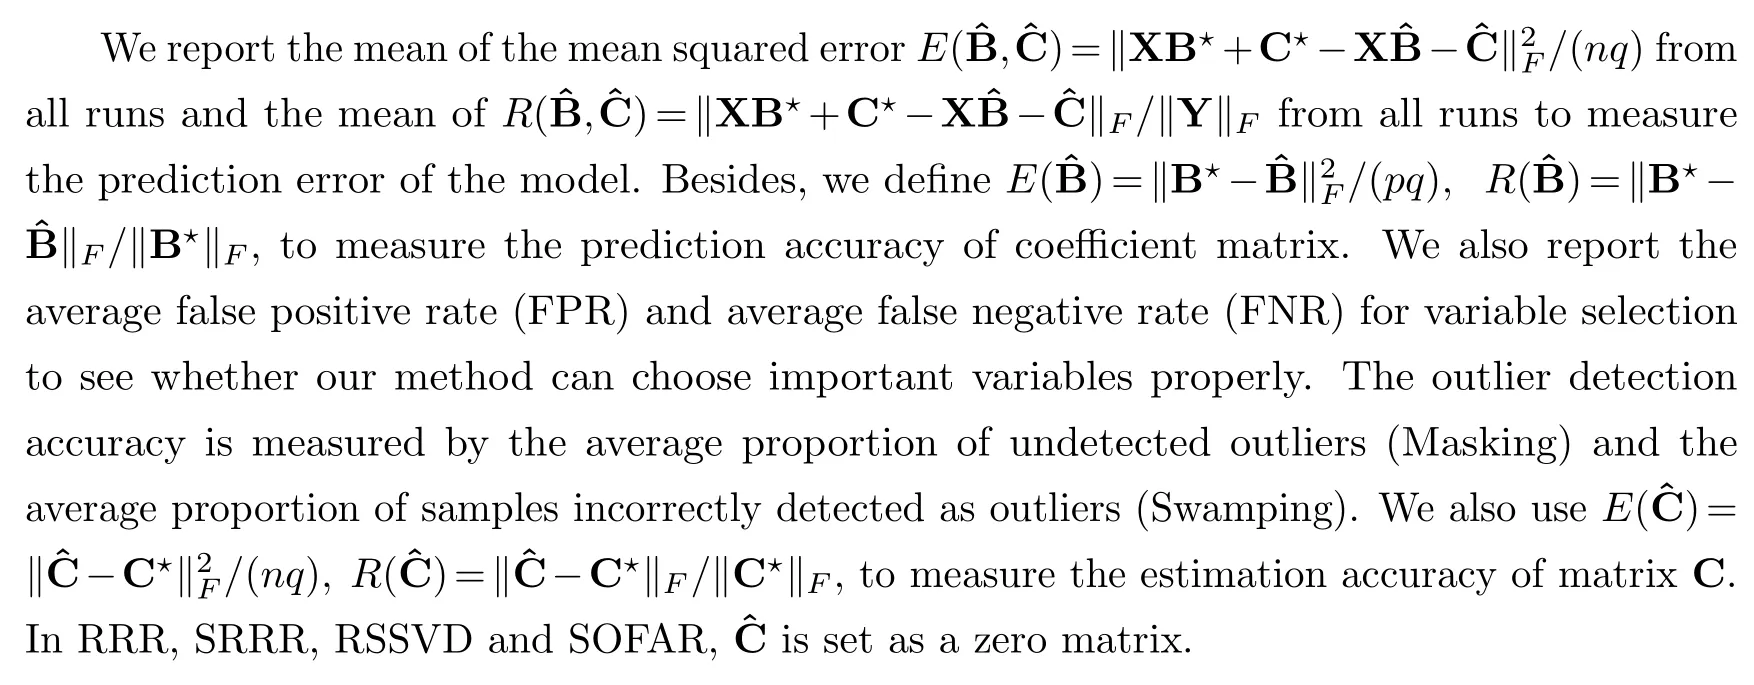
In the simulation we use thel0penalized form for the mean-shift matrixC.To reduce the number of parameters in our SROD method, we use the idea of adaptive lasso [6,20].Given a pilot estimatorof coefficient matrix , we setand simply chooseγ=-2 during simulation [20].Then we only need to tune three parametersr,λandμ.These three parameters are tuned by BIC.Parameters of RRR and SRRR are tuned by five-fold cross validation.Parameters of SOFAR are tuned by GIC [7,16]and parameters of RSSVD is tuned by BIC.Specially, we preset the desired rank of coefficient matrix for SRRR, SOFAR and RSSVD, which means these methods estimate the coefficient matrix on the premise that the optimal rank is already known.
3.3.Simulation results
Table 1-3 shows the simulation results for each model respectively.In model 1 and 2,whenn>p, our proposed SROD method can correctly detect the outliers.Except for robust reduced-rank regression (R4), the other four methods cannot achieve outlier detection.From the value ofwe can see that our proposed method shows competitive performance compared with robust reduced-rank regression.Our proposed method has the lowest mean of predicted errorcompared with other methods, which implies outlier detection can helpto recover low-rank sparse structure of coefficient matrixB.The high mean squared error of the last four methods is mainly because of the outliers.RRR, SRRR, RSSVD and SOFAR cannot explicitly detect outliers, which affects the estimation of coefficient matrixB.This also shows that reduced-rank regression methods are sensitive to outliers.Reduced-rank regression and robust reduced-rank regression don’t encourage sparsity of coefficient matrix and thus cannot achieve variable selection, so these two methods cannnot recover the sparse structure of coefficient matrix correctly.
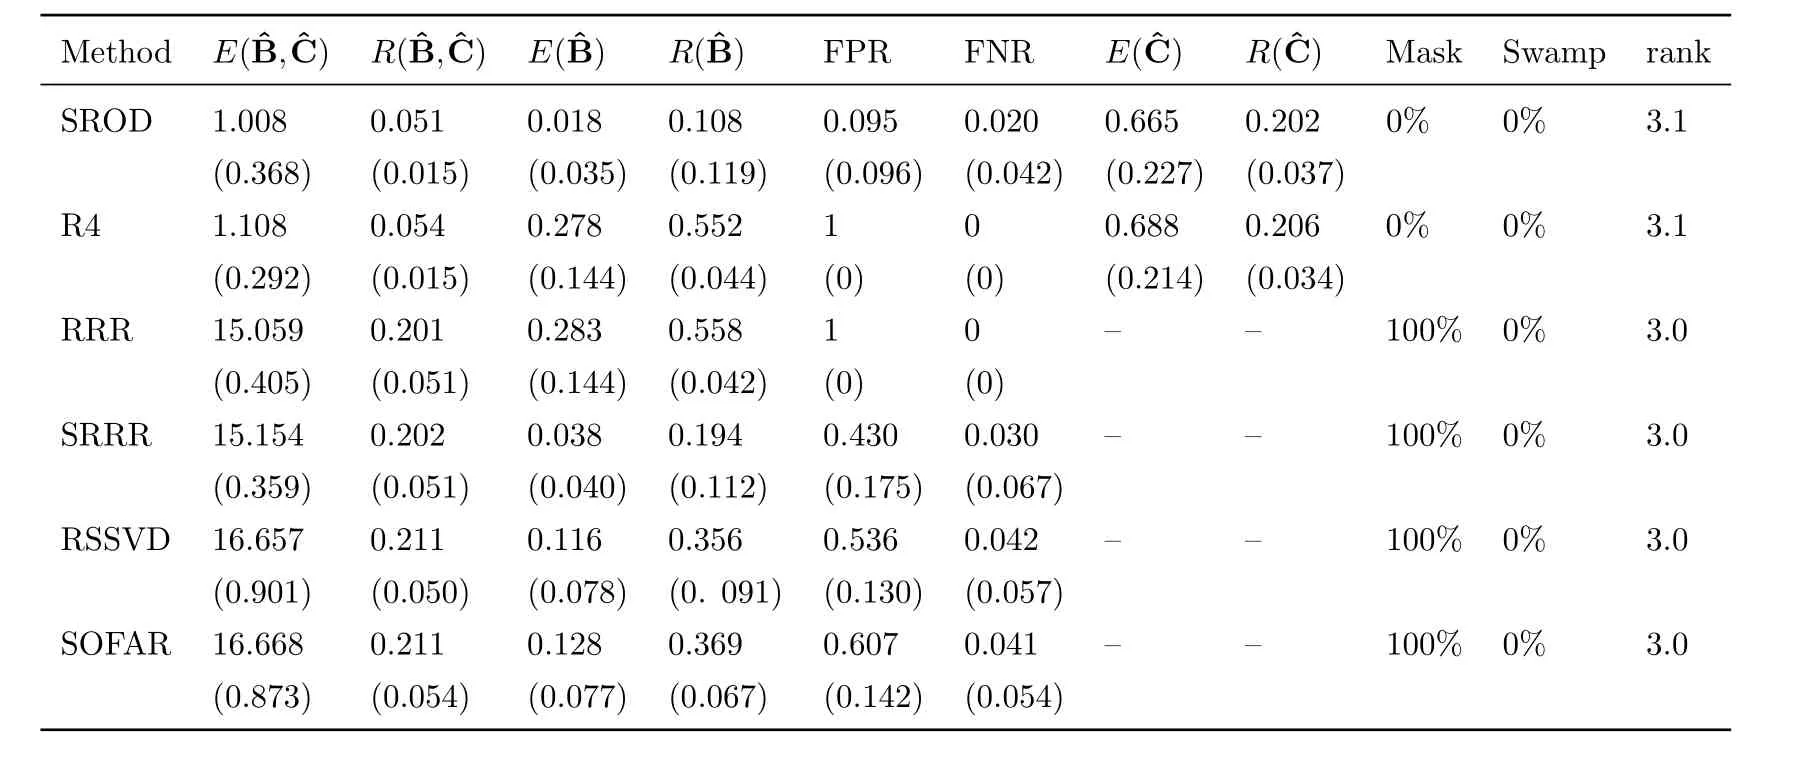
Table 1:Simulation results for model 1 with signal to noise ratio 0.75.Reported are the means and standard deviation (in parentheses) of our defined evaluation matrices from all runs.
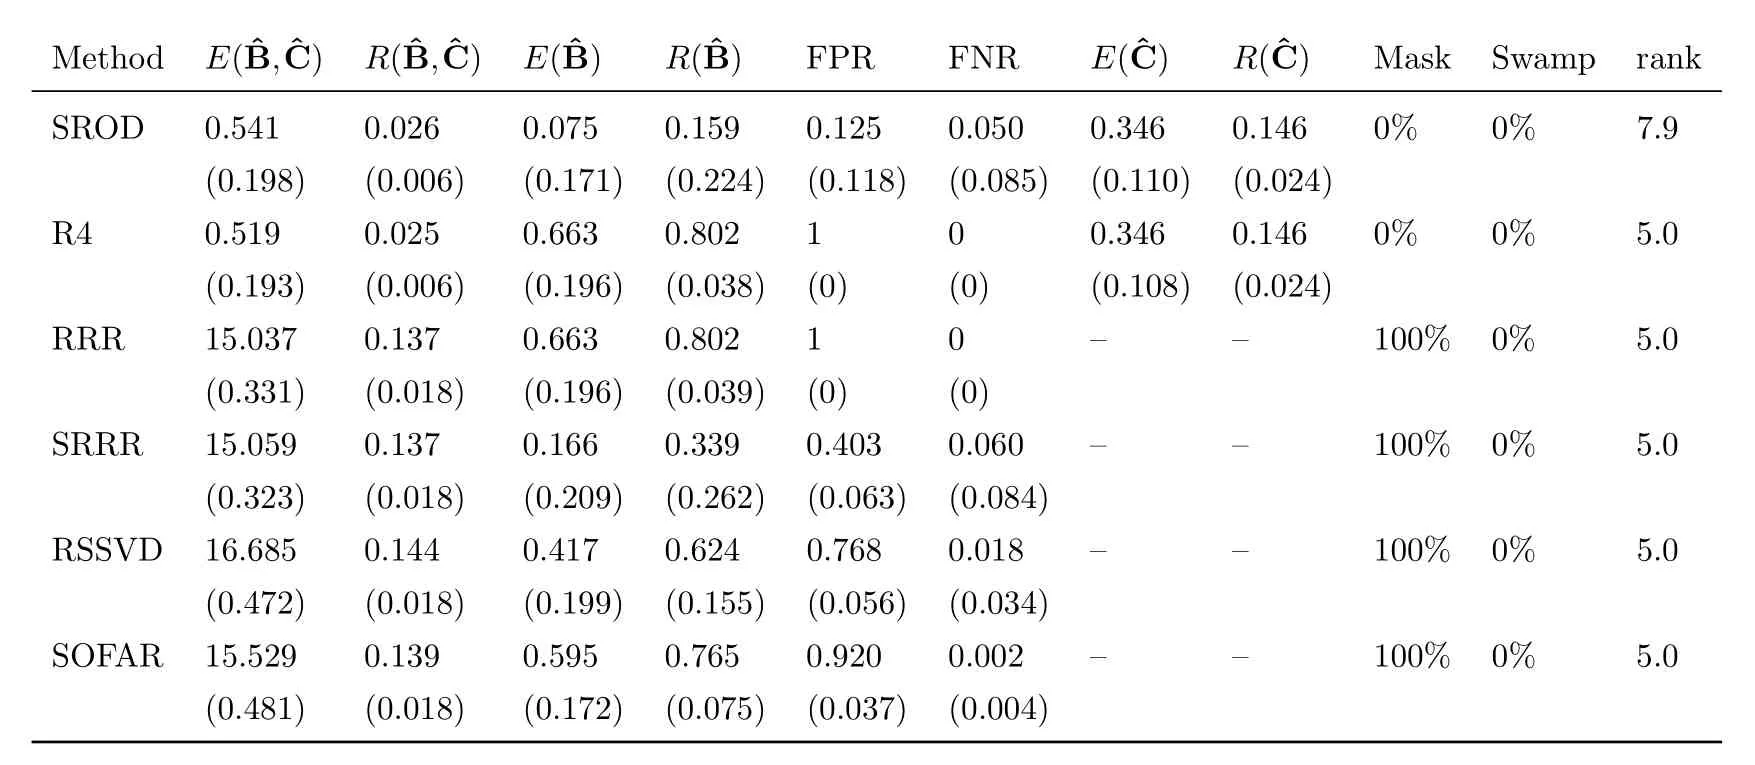
Table 2:Simulation results for model 2 with signal to noise ratio 0.75.Reported are the means and standard deviation (in parentheses) of our defined evaluation matrices from all runs.
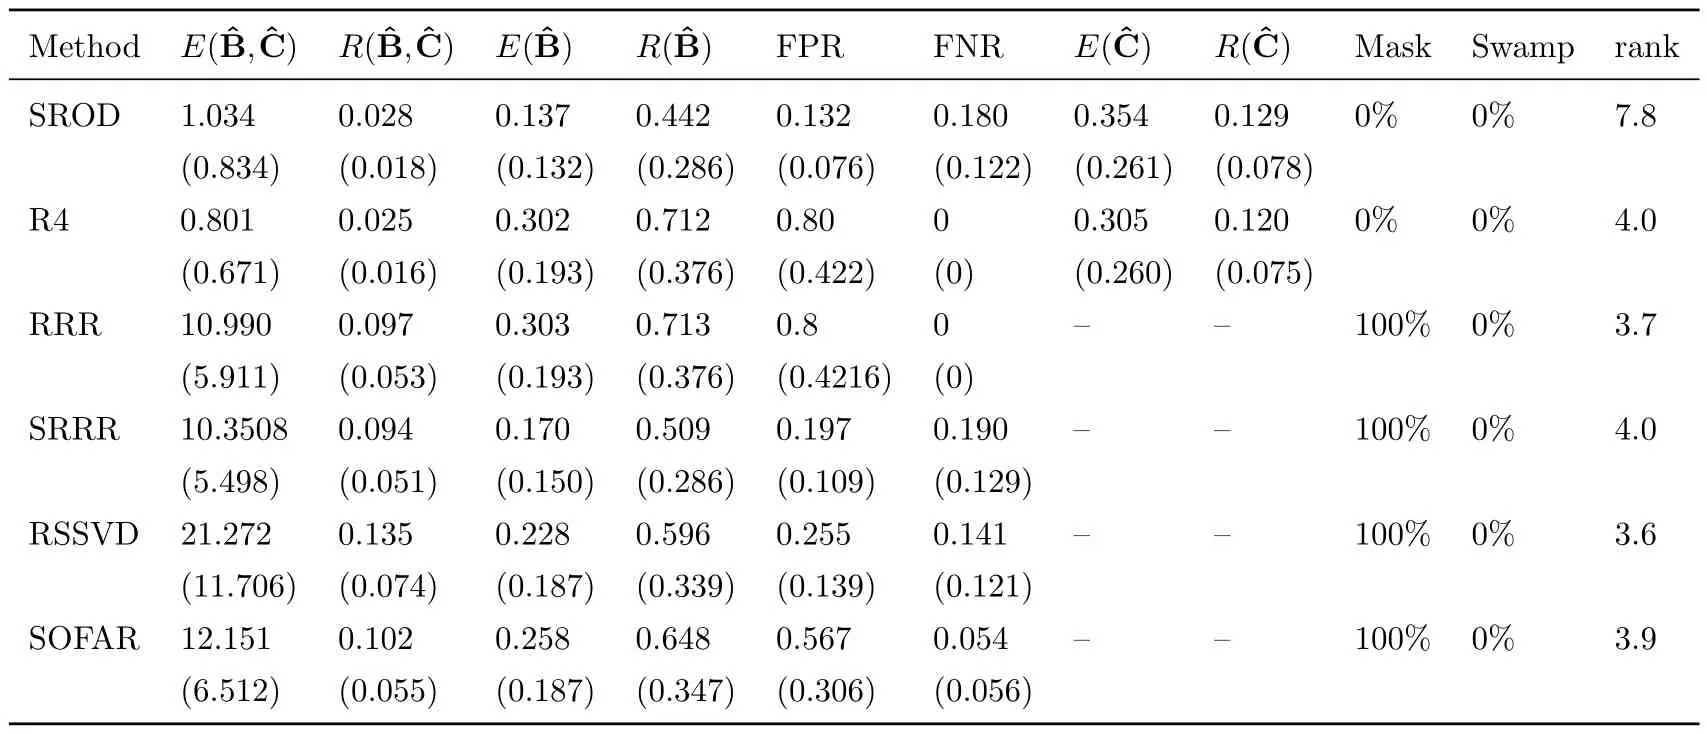
Table 3:Simulation results for model 3 with signal to noise ratio 0.75.Reported are the means and standard deviation(in parentheses) of our defined evaluation matrices from all runs.
From table 1 and 2, our SROD method has the lowest FPR and can almost select all the important variables correctly.Other sparse reduced-rank regression methods tend to over-select,which means they tend to select more variables.They all produce high FPR and low FNR.
Table 3 shows the result for model 3 when the number of predictors is more than observations.The estimatedof our proposed method has low mean squared errorand shows competitive performance in predicted errorcompared with robust reduced rank regression.SROD method correctly detected the outliers and has the lowest FPR among all the methods.But our SROD method tuned by BIC has high bias on the estimate of rank whenp>n.In fact for SROD, if we plot the value of BIC for each rank from all runs of model 3, the curves all drop dramatically when rank is 5, and then decrease slowly.To choose the rank of coefficient matrix accurately whenn<p, better information criterion for parameter tuning need to be further studied.

Table 4:mean and standard deviation (in parentheses) of predicted squared error(× 1000).
§4.Real data analysis
Multivariate linear model has been widely used in finance.An important task is to predict the future returns on the basis of historical information.Vector autoregression model(VAR)is a uesful method for multivariate time series analysis.We choose a dataset of weekly stock log-return data for nine of the largest American companies in 2004.The data is available in the R package MRCE [11].This dataset has been analyzed many times in literature [11,13,17].We do not consider Chevron because its stock price dropped dramatically that year [17].Vector autoregression model with order 1 can be used to analyze the data [17].Letytbe the vector of returns in time t, VAR(1) model can be seen as a multivariate linear regression model

wherehas rowsy1,...,yT-1andYhas rows ofy2,...,yT.
For the weekly log-returns data, we setyt ∈R9, t=1,...,52.We use the data of first half year for training and the other for testing.Specifically, for training set we setT=26, using log-returns at weeks 1-25 as predictors and log-returns at weeks 2-26 as responses.For testing set, we use log-returns at weeks 27-51 as predictors and log-returns at weeks 28-52 as responses to fit the model built by training set.
We consider entry-wise outliers and usel0penalized form for outlier detection.The parameters are tuned by PIC proposed by She and Chen [13].Prediction accuracy is measured by mean squared error of each stock.When estimating the coefficient matrix, the input of our procedure are multiplied by 100 for better computing.We calculate the predicted mean squared error for each stock in the testing set based on the original data.Other methods such as ordinary least squares, plain reduced-rank regression(RRR) [2], sparse reduced-rank regression(SRRR) [6]and robust reduced-rank regression(R4) are also used for comparison.For robust reduced-rank regression we use the entrywise penalized form.
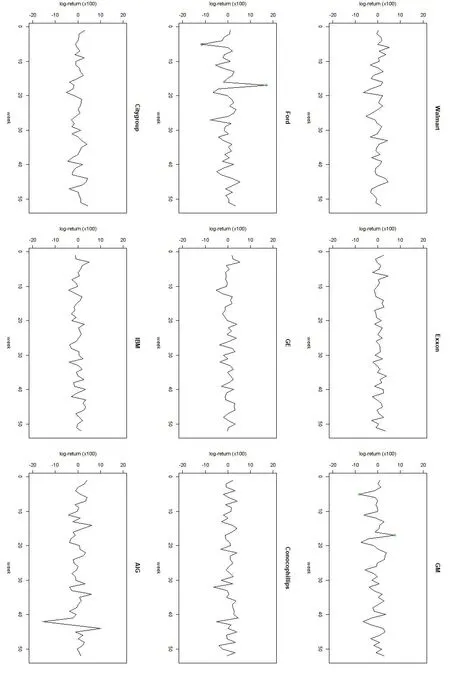
Fig.1 Weekly log-returns(×100)of nine companies in 2004, outliers detected by SROD method are labeled by blue circles.Green circles mark the outliers detected by both SROD and R4 methods.
The weekly log-returns of these nine companies are shown in figure 1.Table 4 shows the averaged predicted squared error for each method.We run the SROD method for 30 times and SROD method detects four outliers, the log-returns at Ford and General Motors at weeks 5 and 17.The robust reduced-rank regression using entrywise penalized form detected three outliers,which are included in the four outliers our SROD method detected.According to She and Chen,these outliers are associated with two real market disturbances [13].We use green circles to mark the outliers detected by both R4 and SRRR methods and blue circles to mark the outliers that are only detected by SROD method.
Our proposed SROD method performs competitively compared to other methods.All the reduced-rank regression methods resulted in unit-rank model.During the 30 runs, logreturns of Ford, ConocoPhillips and Citigroup are selected as important variables over 20 times.Log-returns of Exxon, GE and IBM are selected less than 10 times.So we consider Ford,ConocoPhillips and Citigroup as important variables for future price prediction.It’s also similar to the result of MRCE method [11].
§5.Discussion
Based on the mean-shift multivariate regression model, we take outliers into account and propose a new sparse reduced rank method to achieve low-rank sparse estimation as well as outlier detection.The simulation results and the real data application shows that our SROD method performs well.However, we just consider the row-sparsity of the coefficient matrix.There are many reduced-rank regression methods that encourage the element-wise sparsity of the coefficient matrix using sparse singular value decomposition.How to achieve element-wise sparsity of the coefficient matrix and outlier detection jointly needs further research.The disadvantage of our method is that we have many tuning parameters and for very large-scale data, tuning procedure and our proposed algorithm may be expensive since we cannot give the explicit form of solution.So how to choose the form of penalty that encourages the sparsity of coefficient matrixBand can be solved easily and effectively should be considered.
杂志排行
Chinese Quarterly Journal of Mathematics的其它文章
- Batalin-Vilkovisky Structure on Hochschild Cohomology of Self-Injective Quadratic Monomial Algebras
- Continuous Dependence for a Brinkman-Forchheimer Type Model with Temperature-Dependent Solubility
- Continuous Dependence for the 3D Primitive Equations of Large Scale Ocean Under Random Force
- Y-Gorenstein Cotorsion Modules
- A Novel Parameter-Free Filled Function and Its Application in Least Square Method
- The Optimal Matching Parameter of Half Discrete Hilbert Type Multiple Integral Inequalities with Non-Homogeneous Kernels and Applications
