2D/2D FeNi-LDH/g-C3N4 Hybrid Photocatalyst for Enhanced CO2 Photoreduction
2021-09-01HanLiFangLiJiaguoYuShaowenCao
Han Li, Fang Li, Jiaguo Yu, Shaowen Cao
State Key Laboratory of Advanced Technology for Materials Synthesis and Processing, Wuhan University of Technology, Wuhan 430070, China.
Abstract: Photocatalytic reduction of carbon dioxide into chemical fuels is a promising route to generate renewable energy and curtail the greenhouse effect. Therefore, various photocatalysts have been intensively studied for this purpose. Among them, g-C3N4, a 2D metal-free semiconductor, has been a promising photocatalyst because of its unique properties, such as high chemical stability, suitable electronic structure, and facile preparation. However, pristine g-C3N4 suffers from low solar energy conversion efficiency, owing to its small specific surface area and extensive charge recombination. Therefore, designing g-C3N4 (CN) nanosheets with a large specific surface area is an effective strategy for enhancing the CO2 reduction performance. Unfortunately, the performance of CN nanosheets remains moderate due to the aforementioned charge recombination. To counter this issue, loading a cocatalyst (especially a two-dimensional (2D) one) can enable effective electron migration and suppress electron-hole recombination during photo-irradiation. Herein, CN nanosheets with a large specific surface area (97 m2·g−1) were synthesized by a two-step calcination method, using urea as the precursor. Following this, a 2D/2D FeNi-LDH/g-C3N4 hybrid photocatalyst was obtained by loading a FeNi layered double hydroxide (FeNi-LDH) cocatalyst onto CN nanosheets by a simple hydrothermal method. It was found that the production rate of methanol from photocatalytic CO2 reduction over the FeNi-LDH/g-C3N4 composite is significantly higher than that of pristine CN. Following a series of characterization and analysis, it was demonstrated that the FeNi-LDH/g-C3N4 composite photocatalyst exhibited enhanced photo-absorption, which was ascribed to the excellent light absorption ability of FeNi-LDH. The CO2 adsorption capacity of the FeNi-LDH/g-C3N4 hybrid photocatalyst improved, owing to the large specific surface area and alkaline nature of FeNi-LDH. More importantly, the introduction of FeNi-LDH on the CN nanosheet surface led to the formation of a 2D/2D heterojunction with a large contact area at the interface, which could promote the interfacial separation of charge carriers and effectively inhibit the recombination of the photogenerated electrons and holes.This subsequently resulted in the enhancement of the CO2 photo-reduction activity. In addition, by altering the loading amount of FeNi-LDH for photocatalytic performance evaluation, it was found that the optimal loading amount was 4% (w,mass fraction), with a methanol production rate of 1.64 μmol·h−1·g−1 (approximately 6 times that of pure CN). This study provides an effective strategy to improve the photocatalytic CO2 reduction activity of g-C3N4 by employing 2D layered double hydroxide as the cocatalyst. It also proposes a protocol for the successful design of 2D/2D photocatalysts for solar energy conversion.
Key Words: Photocatalysis; 2D materials; Layered double hydroxide; Solar energy conversion; Charge transfer
1 Introduction
Since the industrial revolution, uncontrolled burning of fossil fuels has not only caused serious energy depletion problems, but also brought a lot of environmental pollution problems1,2. The greenhouse effect caused by the sharp increase of carbon dioxide has resulted in a great threat to the sustainable development of humankind. Greenhouse effect can lead to a series of problems,such as increased pests, global warming, sea level rise, land desertification and hypoxia,etc. Thus, reducing the amount of greenhouse gas and exploring the solution of energy problem is urgent3-6. The technology of photocatalytic CO2reduction,using inexhaustible pollution-free solar energy as the source, can convert CO2into small molecular organic compounds such as:methanol, methane, ethanol and so on7-9. In the past decades,scientists have made tremendous efforts to the development of semiconductor photocatalysts, including ZnO, TiO2, CdS, CdSe,InTaO3, BiOV4, NaNbO3, Bi2WO6, g-C3N4, WO3,etc.7,10-12.Among them, g-C3N4has a lot of advantages such as nontoxicity, low cost, high stability, suitable electronic band structure and easy synthesis. However, the deficiencies of small specific surface area and serious recombination of electrons and holes also greatly restrict its development. As such, researchers have proposed a variety of methods to modify g-C3N4, such as heterojunction construction, doping, morphology control and the introduction of cocatalyst13-16.
Herein, we report the preparation of 2D/2D hybrid photocatalyst by loading layered double hydroxide FeNi-LDH onto g-C3N4nanosheets. This hybrid photocatalyst exhibits enhanced photocatalytic performance of CO2reduction,compared to the pristine g-C3N4, because the 2D/2D interface contact assures efficient charge carriers separation and at the same time, the alkaline sites in between FeNi-LDH layers promote the CO2adsorption.
2 Experimental section
2.1 Chemicals
All reagents were of analytical grade and used without further purification. Ethanol (AR, 99.7%), urea (AR, 99%), trisodium citrate dihydrate (AR, 99%), Fe(NO3)3·9H2O (AR, 98.5%) and NiCl2·6H2O (AR, 98%) were purchased from Sinopharm Chemical Reagent Co., Ltd., China.
2.2 Photocatalyst preparation
CN nanosheets were obtained by a two-step calcination process. 20 g urea was calcined at 550 °C for 2 h with a ramping rate of 5 °C·min−1and bulk g-C3N4was obtained. Then, 1 g bulk g-C3N4was heated to 420 °C for 2 h with a heating rate of 5 °C·min−1. After that, the temperature was increased from 420 °C to 600 °C at a heating rate of 3 °C·min−1and kept at 600 °C for 3 h. Finally, the obtained light-yellow powder was g-C3N4nanosheets.
A simple hydrothermal method was then used to synthesize FeNi-LDH/g-C3N4hybrid photocatalyst. Typically for CN/LDH4, 0.25 mol·L−1ferric nitrate aqueous solution (0.145 mL), 0.25 mol·L−1nickel chloride aqueous solution (1.45 mL),0.125 mol·L−1urea aqueous solution (5.6 mL) and 0.0025 mol·L−1trisodium citrate aqueous solution (2 mL) were added into 70.8 mL deionized water under magnetic stirring.Afterwards, 1 g g-C3N4nanosheets were added into the above mixture solution and stirred for another hour. After that, the suspension was loaded into a 100 mL Teflon-lined autoclave for hydrothermal reaction at 150 °C for 24 h. Then, the resultant sample was centrifuged and washed with deionized water and ethanol several times and dried in an oven at 80 °C for 12 h. The FeNi-LDH/g-C3N4composite photocatalyst at 2% (w, mass fraction), 4% (w), 8% (w) of FeNi-LDH loading were prepared and named as CN/LDH2, CN/LDH4, and CN/LDH8,respectively. In addition, pure g-C3N4nanosheets and pure FeNi-LDH were named as CN and LDH.
2.3 Photocatalytic CO2 reduction test
The photocatalytic performance of the samples was carried out at ambient temperature in a 200 mL double-neck Pyrex reactor with a groove at one neck. 0.05 gas-prepared sample was put onto the bottom of the Pyrex reactor with 10 mL deionized water under sonication, and then the reactor was transferred into the drying oven special for CO2reduction with temperature of 80 °C for 4 h. After that, nitrogen was blown into the reactor for 30 min to remove air and ensure that the reaction system was under anaerobic condition. In order to obtain CO2and H2O,0.084 g NaHCO3was placed in the groove before sealed and 0.3 mL H2SO4(2 mol·L−1) aqueous solution was injected into the groove through an injector after bubbling nitrogen. The reactor was illuminated by a 300 W Xe lamp (Changzhou Siyu Science Co. Ltd., China). At every one hour, a syringe was used to extract 1 mL gas mixture from the reactor, and the gas was detected by a gas chromatograph (GC2014C, Shimadzu, Japan) equipped with a flame ionized detector (FID) and methanizer.
2.4 Characterization
The X-ray diffraction (XRD) patterns of the as-obtained photocatalysts were obtained on an X-ray diffractometer(Rigaku, Japan) with CuKαradiation at a scan rate of 2θ= 0.05(°)·s-1. The microstructure of as-prepared samples was characterized using a field emission scanning electron microscope (FESEM, JEOL JSM-7500, Japan) and a transmission electron microscope (TEM, JEOL JEM-2100F,Japan). Ultraviolet-visible diffuse reflectance spectra (UV-Vis DRS) were tested on a UV-2550 UV-Vis spectrophotometer(Shimadzu, Japan) with BaSO4as the reference standard.Photoluminescence (PL) spectra were recorded by a fluorescence spectrophotometer (F-7000, Hitachi, Japan) with an excitation wavelength of 320 nm. The width of excitation and emission slits was both 2.5 nm. N2adsorption-desorption isotherms were obtained on an ASAP 3020 adsorption analyzer(Micromeritics, USA). The specific surface area was calculated by Brunauer-Emmett-Teller (BET) method. The pore size distribution and pore volume of the as-prepared photocatalysts were obtained through the Barrett-Joyner-Halenda method. The CO2adsorption measurements of the samples were performed on the same equipment (ASAP 3020, Micromeritics, USA) at room temperature. Before CO2adsorption experiment, all the photocatalysts were degassed at 150 °C for 4 h. The real loading amount of Fe and Ni were measured using inductively coupled plasma atomic emission spectrometry (ICP-AES) on a Perkin-Elmer Optima 4300DV (USA). The elemental analysis was tested on an elemental analyzer (Vario EL cube, Elementar,Germany). X-ray photoelectron spectroscopic (XPS) analysis was performed on a VG ESCALAB 210 X-ray photoelectron spectrometer (Thermo Fisher, USA) using AlKαas the X-ray source. Energy-dispersive X-ray spectroscopy (EDS) elemental mapping analysis was measured on an Oxford X-MAXn EDS apparatus. The photoelectrochemical experiment was tested on an electrochemical workstation (CHI660C, Chenhua Instrument,China) with a standard three-electrode system.In situFT-IR spectra were obtained on a Nicolet iS50 FTIR spectrometer(Thermo Fisher, USA).
3 Results and discussion
3.1 Phase analyses
Fig. 1 shows the XRD patterns of LDH, CN, CN/LDH2,CN/LDH4, CN/LDH8. Pristine g-C3N4and all the prepared FeNi-LDH/g-C3N4composite materials have three peaks located at 2θ= 11.2°, 21.9° and 27.5°, respectively. The small peak at 2θ=11.2° corresponds to the (100) plane of g-C3N422. This peak can be attributed to the repeating units of the triazine structure in the plane and the distance is ~0.675 nm23. The stronger peak at 2θ=27.5° corresponds to the (002) plane of g-C3N4with the interlayer spacing of 0.326 nm. The peak is a characteristic peak of the interlayer accumulation of the aromatic compounds24-26.These two peaks are consistent with the characteristic diffraction peaks of g-C3N4reported in the previous literature27,28. The peak at 2θ= 21.9° could be attributed to the sample holder for XRD measurement. Because of the low content of FeNi-LDH in the prepared samples, the characteristic diffraction peaks of FeNi-LDH in all FeNi-LDH/g-C3N4composite samples are not observed. The characteristic peaks of pure FeNi-LDH are located at 2θ= 11.7°, 22.2°, 33.3°, 34.3°, 38.6°, 59.6°,corresponding to (003), (006), (101), (012), (015), (110) planes of the nickel hydroxide rhombic hexahedron29.
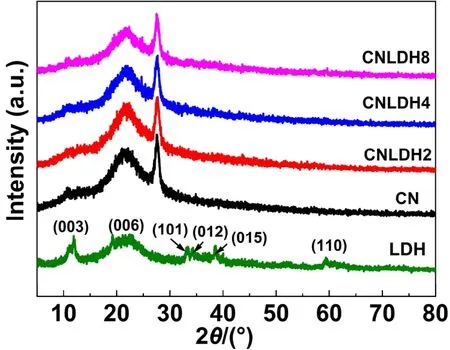
Fig. 1 XRD patterns of LDH, CN, CN/LDH2, CN/LDH4 and CN/LDH8 samples.
3.2 Microstructure observation
g-C3N4obtained by one-step calcination shows a large size(Fig. 2a), while the size of g-C3N4obtained through two-step calcination is much smaller (Fig. 2b), with the edges of the nanosheets partially curled. FeNi-LDH is also composed of thin nanosheets (Fig. 2c). The morphology of g-C3N4does not change significantly after loading FeNi-LDH, as confirmed by the FESEM image of CN/LDH4 (Fig. 2d). Moreover, the ultrathin structure of g-C3N4nanosheet was further demonstrated by TEM observation (Fig. 2e), which displays a transparent feature.Fig. 2f is the TEM image of CN/LDH8. It can be seen that FeNi-LDH is successfully loaded on the surface of the CN nanosheet,which was confirmed by the EDS elemental mapping (Fig. 2g)with uniform distribution of C, N, O, Fe and Ni.
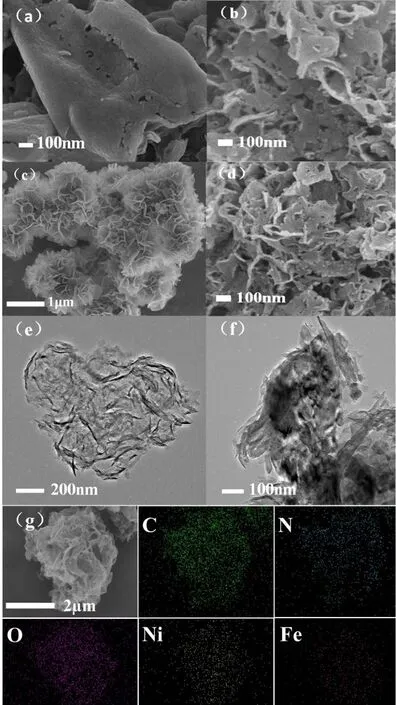
Fig. 2 FESEM images of the samples: (a) bulk CN, (b) CN nanosheets, (c) FeNi-LDH, (d) CN/LDH4; TEM images of the samples: (e) CN nanosheets and (f) CN/LDH8; (g) EDS of CN/LDH8.
3.3 XPS and elemental analyses
The chemical state and environment of the elements in the samples are analyzedviaXPS analysis. The XPS survey spectra of CN/LDH4 (Fig. 3a) suggest the existence of C, N, Fe, Ni and O. Fig. 3b displays the high-resolution C 1sspectrum, in which two peaks are located at 284.8 and 288.3 eV, respectively. The peak at 288.3 eV is attributed to thesp2-hybridized carbon14,30,31.While the peak at 284.8 eV is assigned to adventitious carbon on the surface32. The high-resolution spectrum of N 1s(Fig. 3c) can be deconvoluted into four peaks at 398.4, 399.7, 400.7 and 404.3 eV, respectively. The peak at 398.4 eV corresponds to thesp2-hybridized nitrogen atom bonded to two carbon atoms33,34.While the peak at 399.7 eV corresponds to the nitrogen atom connected to three carbon atoms35,36. The weak peak at 400.7 eV assigned to the C=N―H group37,38. The characteristic peak at 404.3 eV can be ascribed to theπexcitation in the conjugated system39,40. The Fe 2pspectrum (Fig. 3d) can be fitted into two peaks at 712.4 and 725.5 eV, respectively, which can be assigned to Fe3+. The former is related to the Fe 2p3/2orbit, and the latter can be ascribed to the Fe 2p1/2orbit41,42. The high-resolution XPS spectrum of Ni 2p(Fig. 3e) displays four peaks at the binding energy of 856.1, 861.9, 873.8 and 880.0 eV. The peaks at 856.1 and 861.9 eV are assigned to the Ni 2p3/2orbit, and the peaks at 873.8 eV and 880.0 eV are assigned to the Ni 2p1/2orbit,in agreement with the feature of divalent Ni43,44. In the highresolution spectrum of O 1s(Fig. 3f), the peak at 531.7 eV can be ascribed to the signal of Fe―OH or Ni―OH. The real loading amount of Fe and Ni measured by ICP-AES were shown in Table 1. The amount of C, N, H in bulk CN and CN nanosheets determined by an elemental analyzer was shown in Table 2.
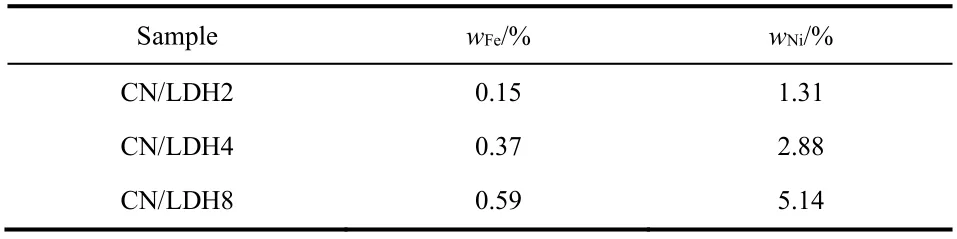
Table 1 Physical property of CN/LDH2, CN/LDH4, CN/LDH8.

Table 2 The elemental analysis of bulk g-C3N4 and g-C3N4 nanosheets.
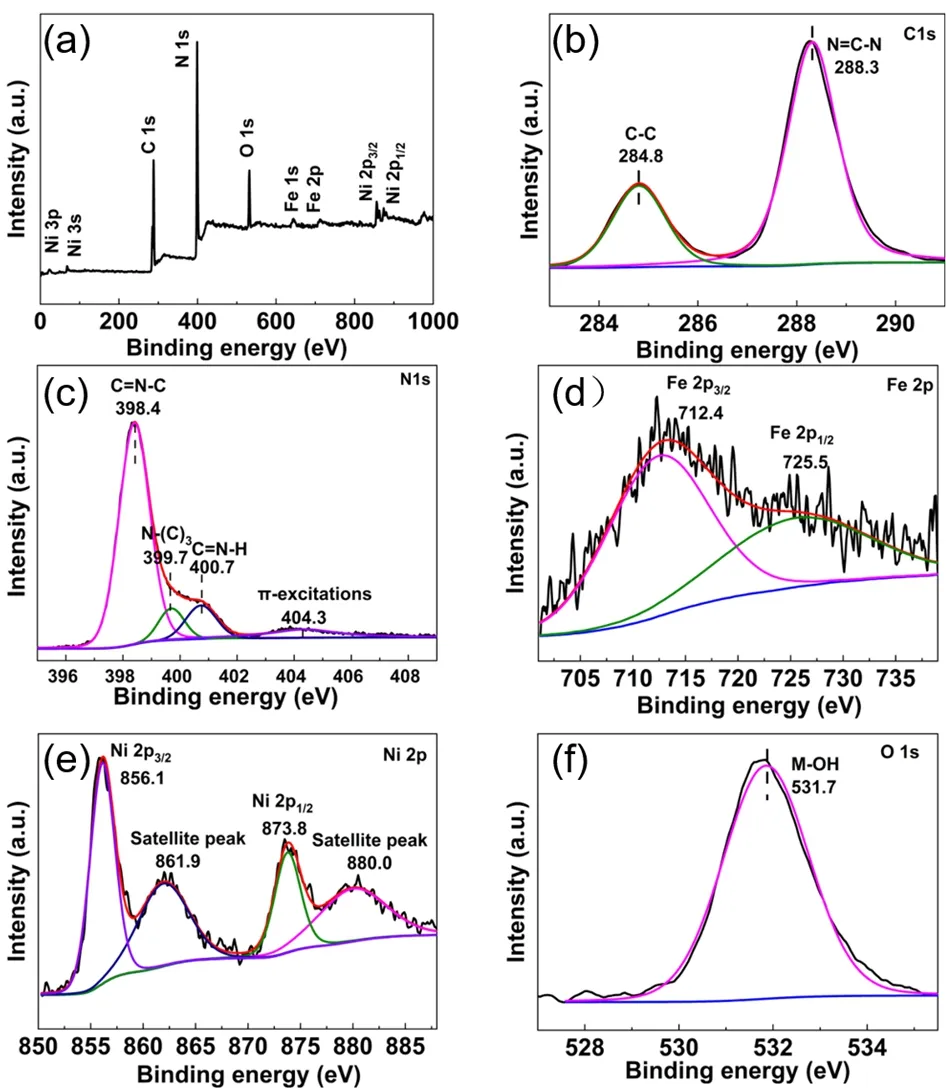
Fig. 3 (a) XPS survey spectra, high-resolution XPS spectra of(b) C 1s, (c) N 1s, (d) Fe 2p, (e) Ni 2p and (f) O 1s of the CN/LDH4 photocatalyst.
3.4 N2 adsorption-desorption isotherms
N2adsorption-desorption isotherms were conducted to study the specific surface area and pore size distribution of bulk CN,CN nanosheets, LDH and CN/LDH4, as shown in Fig. 4.According to the Brunauer-Deming-Deming-Teller classification, all the samples were classified as type IV isotherms45,46. In addition, all the samples show H3-type hysteresis loops, indicating the formation of slit hole originated from the sheet-like accumulation22,47. The pore size distribution of all samples display a wide range from 2 to 120 nm, confirming the presence of mesopores and macropores. From Table 3, it can be found that the specific surface area of the CN nanosheets (97 m2·g-1) is more than twice that of the bulk CN (42 m2·g-1).Moreover, the pore volume of g-C3N4nanosheets (0.5 cm3·g-1)is much higher than that of bulk g-C3N4(0.2 cm3·g-1), suggesting the presence of smaller pores in g-C3N4nanosheets. Pure FeNi-LDH possesses a specific surface area of 170 m2·g-1and abundant mesopores. Note that with the increasing amount of FeNi-LDH, the specific surface area of the composite samples does not change obviously. Therefore, the change in specific surface area does not contribute much on the improvement of the performance.

Table 3 Comparison of the specific surface areas, pore volumes and average pore size.
3.5 CO2 adsorption
Fig. 5 shows the CO2adsorption curves of CN, CN/LDH4,bulk CN and LDH. As increasing the relative pressure, the amount of adsorbed carbon dioxide increases in the entire pressure zone. CN shows a larger adsorption capacity than that of the bulk CN, which can be attributed to the larger specificsurface area. Meanwhile, the pure FeNi-LDH has a much higher adsorption capacity, caused by theincreasedspecificsurfaceareaandalkaline nature of iron and nickel. In particular, the CO2adsorption ability of CN/LDH4 is better than that of CN, which can be attributed to the synergy betweenthetwocomponents.Such an enhancement is beneficial to improve the performanceof photocatalytic CO2reduction, as the first step of the photocatalytic reduction of CO2is to adsorb CO2molecules on the surface of the photocatalyst48-51.
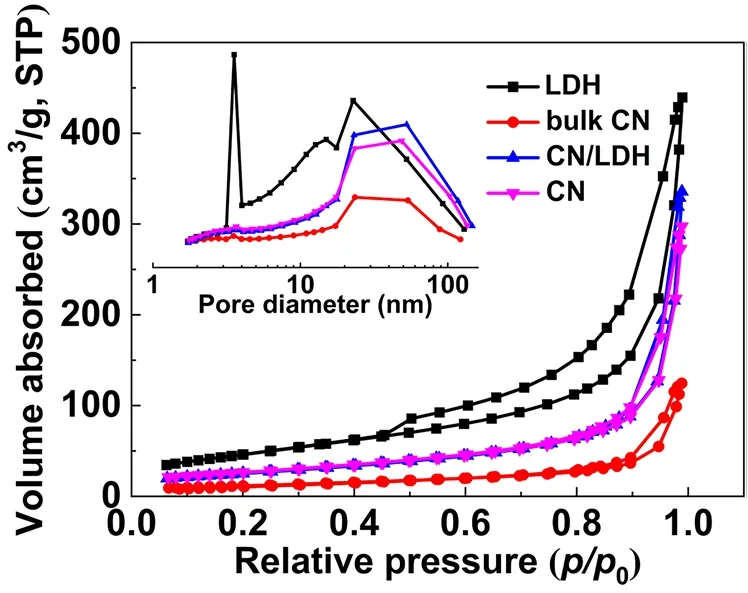
Fig. 4 N2 adsorption-desorption isotherms and the pore-size distribution curves (inset) of bulk CN, CN nanosheets, CN/LDH4 and LDH.
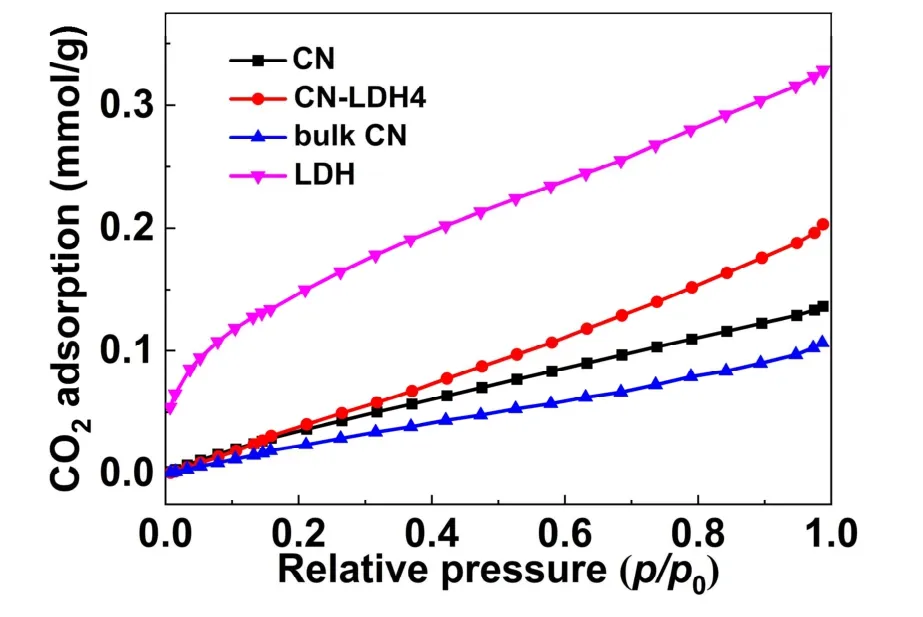
Fig. 5 CO2 adsorption curves of CN, CN/LDH4, bulk CN and LDH photocatalysts.
3.6 UV-Vis diffuse reflectance spectra
Fig. 6 displays the UV-Vis DRS spectra of CN, CN/LDH2,CN/LDH4, CN/LDH8 and LDH. The absorption edge of g-C3N4is around 430 nm, corresponding to visible-light absorption.Compared with pristine g-C3N4, FeNi-LDH/g-C3N4composite photocatalyst shows stronger absorption in the full region. With increasing the amount of the FeNi-LDH, the light absorption of the composite sample increases due to the excellent absorption ability of FeNi-LDH52. In addition, the band gap of FeNi-LDH/g-C3N4composite photocatalysts does not change,revealing that no doping effect occurred.
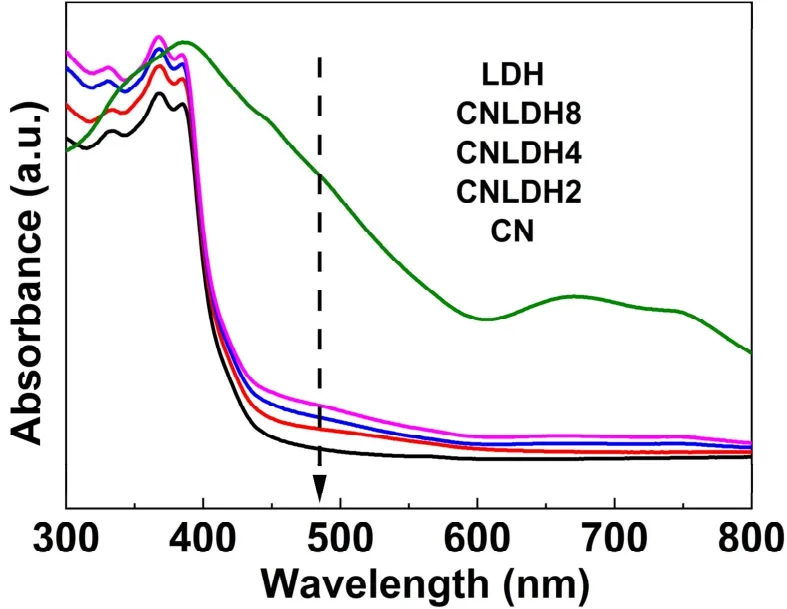
Fig. 6 UV-Vis diffuse reflectance spectra of CN, CN/LDH2,CN/LDH4, CN/LDH8 and LDH samples.
3.7 Photocatalytic CO2 reduction performance
The photocatalytic performance of the samples was measured under the full-spectrum xenon lamp irradiation. Fig. 7 shows the CO2reduction activity of the samples. Pure g-C3N4shows a low rate of methanol production of 0.25 μmol·h-1·g-1. Importantly,the CO2reduction activity of g-C3N4decorated with FeNi-LDH is significantly improved. In detail, when the amount of FeNi-LDH is 2%, the rate of methanol production was 1.09 μmol·h-1·g-1. The CN/LDH4 exhibits the best performance,which is ~6 times (1.64 μmol·h-1·g-1) than that of the pure g-C3N4.
3.8 Essence of photocatalytic performance enhancement
Photoluminescence measurement can be used to roughly evaluate the separation efficiency of photogenerated carriers53,54.A smaller intensity of the luminescent characteristic peaks indicates a better transfer efficiency of the photoinduced charges55,56. Fig. 8 shows that all samples have a main peak at~430 nm, which is caused by the electron transition of theπ-π*orbit in the triazine ring of g-C3N4. After loading FeNi-LDH, the peak intensity is obviously reduced. Particularly, the peak intensity of CN/LDH4 is the weakest, indicating its best charge transfer efficiency57. In other word, the introduction of FeNi-LDH could suppress the recombination of photogenerated charges.
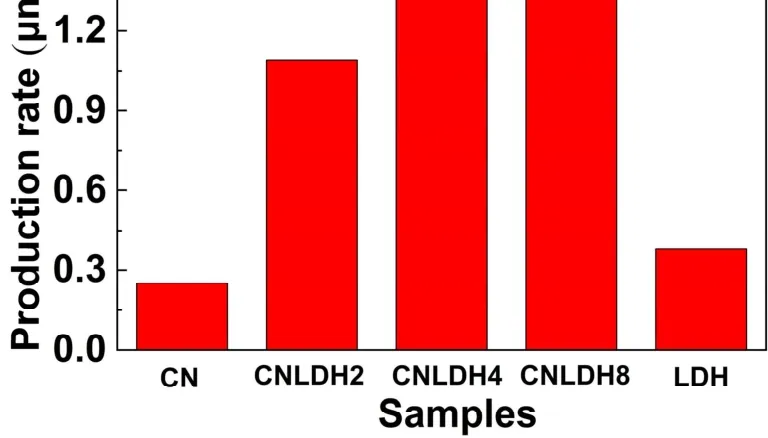
Fig. 7 CO2 reduction rates of CN, CN/LDH2, CN/LDH4, CN/LDH8 and LDH photocatalysts.
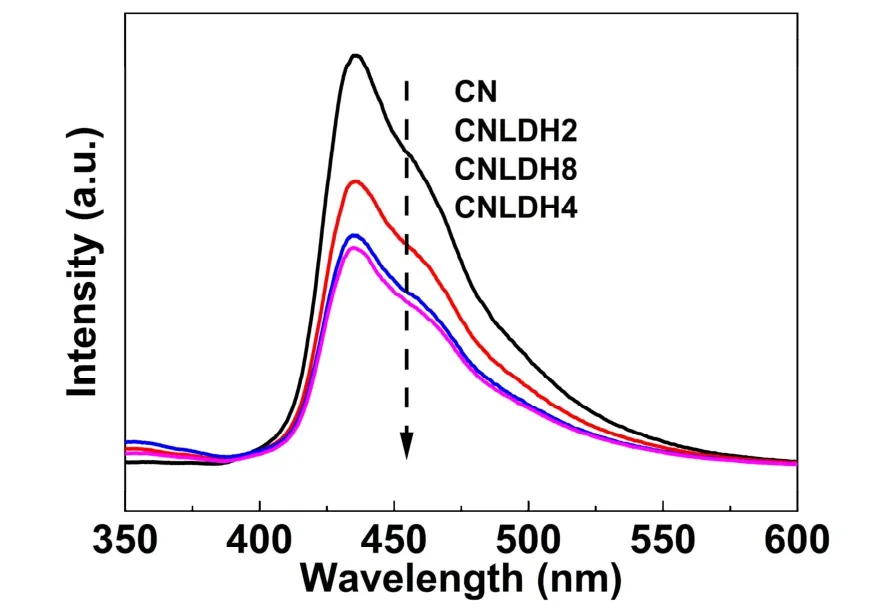
Fig. 8 PL spectra of CN, CN/LDH2, CN/LDH4 and CN/LDH8 photocatalysts.
Electrochemical impedance spectra and transient photocurrent responses were performed to further investigate the charge transfer property of CN, CN/LDH4 and LDH. The experiments were tested in 0.5 mol·L-1Na2SO4solution and a standard three-electrode system was used58. Fig. 9 shows the EIS Nyquist plots of CN, CN/LDH4 and LDH. In the analog equivalent circuit,RpandRsrepresent the resistance of the charge transfer in the tested sample and the total resistance in the electrolyte, respectively. And CPE1 represents a double-layer capacitor located at the interface between electrolyte and counter electrode. Normally, the smaller the size of the curve radius, the smaller the impedance and thus the better transfer performance of photoinduced charges59,60. Note that CN/LDH4 has the smallest radius, again demonstrating its best charge transfer property61-63. This could be further confirmed by the much larger photocurrent of CN/LDH4 than that of CN (Fig. 10).

Fig. 9 EIS plots of CN, CN/LDH4 and FeNi-LDH photocatalysts in 0.5 mol·L−1 Na2SO4 solution.

Fig. 10 Transient photocurrent curves of CN and CN/LDH4 photocatalysts
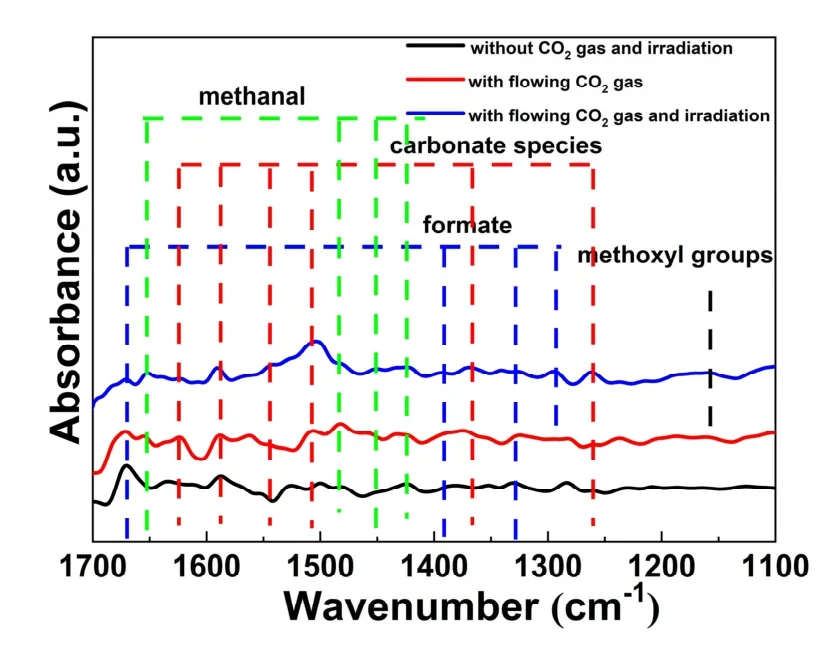
Fig. 11 The in situ FTIR spectra of the CN/LDH4 sample.
3.9 in situ FTIR spectra
Thein situFTIR spectra of CN/LDH4 were carried out to study the intermediate products of photocatalytic CO2reduction.As displayed in Fig. 11, the peaks at 1670, 1390, 1326 and 1291 cm−1belong to formate64-68. The peaks at 1625, 1589, 1543,1507, 1365 and 1262 cm−1are ascribed to the carbonate species69-74. The peaks at 1652, 1485, 1451 and 1424 cm−1are ascribed to methanal70,75. Besides, the peak at 1158 cm−1is assigned to methanol66,76. These results reveal that the photocatalytic CO2reduction is a complicated multi-step reaction, forming several intermediate products, such as formic acid and formaldehyde. As a result, the final product is CH3OH.
4 Conclusions
In summary, CN nanosheets with a large specific surface area of 97 m2·g-1is obtained by a simple two-step calcining method.Then the 2D/2D FeNi-LDH/CN heterojunction was constructed by a hydrothermal method. The FeNi-LDH/CN composite photocatalysts showed a greatly improved photocatalytic CO2reduction activity compared with pristine CN. The optimum loading amount of FeNi-LDH cocatalyst is 4% (w), and the rate of producing methanol reaches 1.64 μmol·h-1·g-1, which is ~6 times than that of the pristine CN. A series of characterization and analysis demonstrate that the introduction of FeNi-LDH can improve the ability of adsorbing CO2and light absorption, and effectively facilitate the separation of photogenerated charge carriers.
杂志排行

物理化学学报的其它文章
- 基于密度泛函理论下H2S 在单原子催化剂V/Ti2CO2 上的分解机理研究
- 富含缺陷的2D/2D 异质结促进光催化清洁能源转化
- Development of Iron-Based Heterogeneous Cocatalysts for Photoelectrochemical Water Oxidation
- 二维光催化材料电子结构和性能调控策略研究进展
- Defect Engineering in Two-Dimensional Graphitic Carbon Nitride and Application to Photocatalytic Air Purification
- Non-Noble-Metallic Cocatalyst Ni2P Nanoparticles Modified Graphite-Like Carbonitride with Enhanced Photocatalytic Hydrogen Evolution under Visible Light Irradiation