Numerical simulation of carbon arc discharge for graphene synthesis without catalyst
2021-07-07KaiYE叶凯DaZHANG张达KaiwenZHANG张楷文HaoyuWANG王灏宇FengLIANG梁风WenhuiMA马文会BinYANG杨斌andYongnianDAI戴永年
Kai YE(叶凯),Da ZHANG(张达),Kaiwen ZHANG(张楷文),Haoyu WANG(王灏宇),Feng LIANG(梁风),2,Wenhui MA(马文会),Bin YANG(杨斌) and Yongnian DAI(戴永年)
1 Faculty of Metallurgical and Energy Engineering,Kunming University of Science and Technology,Kunming 650093,People’s Republic of China
2 State Key Laboratory of Complex Nonferrous Metal Resources Clean Utilization,Kunming University of Science and Technology,Kunming 650093,People’s Republic of China
Abstract In this study,graphene sheets are prepared under a hydrogen atmosphere without a catalyst,and the growth mechanism of graphene by direct current arc discharge is investigated experimentally and numerically.The size and layer numbers of graphene sheets increase with the arc current.Distributions of temperature,velocity,and mass fraction of carbon are obtained through numerical simulations.A high current corresponds to a high saturation temperature,evaporation rate,and mass density of carbon clusters.When the carbon vapor is saturated,the saturation temperatures are 3274.9,3313.9,and 3363.6 K,and the mass densities are 6.4×1022,8.42×1022,and 1.23×10²³ m−3 under currents of 150,200,and 250 A,respectively.A hydrogen-induced marginal growth model is used to explain the growth mechanism.Under a high current,the condensation coefficient and van der Waals force increase owing to the higher saturation temperature and mass density of carbon clusters,which is consistent with experimental results.
Keywords:graphene,arc discharge,numerical simulation,growth mechanism,saturation temperature,mass density
1.Introduction
Direct current(DC)arc discharge is an efficient and environment-friendly method for the controllable preparation of graphene[1–3].The products yielded contain high purity and few layers with a high preparation efficiency[4,5].Currently,DC arc discharge for the synthesis of graphene includes catalyst-based and catalyst-free methods.However,the large-scale fabrication of graphene sheets using the DC arc discharge method[6,7],which is controlled by parameters such as the atmosphere,pressure,current,and catalyst[3,5,8–10],remains challenging.To obtain the best synthesis conditions,the growth mechanism of graphene must be further investigated.
Because the DC arc discharge method involves hightemperature and complex electromagnetic interactions[11,12],the growth process of graphene is difficult to explain using only limited experimental results.Numerical simulation is effective for understanding the physical characteristics of arc plasma and has been adopted to explain the growth mechanism of carbon nanotubes,thereby enabling the growth mechanism of graphene to be elucidated[13,14].For instance,Tewariet al[15]presented a growth model of a graphene–carbon nanotube hybrid under catalyst conditions via numerical simulations.The growth of the graphene–carbon nanotube hybrid occurred after the fragmentation of catalyst particles.It was discovered that the size of the products was affected by the ionization degree,gas type,and input power.High concentrations and ionization of hydrocarbons were more conducive to the growth of the graphene–carbon nanotube hybrid.Kundrapuet al[16]obtained the distribution of temperature and species density by simulating a carbon arc.The growth region of the carbon nanotube was determined based on catalyst clusters,which corresponded to a temperature range between the solidification point and the condensation point of nickel.Based on the above-mentioned numerical simulation studies involving the use of catalysts,it was discovered that the growth of graphene was governed by the nucleation of catalyst particles,which were easy to control.Furthermore,the growth temperature of graphene was reduced owing to catalytic DC arc discharge[16],thereby resulting in a low cost for large-scale synthesis.
However,in the growth of graphene,an obstacle to the development of catalytic DC arc discharge is that the final product comprises graphene and the catalyst.These elements must be separated via post-transfer or magnetic separation[2].Cracks on the surface and interface,contamination,and wrinkles are present in the separation process[17],resulting in the poor quality of graphene.As for catalyst-free DC arc discharge in a reactive atmosphere,the introduction of impurities and damage to the graphene lamellar structure is prevented.This technique is more promising for the largescale preparation of high-quality graphene,although the growth mechanism is more complex and remains unclear.Studies regarding the growth mechanism of graphene without a catalyst via numerical simulation have not been reported hitherto.However,some inspirations can be obtained from relevant studies pertaining to carbon nanotubes and carbon nanoparticles.Mansouret al[18]simulated carbon arcs for the synthesis of single-walled carbon nanotubes.The energy equations for the electrons and heavy species were solved separately to obtain their temperatures.To obtain the number densities of multiple species,individual continuity equations,electron impact reactions,and chemical reactions among heavy species were coupled and solved.It was discovered that the change in the number density distributions was driven by the forms of anode ablation,which significantly affected the growth process.Yatomet al[19]investigated the growth region of carbon nanoparticles in an atmospheric pressure carbon arc.Combining with the two-dimensional computational fluid dynamic simulations and the thermodynamic modeling,the equation for the average diameter of carbon nanoparticles was established.It was proportional to the residence time in the growth region and the initial densities of particles at the starting location of condensation.In the above researches,the method for simulating the mass densities of carbon clusters has been reported,but the growth mechanism could not be explained using a specific growth model.Therefore,it is indispensable to investigate the growth mechanism of graphene without a catalyst and establish a growth model,which will contribute significantly to the development of graphene synthesized via DC arc discharge.
In this study,graphene sheets were synthesized via DC arc discharge without a catalyst.The effect of the current on the size and number of layers of graphene is discussed.Moreover,the distributions of temperature,velocity,and mass density of carbon clusters were calculated via numerical simulations.Based on our proposed hydrogen-induced marginal growth model[20],the effects of saturation temperature and mass density of carbon clusters on the growth process of graphene are explained.
2.Experiment
Graphene sheets were synthesized using the DC arc discharge method.Figure 1 shows a schematic diagram of a DC arc discharge furnace.The two electrodes used were 99.999%pure graphite rods measuring 10 mm in diameter and 10 cm in length.The anode was placed on top of the water-cooled copper substrate,and the cathode was located above it.The cathode was sharpened,and the vertical length of the tip was 7 mm.Before discharge,the chamber was pumped into a vacuum.Subsequently,H2(99.99% purity)with a constant pressure of 70 kPa was injected as the buffer gas.The currents were set to 150,200,and 250 A to investigate their effects on the growth mechanism of graphene.By mechanically adjusting the height of the cathode,the distance between the two electrodes was maintained at 1 mm to ensure the stability of the carbon arc.After 10 min of evaporation,the products were obtained from the inner walls of the chamber.The morphology and nanostructure of the graphene sheets were analyzed using transmission electron microscopy(TEM,JEM-2100,JEOL,Japan)with an accelerating voltage of 200 kV.
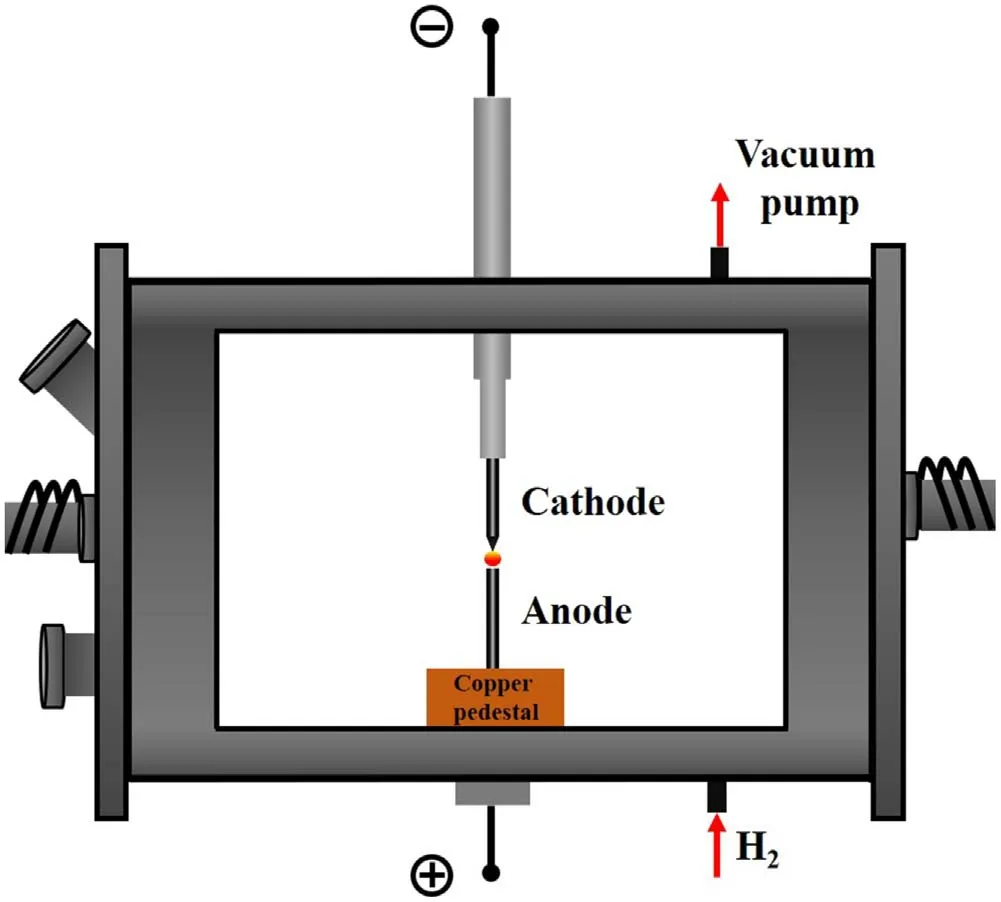
Figure 1.Schematic diagram of DC arc discharge furnace for preparing graphene sheets.
3.Numerical simulation
Numerical simulations were performed based on the synthesis conditions using COMSOL Multiphysics software.First,a free mesh was used to partition the mesh.Owing to the large current density gradient of the electrode boundaries and the velocity gradient of the chamber boundaries,fine meshes were required near these boundaries.Subsequently,the Joule heat and Lorentz force were set to the loads of the temperature and velocity fields,respectively.The electromagnetic,temperature,and velocity fields were synchronously coupled using the above-mentioned settings.To simplify the simulation calculation of plasma,the following conditions were assumed[18,21–27].(a)The arc plasma is under local thermodynamic equilibrium(LTE).Based on the same temperature for the electrons and heavy particles,the scale of the arc plasma is much larger than the Debye length.Therefore,the arc plasma is in a quasi-electric neutral state.(b)The laminar flow is in a steady-state and exhibits two-dimensional axial symmetry owing to the constant evaporation rate achieved by maintaining the distance between the two electrodes.(c)The plasma is optically thin,therefore,the radiation trapping in the plasma is negligible.(d)Gravity is negligible,and the flow direction of the arc plasma is only affected by the Lorentz force.(e)The effect of the electrode sheath is not considered.For the DC arc discharge,the gas dynamics of the arc discharge is primarily based on the assumption of LTE.
3.1.Magnetohydrodynamic equations
Temperature and velocity fields were obtained by solving the magnetohydrodynamic equations.The mass conservation,momentum conservation,and energy conservation equations are shown in equations(1)–(3)[16,23],respectively.Maxwell’s equations[28]are shown in equations(4)–(6)

where ρ andare the density and velocity vector,respectively

where μ is the viscosity coefficient;pis the pressure;andare the vectors of the current density and magnetic induction,respectively.The last term on the right-hand side of the equation represents the Lorentz force

In equation(3),His the enthalpy;Cpis the specific heat at constant pressure;kBis the Boltzmann constant;kand σ are the thermal and electrical conductivities,respectively;Qrrepresents the radiation loss per unit volume.The last term on the left-hand side of the equation represents the Joule heat.To solve the terms of the Lorentz force and Joule heat,Maxwell’s equations are expressed as


where Φ and μ0are the electric potential and vacuum permeability,respectively.
A two-dimensional axisymmetric domain with a length and width of 70 and 61 mm,respectively,was used as the computational region of the plasma.The boundary conditions are illustrated in figure 2.In the electromagnetic field,the current density was applied to the anode surface,and the electric potential of the cathode tip was maintained at a constant value.All other boundaries were set as electric and magnetic insulation.In reality,the cathode tip is the closest to the anode and exhibits the largest potential gradient at its boundary layer,resulting in the maximum cathode current density.The cathode might ionize at high temperatures.This is consistent with the experimental observation that the cathode tip will be flattened slightly after discharge.However,anode evaporation is primarily considered in the preparation of graphene via arc discharge,and the products are obtained from only the inner walls instead of the cathode deposits[29].Based on this point,the ionization effect is only considered at the cathode tip,and the temperature of the cathode tip was set to 4000 K.The temperature of the cathode surface was a linear function from 4000 to 1000 K.Using the Langmuir model,a heat flux boundary was applied to the anode surface,where the anode sheath drop was disregarded and set to zero[12]:
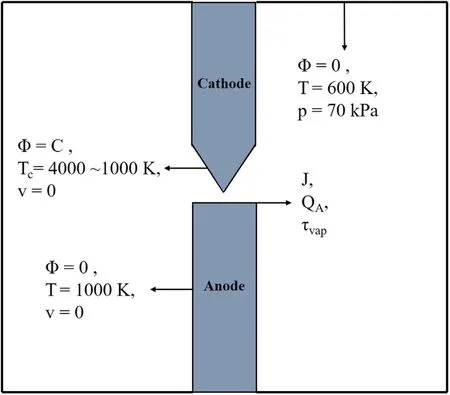
Figure 2.Axisymmetric domain of plasma region with boundary conditions.

whereRAis the radius of the anode;Teis the electron temperature on the anode surface in eV;Φwis the work function of graphite;ΔH,Cp,andT0are the latent heat of evaporation,specific heat of carbon,and initial anode temperature,respectively.TA,which is the average temperature on the anode surface,is higher than the melting point of graphite,whereas τvaprepresents the mass flux of evaporation in kg m−2s−1.TAwas maintained at a constant value during the steady-state evaporation process of the anode.The temperatures of the other electrode and surrounding boundaries were set to 1000 and 600 K,respectively[30].
For the boundaries of the velocity field,the anode surface was the inlet,and the surrounding boundaries were outlets with a constant pressure of 70 kPa.The other boundaries of the electrode and chamber were defined as walls.The inlet boundary condition is expressed by the mass flux of evaporation as follows[31]:

Equation(8)is based on the Hertz–Knudsen relation,wheremCis the mass of a carbon atom,andpCis the pressure of carbon vapor in mmHg underTA,calculated using the Antoine equation as follows:

3.2.Carbon vapor mass conservation equation
Snyderet al[32]investigated the diffusion of hydrogen species in free-combustion arc discharge.It was shown that the formation temperature of hydrogen atoms by the ionization of H2molecules was 3000 K,and only hydrogen atoms existed in the temperature range of 4000–10 000 K.According to Byszewski[33],carbon atoms,carbon ions,C2molecules,and C3molecules dominated the arc plasma region.At temperatures above 4000 K,the carbon atom content was the highest among these carbon clusters.Therefore,hydrogen and carbon atoms were used to calculate the diffusion coefficients.
The concentration of carbon was calculated using the equation of carbon vapor mass conservation as follows[34]:

In equation(10),the three terms on the left-hand side of the equation represent the time,diffusion,and convection terms,respectively,whereYCandJCrepresent the mass fraction and mass flux of carbon,respectively.The carbon vapor source term(mass per unit volume and time)can be written as[34]

In the equation above,ΔV/ΔSrepresents the width of the control body adjacent to the surface,and τdepis the deposition flux of carbon expressed as[35]

The combined diffusion coefficient method was used to calculate the mass flux of carbon vapor.Among its simplified forms,a good approximation was indicated when the ‘combined ordinary diffusion coefficient mass fraction gradient’approach was used[34].In this method,only the ordinary diffusion coefficient was calculated.The pressure,electric field,and temperature diffusion coefficients were not considered.Therefore,the mass flux of carbon vapor can be written as[34,36]

wherenis the number density,mHthe mass of a hydrogen atom,andxHthe mole fraction of hydrogen atoms.is the ordinary diffusion coefficient between carbon and hydrogen atoms;it can be expressed by the simplified form of Fick’s law,i.e.

In equation(14),MC,MH,VC,andVHrepresent the molar masses and molecular diffusion volumes of carbon and hydrogen atoms,respectively.In this study,VC=1.59×10⁻⁵m3mol−1andVH=2.31×10⁻⁶m3mol−1.
For the boundary condition,the anode surface was maintained at a constant mass fraction as follows[37]:

wherepatmis the atmospheric pressure,andMH2is the molar mass of H2molecules.
4.Results and discussion
4.1.TEM images
Figure 3 shows the TEM images of graphene sheets synthesized via DC arc discharge at 150,200,and 250 A.The products exhibited a two-dimensional lamellar structure.The size of the graphene sheets was calculated from the statistical results by counting 200 graphene sheets measuring 50–200 nm from 20 TEM images.The average sizes of the graphene sheets under 150,200,and 250 A were 93.5,119.6,and 138.0 nm,respectively.The rich-wrinkled morphology was located at the edges of the graphene sheets,which indicated that the stacking process occurred at these positions.Furthermore,the number of layers of graphene sheets can be estimated from the graphene edges in high resolution transmission electron microscopy images,and they were primarily 4–7,4–10,and 5–12 layers under 150,200,and 250 A,respectively.The results based on different currents indicate that a high current corresponds to graphene sheets of a larger size and higher layer number that tends to stack at the edges.
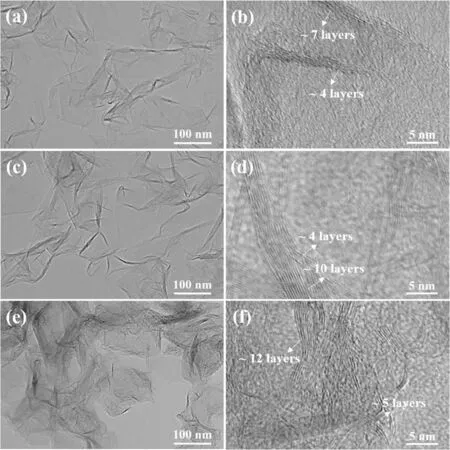
Figure 3.TEM images of graphene sheets and HRTEM images of graphene edges under different currents:(a),(b)150 A,(c),(d)200 A,and(e),(f)250 A.
4.2.Simulation results
Figure 4 shows the distributions of temperature under 150,200,and 250 A,respectively.As shown in figure 4(a),the highest temperature of approximately 9250 K was recorded at the center of the two electrodes.Subsequently,the temperature decreased in the direction away from the electrodes owing to the decrease in the Joule heat with the current density.Moreover,the temperature distribution on the anode surface was not uniform,and the values ofTAwere 4119.6,4203.1,and 4299.7 K under 150,200,and 250 A,respectively.The corresponding mass fluxes of evaporation were 5.81,8.22,and 12.08 kg m−2s−1,respectively,as calculated using equation(8).Figure 5 shows the profiles of the velocity field at currents of 150,200,and 250 A,respectively.As shown in figure 5(a),the carbon vapor evaporated from the anode surface with a velocity of 90.2 m s−1and accelerated to 153.3 m s−1near the cathode.The velocity decreased gradually along the trajectory owing to expansion and reduced to zero in the walls of the chamber.To calculate the mass fraction,equation(10)is written in the form of the custom ‘partial differential equations’ module in COMSOL Multiphysics and then solved.Figure 6 shows the mass fraction profiles of carbon at currents of 150,200,and 250 A.The highest mass fractions of carbon were 66%,76%,and 83% on the anode surfaces,respectively.At a high current,the anode evaporation enhanced owing to the higher anode temperature,which corresponds to a higher initial condition of the mass fraction.In addition,the diffusion coefficient between carbon and hydrogen atoms was proportional to temperature,i.e.it was larger near the electrodes.Therefore,the mass fraction decreased rapidly at first in the direction away from the electrodes and then decreased slowly because of the lower diffusion coefficient.
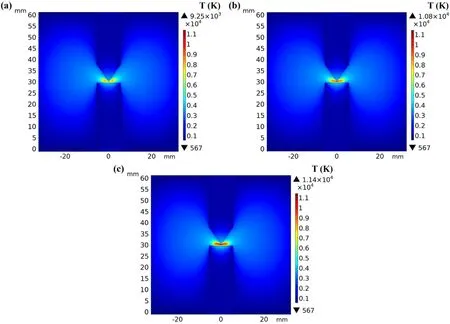
Figure 4.(a)–(c)Temperature profiles under 150,200,and 250 A,respectively.
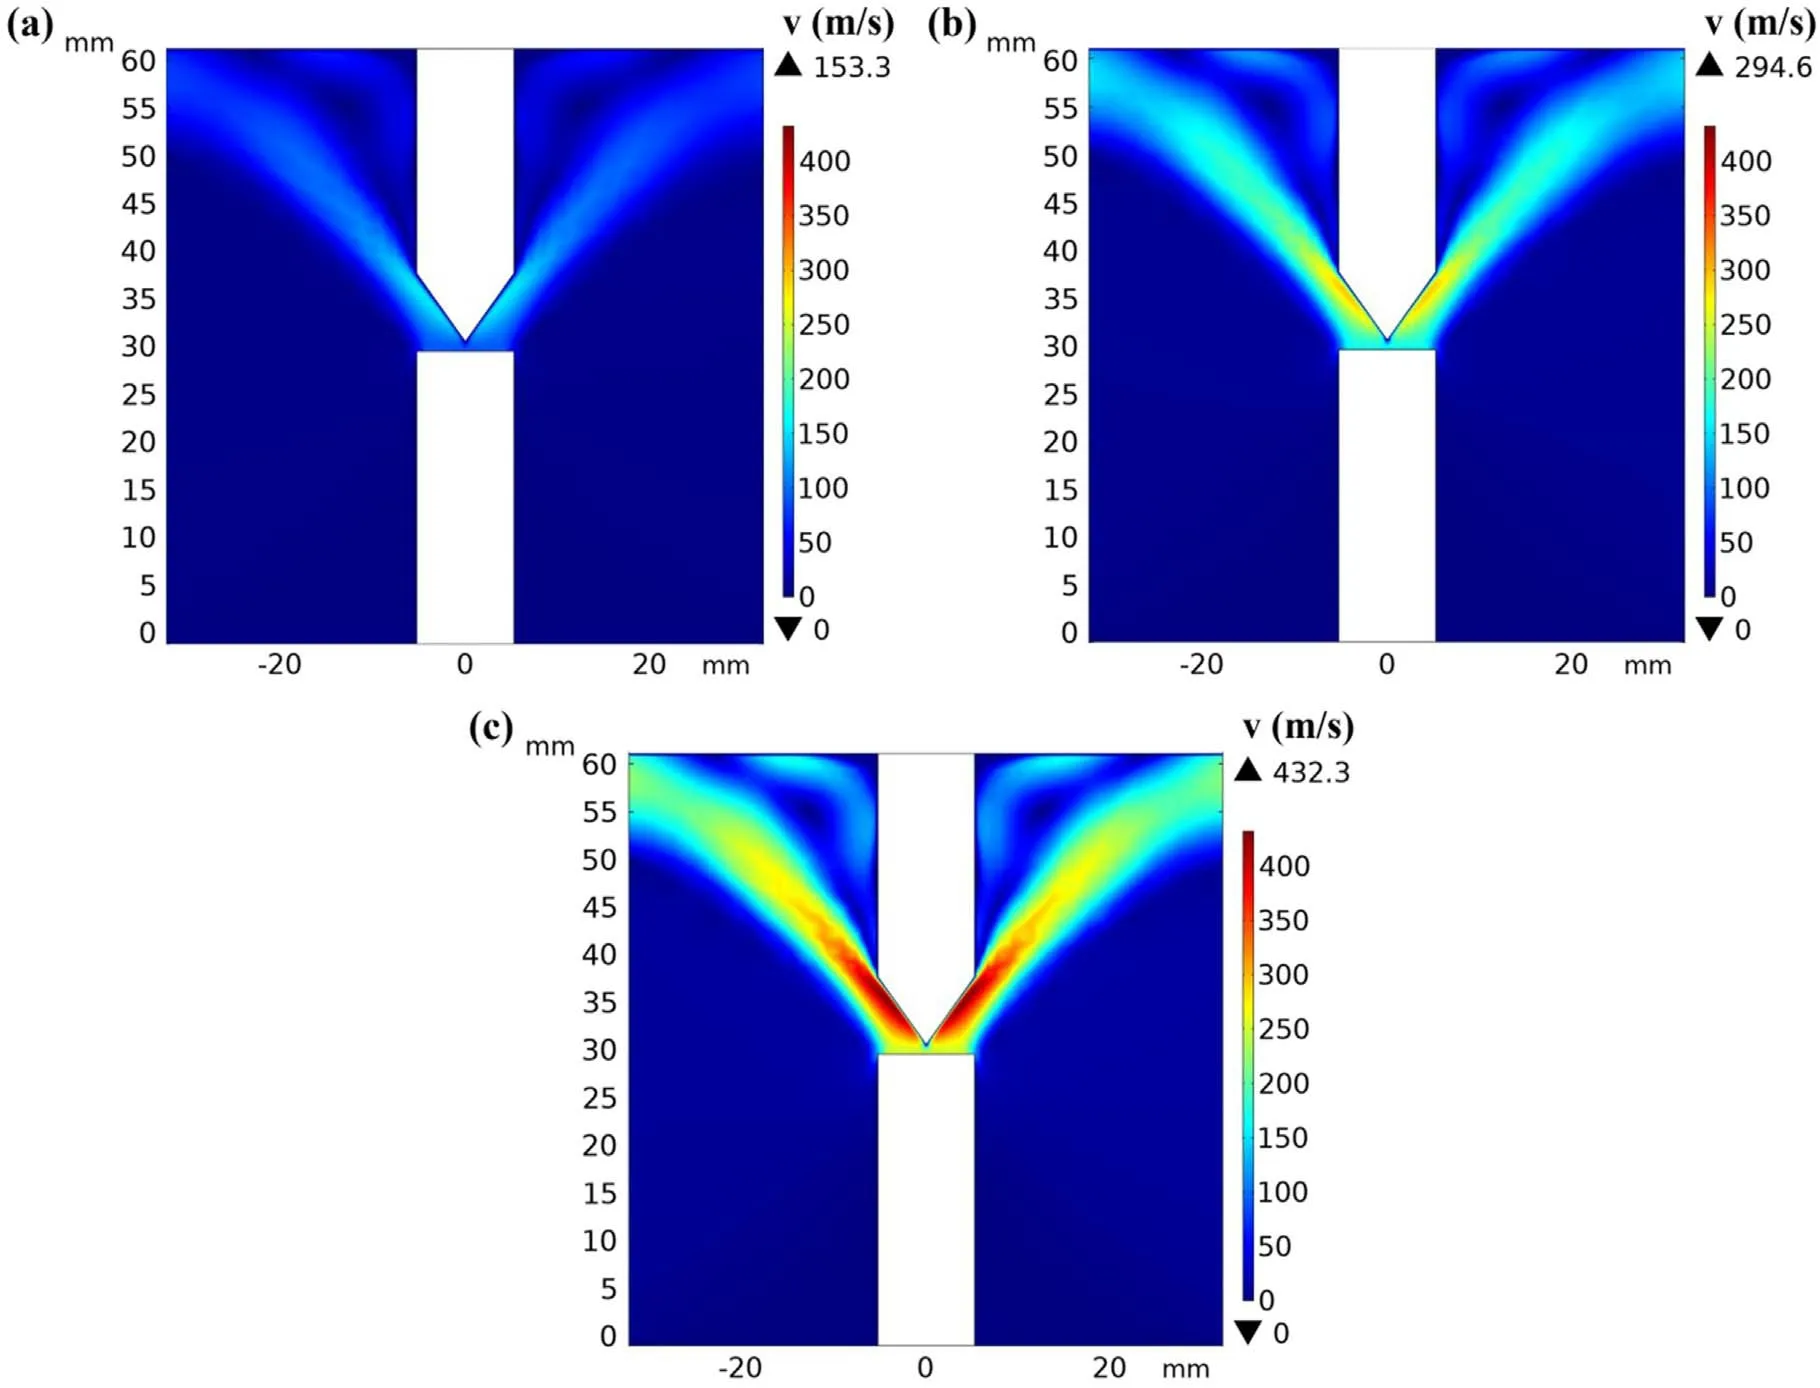
Figure 5.(a)–(c)Velocity profiles under 150,200,and 250 A,respectively.
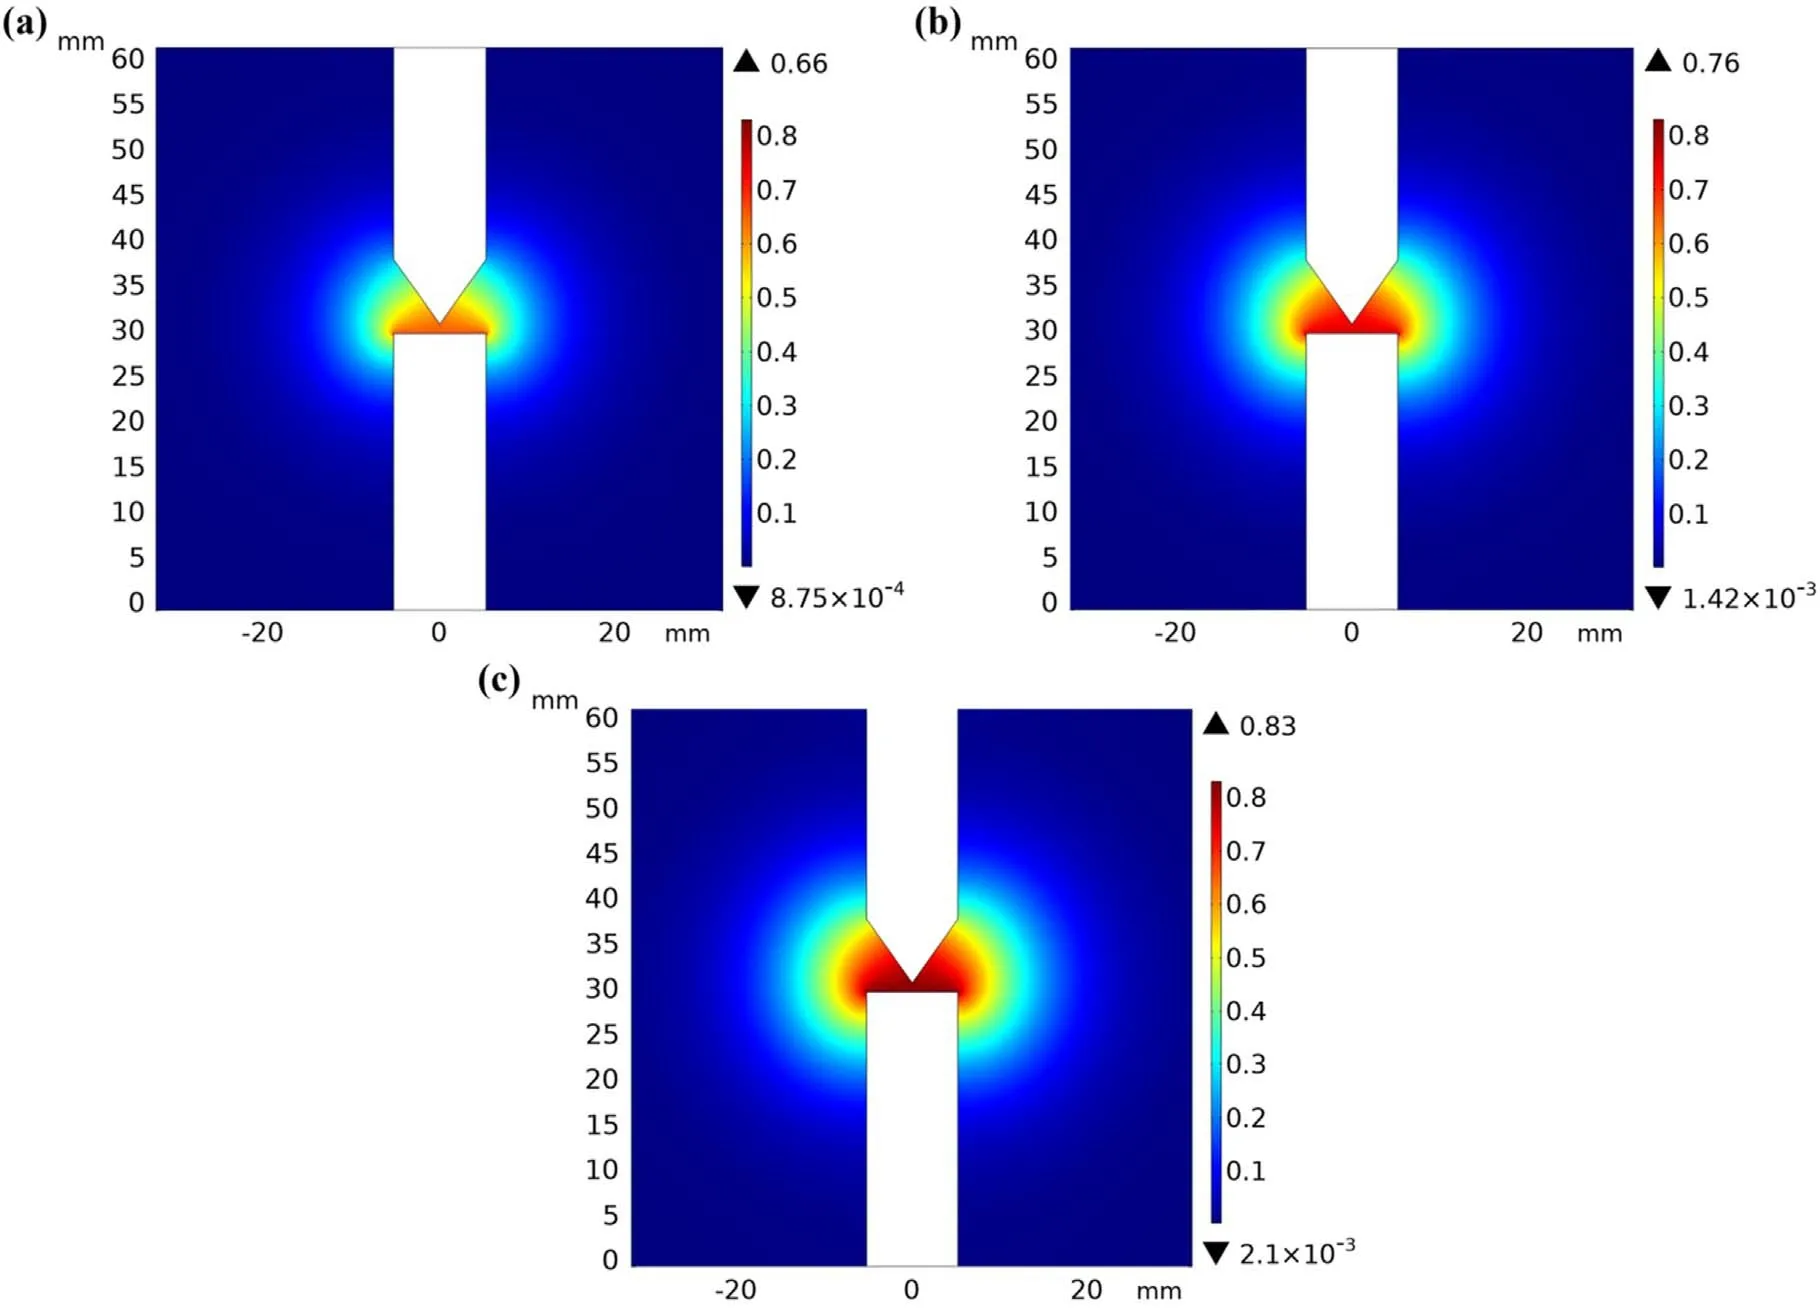
Figure 6.(a)–(c)Mass fraction distributions of carbon under 150,200,and 250 A,respectively.
4.3.Growth region of graphene
During the growth of graphene under hydrogen plasma,the enclosing of graphene sheets is prevented by the reaction between the hydrogen species and carbon clusters[8].Therefore,the growth of graphene begins at the saturation temperature of the carbon vapor and ends at the formation temperature of hydrogen atoms.S=pC/pSexpresses the supersaturation ratio of carbon,wherepCis the pressure of carbon in the carbon–hydrogen mixture,andpSis the saturation pressure of carbon vapor[38].The value ofpCwas provided by the simulation results of the carbon mass fraction,andpSwas obtained from equation(9).WhenS=1,the lamellar structure of graphene began to form through the condensation of carbon clusters.The saturation temperatures of carbon vapor were 3274.9,3313.9,and 3363.6 K at currents of 150,200,and 250 A,respectively.To provide important theoretical bases for explaining the growth mechanism of graphene,distributions of mass density of carbon clusters in the growth region under different arc currents are presented in figure 7.Because of the different streamline directions,the temperature in the horizontal direction from the center between two electrodes was selected to express the temperature range in the growth region.Figure 7 demonstrates the relationship among temperature,mass density of carbon clusters,and coordinates of streamlines on the horizontal axis;as shown in the figure,the mass density of the carbon clusters depended only on the temperature.Moreover,the temperature of the growth region ranged from the saturation temperature of carbon vapor to the termination temperature of 3000 K,and the range was wider for high currents.At the saturation of carbon vapor,the mass densities were 6.4×1022,8.42×1022,and 1.23×10²³m−3under 150,200,and 250 A,respectively.It was clear that the mass density of the carbon clusters increased with the current on the same isothermal lines.
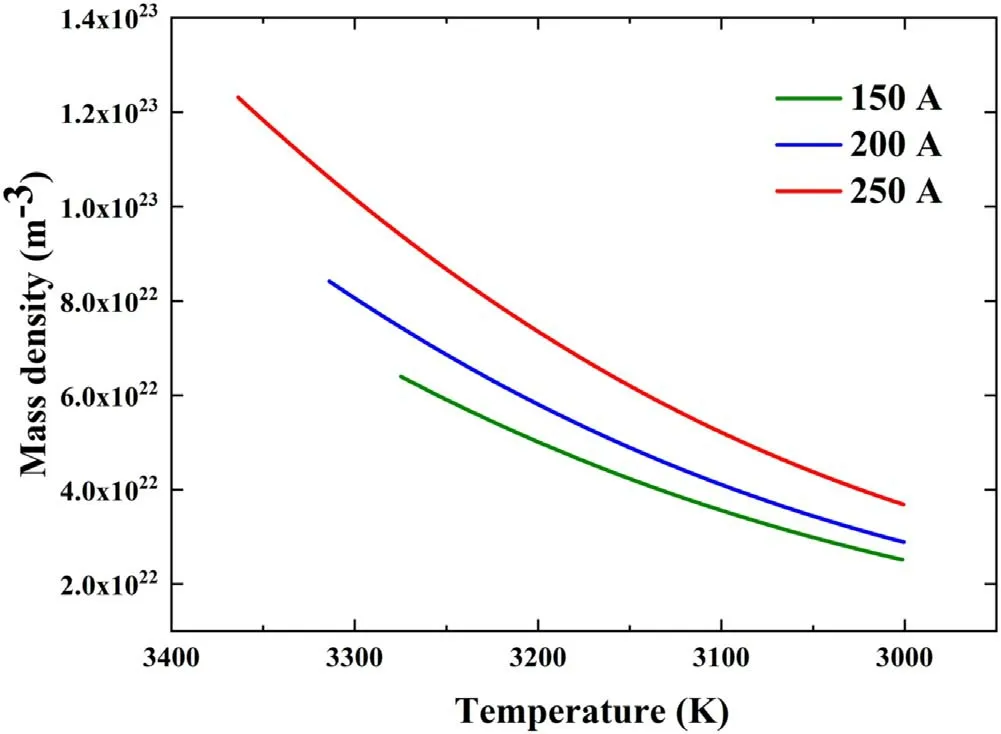
Figure 7.Distributions of carbon clusters mass density in growth region under different arc currents.
5.Growth mechanism of graphene
Figure 8 shows the growth mechanism of graphene via DC arc discharge without a catalyst.The growth mechanism of graphene was investigated based on the hydrogen-induced marginal growth model[20].First,different types of carbon clusters(C+,C,C2,C3…)were formed by the evaporation of anode graphite.Subsequently,graphene islands with C–H bonds were generated at the edges owing to the reaction between the carbon clusters and hydrogen atoms.Because of the lower stability of C–H bonds in the high-temperature region,they were broken and replaced by C–C bonds.The size of graphene increased gradually during the cycling process of hydrogen transfer and carbon addition.In the longitudinal stacking process,the van der Waals force was the intermolecular force between the graphene islands.As the size of graphene increased,the van der Waals force was enhanced by the greater relative molecular mass of the graphene islands.According to the minimum energy principle,graphene islands tend to combine mutually[39].Therefore,graphene sheets with more stable structures were formed after the stacking process.
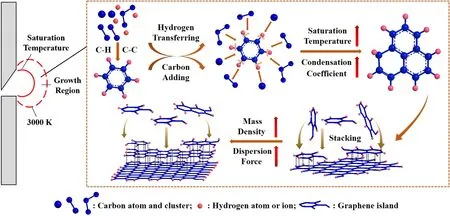
Figure 8.Growth mechanism of graphene via DC arc discharge.
The size and number of layers of the graphene sheets were dependent on the number density of the carbon clusters,which can be affected by the change in current.For the transverse condensation of graphene,the condensation coefficient can be expressed as[40]

wherensis the number density of carbon clusters at saturation;v1andm1are the volume and mass of the monomer,respectively.It was discovered that the condensation coefficient was proportional to the saturation temperature of carbon vapor.For currents of 150,200,and 250 A,the condensation coefficients were 2.86×108,3.79×108,and 4.64×10⁸,respectively.The transverse condensation process of graphene was enhanced by a higher condensation coefficient under a high current,thereby resulting in larger graphene sheets.This is consistent with the experimental results.Furthermore,the enhancement of the longitudinal stacking process under a high current is related to the increase in the van der Waals force.However,the van der Waals force is inversely proportional to the distance between the two molecules[41].Under a constant total volume,the distance between different graphene islands is closer for a larger carbon cluster number density.This corresponds to an increase in the van der Waals force.In addition,the van der Waals force is related to molecular deformation,which is proportional to the relative molecular mass[41].With an increase in current,the relative molecular mass is larger under a higher saturation temperature,thereby resulting in a greater van der Waals force and a larger number of graphene sheets.Therefore,a relationship between the carbon cluster number density and saturation temperature calculated via numerical simulation as well as the number of graphene layers was established.
6.Conclusion
Graphene sheets measuring 200–400 nm were synthesized via DC arc discharge without a catalyst.The formation of products with larger sizes and higher layer numbers was attributed to the enhanced evaporation process of anode graphite at high arc currents.Moreover,the saturation temperature and mass density of carbon clusters were obtained through numerical simulation.The hydrogeninduced marginal growth model was explained intuitively based on these parameters.For the high arc current,the greater saturation temperature and mass density of carbon clusters yielded a larger condensation coefficient and van der Waals force.Transverse condensation and longitudinal stacking were promoted,which is consistent with the larger size and higher layer numbers of graphene sheets demonstrated experimentally.
Acknowledgments
This work is financially supported by National Natural Science Foundation of China(No.11765010),the National Key Research and Development Program of China(No.2019YFC1907900),the Applied Basic Research Programs of Yunnan Provincial Science and Technology Department(No.202001AW070004),the Freely Exploring Fund for Academicians in Yunnan Province(No.2018HA006),the Key Laboratory of Resource Chemistry,Ministry of Education(No.KLRC_ME2001).
猜你喜欢
杂志排行
Plasma Science and Technology的其它文章
- Enhanced removal of ultrafine particles from kerosene combustion using a dielectric barrier discharge reactor packed with porous alumina balls
- Visualization of gold nanoparticles formation in DC plasma-liquid systems
- Rice plant growth and yield:foliar application of plasma activated water
- An active tunable Fano switch in a plasmafilled superlattice array
- Comparison of sample temperature effect on femtosecond and nanosecond laser-induced breakdown spectroscopy
- Magnetic field induction and magnetic force distribution profiles in plasma focus discharge device
