Magnetic field induction and magnetic force distribution profiles in plasma focus discharge device
2021-07-07LASHINALLAMELSAYEDKamalAHMEDWARDSOLIMANandABOUELATTA
A A LASHIN,T M ALLAM,H A EL-SAYED,Kamal M AHMED,S A WARD,H M SOLIMAN and M A ABOUELATTA
1 Plasma and Nuclear Fusion Department,Nuclear Research Centre,Egyptian Atomic Energy Authority,Inshas 13759,Egypt
2 Faculty of Engineering,Delta University for Science and Technology,Gamasa 11152,Egypt
3 Electrical Engineering Department,Faculty of Engineering at Shoubra,Benha University,Cairo 11629,Egypt
Abstract We report a simple-to-perform technique to investigate the distribution of the azimuthal magnetic field induction,Bθ,and the induced magnetic force acting on the plasma current sheath(PCS)in a plasma focus(PF)discharge.This in situ measurement technique can undoubtedly be beneficial when other fast-imaging techniques are not available.techniques are not available.Experimental work was conducted in the low-energy Mather-type EAEA-PF1 device operated in argon.The axial distribution(Bθ)z along the coaxial electrodes system was measured with a four magnetic-probe set technique at different radial distances(r=2.625×10⁻² to 4.125×10⁻² m)within the annular space between the coaxial electrodes during the 1st and 2nd half cycles of the discharge current waveform,where inner electrode of coaxial electrode system has a +ve polarity and-ve polarity,respectively.Axial,radial and total magnetic force distribution profiles were estimated fromBθ data.Investigation of PCS shape in terms of its inclination(curvature)angle,θ,along the axial rundown phase and the correlation between the magnetic forces per unit volume acting on the PCS,the inclination angle θ of the PCS,and the formation of a powerful PF action during the 1st and 2nd half cycles is carried out.Dependence of inclination angle,θ,on total magnetic force per unit volume acting on PCS axial motion was studied,separately,during the 1st and 2nd half cycles.
Keywords:plasma focus,azimuthal magnetic field,magnetic force,inclination angle,plasma current sheath
1.Introduction
Plasma focus(PF)has made fast progress as a plasma device for a number of scientific and industrial processes as a form of pinch discharge.PF is referred to as a high-level research facility for academic and applied plasma science,such as fusion,neutron processing,hard and soft x-ray generation,and astrophysical processes.A short-duration,high-density,and condensed plasma is produced at the electrodes’ centerline when a high-pulsed potential is applied to a low-pressure gas between coaxiallycylindrical electrodes.It can thus produce an intense beam of charged and neutral particles,as well as radiation emission[1,2].
In a PF discharge,the formation of an axially symmetric current sheath(CS)begins with a high-voltage surface discharge over an insulator between two coaxial electrodes[3].The flow of current acted upon by its own magnetic field causes the plasma sheath to detach and accelerate axially.As the produced sheath passes over the tip of the central electrode,the plasma is squeezed in a narrow space(the focus or pinch).In most devices,these three phases last a few microseconds,and in a new generation of short plasma foci,they last less than 500 nanoseconds.To obtain the optimum performance,the system can be optimized such that the current is optimal when the sheath approaches the axis by selecting the right dimensions(the length and diameters of the electrodes)as well as the operating pressure in relation to the energy characteristics of the proposed device[4].
The importance of PF devices stems from their ease of construction,low cost,and reliability of which are ideal for advanced applications[5–11].Using the penetration and activating properties of neutral radiation,the emitted neutrons may be used to conduct radiographs and material analysis.Bremsstrahlung radiation from concentrated electron beams and hot-spots produces strong x-ray pulses that are ideal for radiography of moving or wet targets as well as microelectronic lithography[12–14].
The amplitude of the azimuthal magnetic field,the magnetic field distribution,the arrival of the plasma current sheath(PCS)at a particular position,as well as its velocity,during the early phase[15]and the axial-acceleration phase[16,17]of the dense plasma focus can be carried out using a simple,cheap and lab-made diagnostic tool,that is,a magnetic probe.Magnetic probes were used by Krauzet al[18]to test current distribution in a 1 MA focus plasma.The dynamics of the PCS and current delivery in the PF-3 facility,which is one of the world’s largest PF devices,were described in that study.The tests were carried out at 290 kJ bank energy and a discharge current of 1–2 MA.Magnetic probes that were completely balanced and mounted at various distances from the device axis and heights above the anode plane were used to calculate the CS parameters.They go on to explain how insulator shunting breakdowns can allow closed current loops to form.The maximum residual plasma density at which the electrode gap remains magnetically self-insulated was determined.
In PF experiments,determining the axial portion of the magnetic field(Bz)is a major challenge.On the PF-1000 facility,measurements ofBzwere carried out via a multichannel,calibrated probe at both the radial compression of the PCS and the dense-pinch phase[19].Bzexceeds several kG in the compression phase,which is around 10%of the azimuthal component.Existence of theBzfield is a strong reason for the existence of closed magnetic structures,which play a key role in neutron production.
The velocity of the CS and profiles of the axial magnetic field distribution have been examined using magnetic-probe signals at numerous axial positions[16].They clarified that at the fixed radial distancer=2.65×10⁻²m,the magnetic field remained relatively stable at 0.72 T fromz=0 m to 8×10⁻²m,but it began to fall rapidly to 0.52 T at aboutz=14.5×10⁻²m.The magnetic field and velocity measurements indicate current shedding;only 68.5% of the total injected current flowed into the focus area.Whereas immediate shedding takes place at the insulator,the sudden reduction of the magnetic field atz=8×10⁻²m indicates that more current and mass shedding in the focus chamber is noticeable after this value ofz.
The 2.2 kJ machine was loaded with argon gas and worked at 0.8 Torr pressure and 12 kV charging voltage(Vch),resulting in intense focusing action[20].The primary goal of this study is to look at the axial distributions of azimuthal magnetic field induction and magnetic force at various radial locations between coaxial electrodes.
This work focuses on both the first half period(1st),where the IE has positive polarity and the OE has negative polarity,and the second half period(2nd),where the electrodes are reversely polarized,in order to demonstrate how this simple-to-perform probe technique could distinguish between two different force distribution profiles and PCS shapes.Under these circumstances,the PCS is generated independently at both half cycles.We investigate the magnetic forces acting on PCS(during the axial phase)in two scenarios:one for the first half cycle,where a dense PF is formed,and the other for the second half cycle,where a poorquality PF is observed.Whereas,during the 3rd half cycle,although,the polarity of coaxial electrodes has the same polarity of the 1st half cycle,no focus action is formed due to the much damped current.
2.Experimental setup
The Egyptian atomic energy authority-plasma focus(EAEAPF1)device is a low-energy Mather-type PF device.The electrode system in this device contains a central cylindrical anode 4.5×10⁻²m in diameter and 10.8×10⁻²m long,with a screw at its bottom to change its length.The anode is encircled by eight cathode rods,each 18×10-2m long and 1×10⁻²m in diameter,which are uniformly spaced around a 9×10⁻²m diameter circle that is coaxial with the anode.The two electrodes are separated by a 2.1×10⁻²m long Pyrex glass cylindrical insulator fixed around the bottom of the anode.The electrode system is housed inside a stainless-steel evacuation chamber 35×10-2m long and 41.7×10⁻²m in diameter,as shown in figure 1.The chamber has several rubber-sealed ports to facilitate the insertion of different axial and radial diagnostics.The discharge chamber is always evacuated using a vacuum pump to a pressure ~10-2Torr or less prior to gas introduction into the system.The discharge is energized by a 30 μF capacitor bank consisting of three low-inductance capacitors,each of which,has 20 nH self-inductance and 10 μF capacitance.Output terminals from the magnetic probes and Rogowski coil are connected to a TDS 2014 oscilloscope.Data of experimental work was taken as an average of at least 3-5 shots.

Figure 1.Discharge chamber with coaxial electrodes and magnetic-probe set.
The frequency response of the magnetic probe coil is determined by the time constant,τ[21].

whereLis the inductance of magnetic probe coil,Ris the shunt resistor=50 Ω.The inductance of the magnetic probe,Lcan be determined from the equation[22]:
where μ0is the magnetic permeability,Nis number of turns,Ais the cross-sectional area of the coil andlis the length of the coil.The inductance of each of the four identical magnetic probes is 46.4 nH and hence,the time constant τ≈1 ns.
3.Results and discussion
Axial distribution of change rate of azimuthal magnetic field induction with time,during the axial phase was measured along the coaxial electrodes at various distanceszfrom breech to muzzle and at various radial positionsr.Afterwards,signals are integrated with respect to time to get value ofBθattached to PCS.All experimental work was performed at initial gas pressure,P=0.8 Torr and charging voltage,Vch=12 kV[20].Figures 2(a)–(f)show thesignals atz=(3 and 10)×10-2m obtained from the magnetic probes placed at the radial positions 2.625×10⁻²m(probe 1),3.125×10-2m(probe 2),3.625×10-2m(probe 3),and 4.125×10⁻²m(probe 4)from the inner electrode axis,respectively(external trigger pulse is taken from discharge voltage for figures 2(a)and(b)while the trigger pulse is taken from voltage signal for figures 2(c)–(f)).
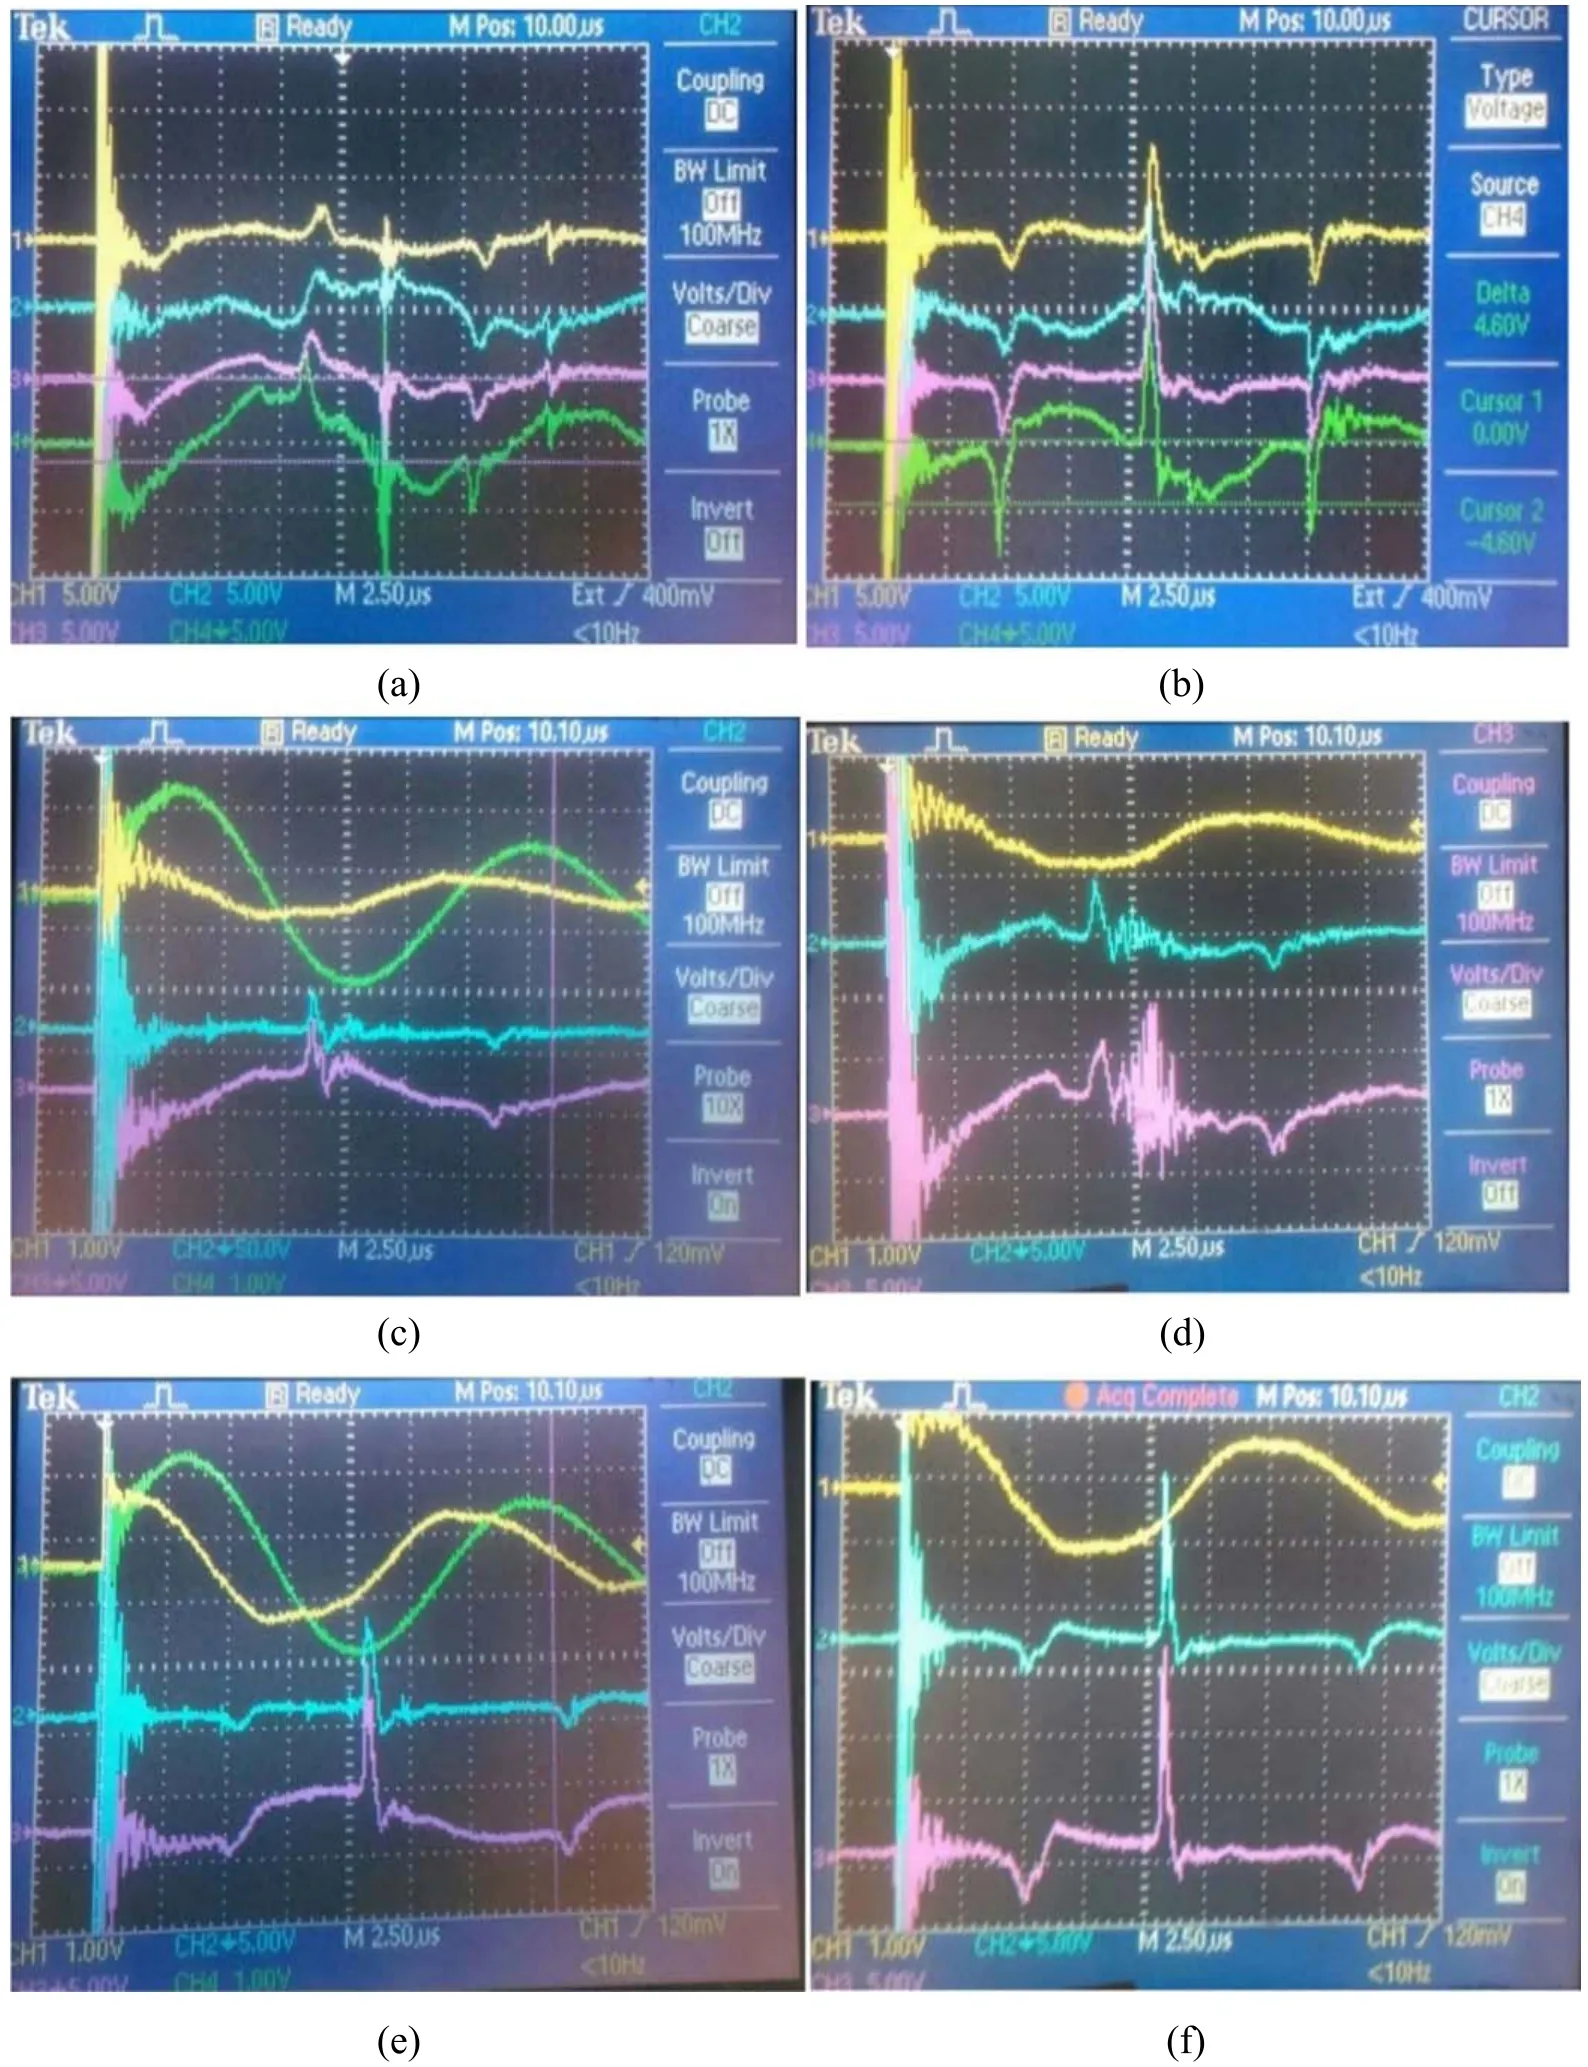
Figure 2.Magnetic probe signals showing and 2.625(from top to bottom)at(a) z=3 and(b) z=10.(c)Signals of discharge current(green),discharge voltage(yellow)and magnetic probes signals at z=3 for r=3.625(purple)and 4.125(cyan).(d)Signals of discharge voltage(yellow)and magnetic probes signals at z=3 for r=3.125(purple)and 2.625(cyan).(e)Signals of discharge current(green),discharge voltage(yellow)and magnetic probes signals at z=10 for r=3.625(purple)and 4.125(cyan).(f)Signals of discharge voltage(yellow)and magnetic probes signals at z=10 for r=3.125(purple)and 2.625(cyan).(both z and r are given in 10-2 m).
Magnetic probes signals at each of the 1st and 2nd half cycles of discharge illustrate thatis,mostly,increased with time from the beginning of PCS front until it reached a maximum value behind the PCS(magnetic piston),afterwardsis decreased gradually with time where the PCS leaves the magnetic probes.It can also be noticed that the arrival time of peak value ofis increased as the radial distance,ris increased(position of magnetic probes in radial distribution from IE to OE for each axial distance,zunder consideration).
Figures 3(a)and(b)show the distributions ofBθversuszat differentrfor the 1st and 2nd half cycles of the discharge current.For the 1st and 2nd half cycles,the distributions ofBθwithzhave approximately the same behavior,for most radial distances under consideration,and at axial distances close to the muzzle of the coaxial electrodes,the magnitude ofBθin the 2nd half cycle is greater than that in the 1st one.In general,the distribution ofBθwithzmay be attributed to the current shedding factor,fc,the diamagnetic effect and the direction ofJzduring 1st and 2nd half cycles.
Axial magnetic force/unit volume,Fz,which affects the PCS motion during the axial phase,is estimated from the following equation:

where,Jris radial PCS density[23]
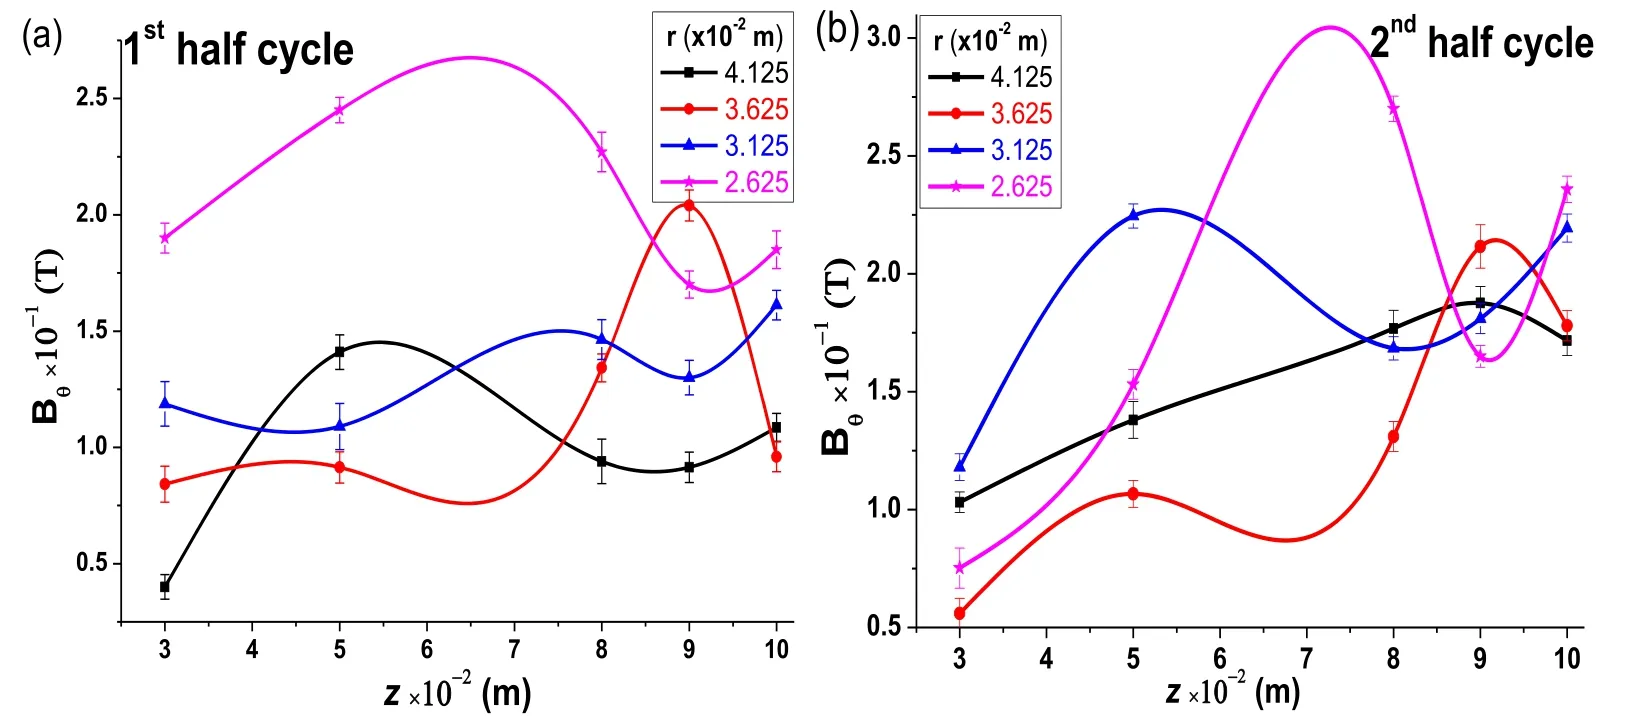
Figure 3.Distribution ofBθ as a function of z for(a)the 1st half cycle and(b)the 2nd half cycle.
Figures 4(a)and(b)show the distribution profiles ofJrversuszandrfor both the 1st half cycle and 2nd half cycle,respectively,under the same discharge conditions described above.These figures reveal that,at radial distances closer to the IE surface(r=2.625×10⁻²m),Jrhas a greater value at the 2nd half cycle than at the 1st one for most axial distancesz.Also,we can see that,for the 1st half cycle,Jrhas a maximum value(red spots)closest to muzzle atz=10×10-2m and near the OE surface atr=3.625×10⁻²m while at the 2nd half cycleJr(maximum)is detected near the IE surface atr=2.625×10⁻²m andz=10×10-2m.These distributions may be related to the distribution ofBθand PCS shedding factor.The standard error values ofJrranged from 0.23% to 23.57% and from 0.15% to 22.9% for the 1st and 2nd half cycles.These figures demonstrate that,at the muzzle of the coaxial electrodes,Fzis significantly higher at radial distances approaching the IE surface(atr=2.625×10⁻²m)in the 2nd half cycle while the rest of theFzprofile remains comparable to that of the 1st half cycle which has its maximum value near the OE(atr=3.625×10⁻²m).The standard error values ofFzranged from 0.64 to 25.0%and from 1.3 to 20.26%for the 1st and 2nd half cycles,respectively.

Figure 4.Distribution profiles of Jr versus z and r for(a)the 1st half cycle and(b)the 2nd half cycle.
The distribution profiles ofFzversus axial and radial distances,zandr,respectively,are shown in figures 5(a)and(b)for the 1st and 2nd half cycles.
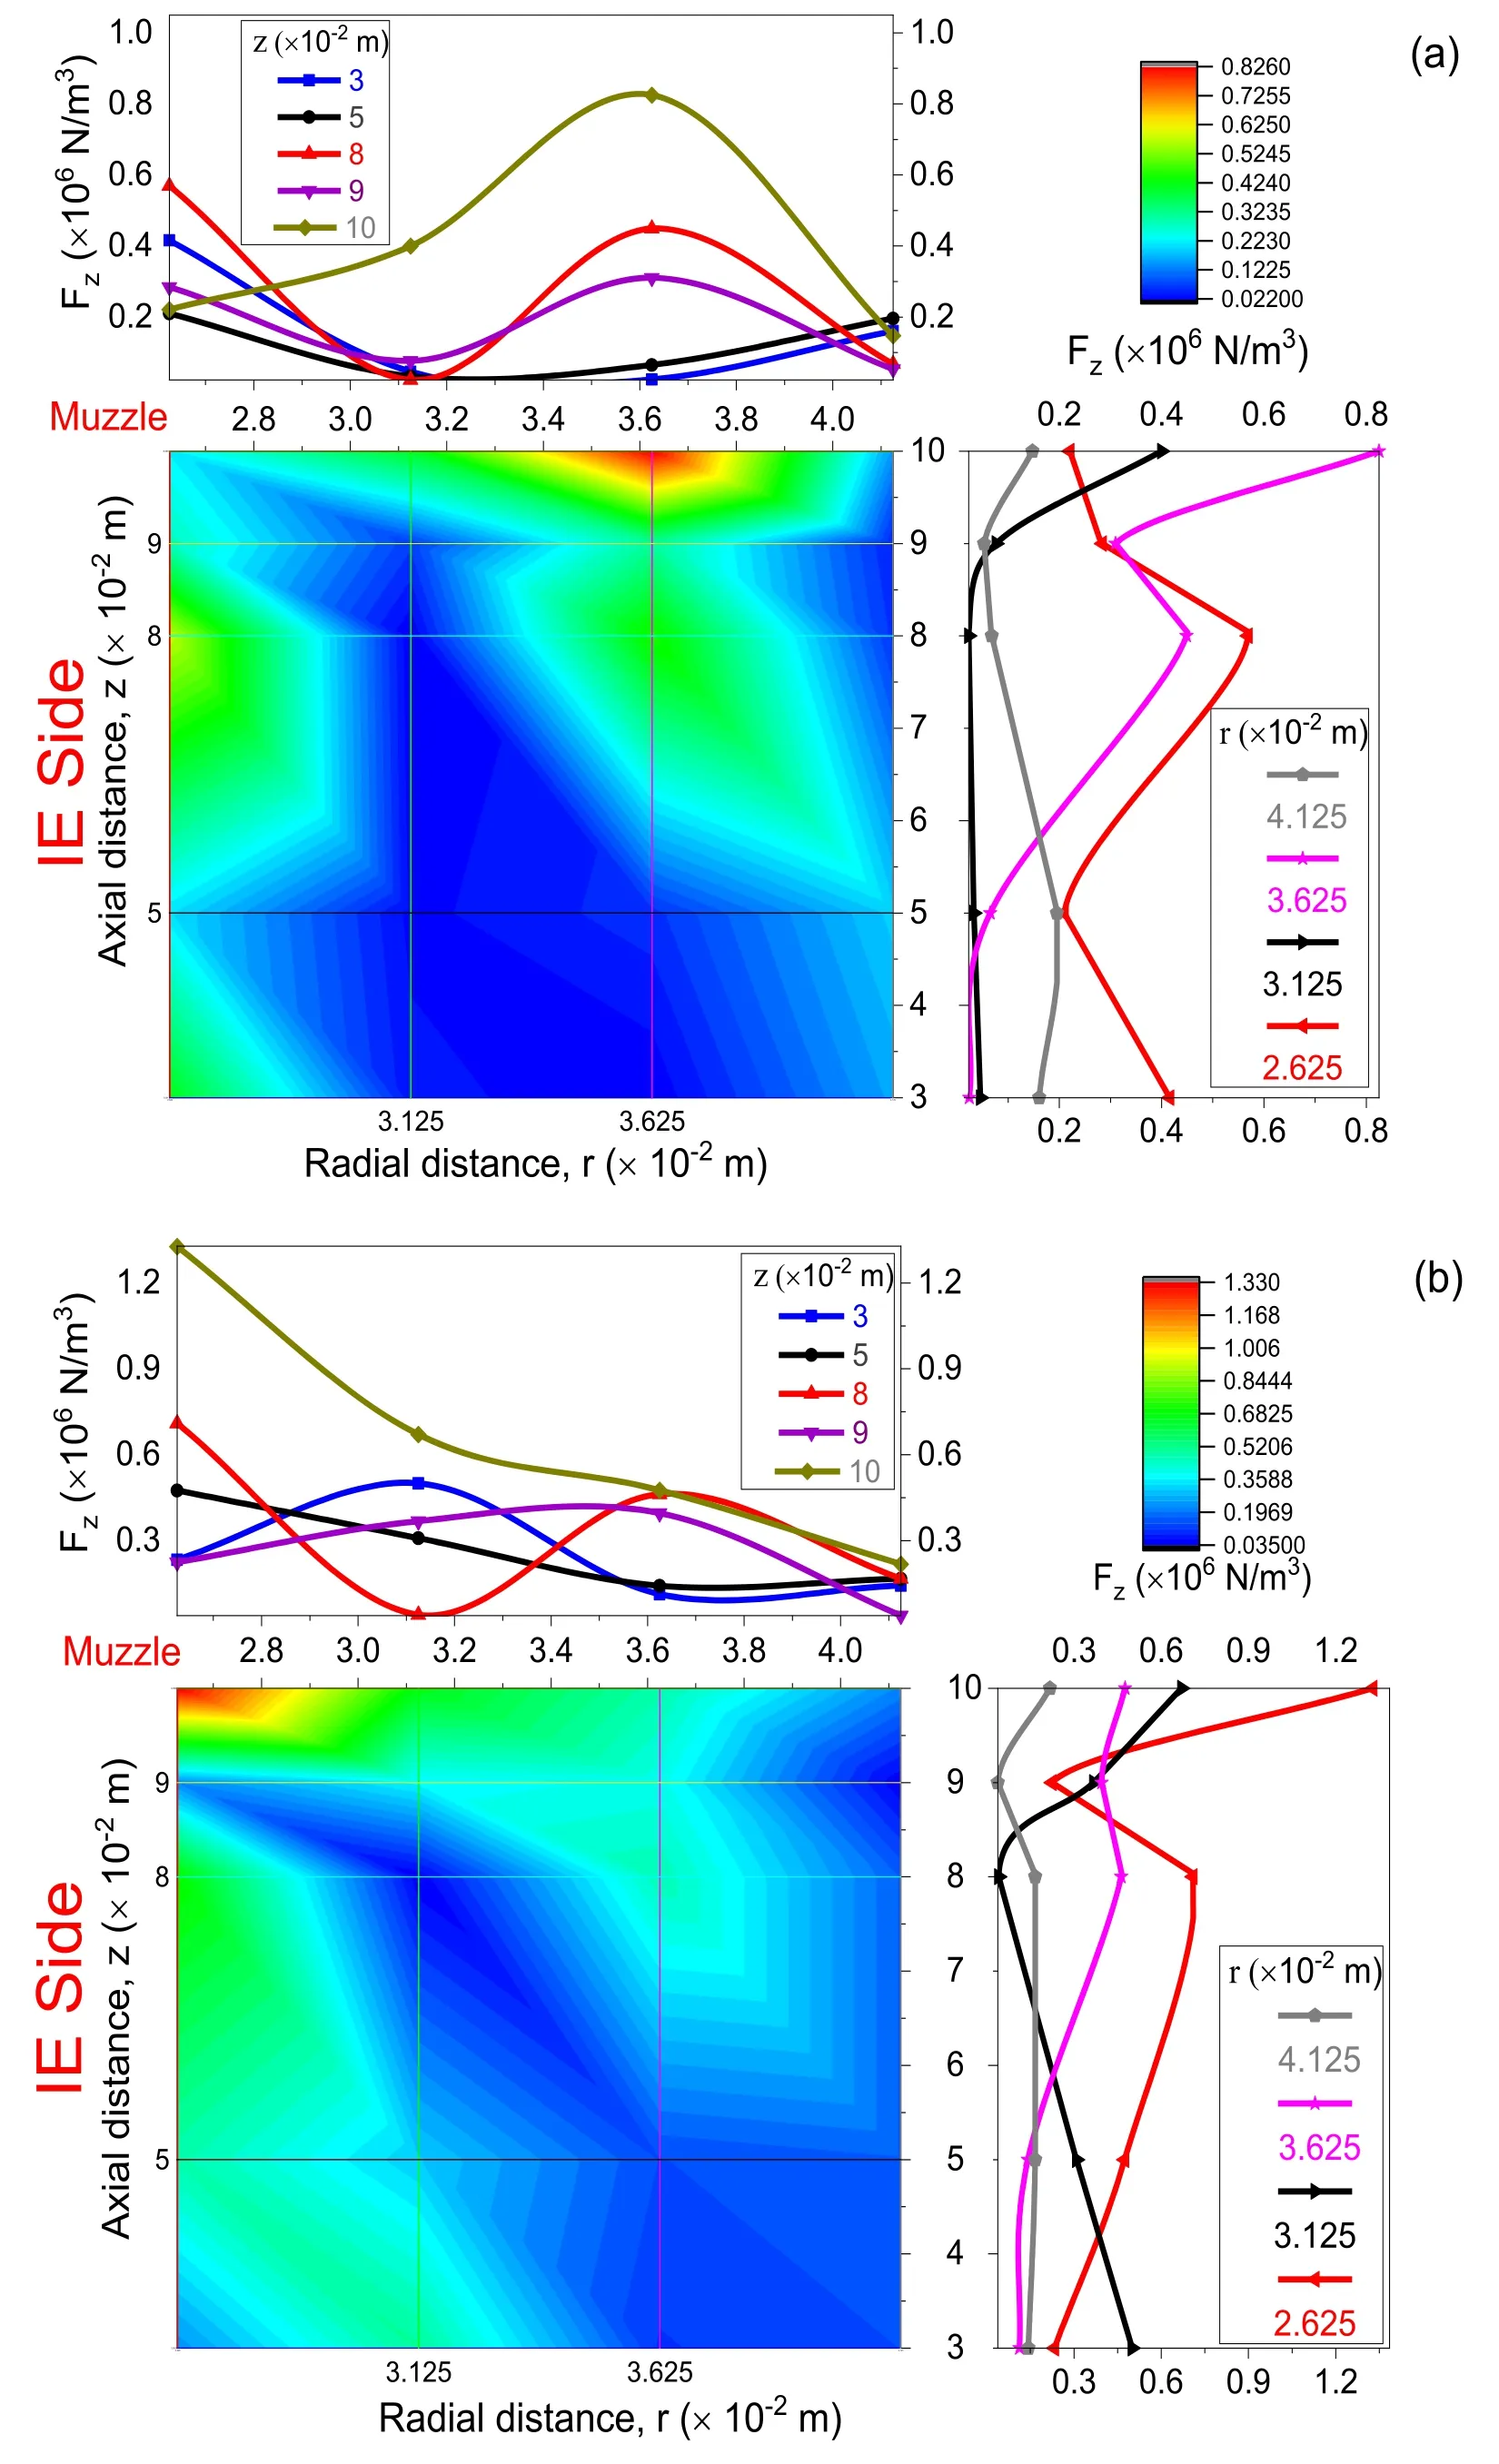
Figure 5.Distribution profiles of Fz versus z and r for(a)the 1st half cycle and(b)the 2nd half cycle.
The change rate ofFzwithz,is listed in table 1 for differentrin the 1st and 2nd half cycles.The data in this table show that,at radial distance closer to the IE(r=2.625×10⁻²m),Fzdecreases withzin the 1st half cycle and vice versa in the 2nd half cycle.Forr=3.125×10⁻²m and 3.625×10⁻²m,the value ofFzincreases withzin the 1st half cycle at a higher rate than in the 2nd one.Finally,forrclose to the OE(r=4.125×10⁻²m),Fzdecreases withzduring the 1st half cycle at a higher rate than during the 2nd one.
Table 1. versus r for the 1st and 2nd half cycles.

Table 1. versus r for the 1st and 2nd half cycles.
r×10-2(m)F z d d F z d d z(N m-4)for the 2nd half cycle 2.625-8.313×1059.5952×106 3.1253.316×1064.9826×105 3.6259.758×1065.7226×106 4.125-1.2243×10⁶-3.379×10⁴ z(N m-4)for the 1st half cycle
Radial magnetic force per unit volume,Fr,acting on PCS motion in the radial direction is expected to cause an effect on the PCS inclination during axial phase and is introduced from the following relation[23]:
where,Jzis the plasma sheath axial current density

The distribution profiles ofFrwithzandrfor the 1st and 2nd half cycles are shown in figures 6(a)and(b),respectively.These figures verify that,for the 1st half cycle,Frhas a maximum value atr=2.625×10⁻²m for most axial distances,z,while in the 2nd half cycle it has maximum values at the samerforz=8×10⁻²m and 10×10-2m.Generally,we note that,at coaxial electrodes muzzle(z=10×10-2m),the value ofFrat each radial position(r1-r4)is greater during the 2nd half cycle than in the 1st one.The standard error values ofFrranged from 4.49% to 25.97% and from 3.9% to 22.27% for 1st and 2nd half cycles,respectively.

Figure 6.Distribution profiles of Fr versus z and r for(a)the 1st half cycle and(b)the 2nd half cycle.
Table 2. versus r for the 1st and 2nd half cycles.
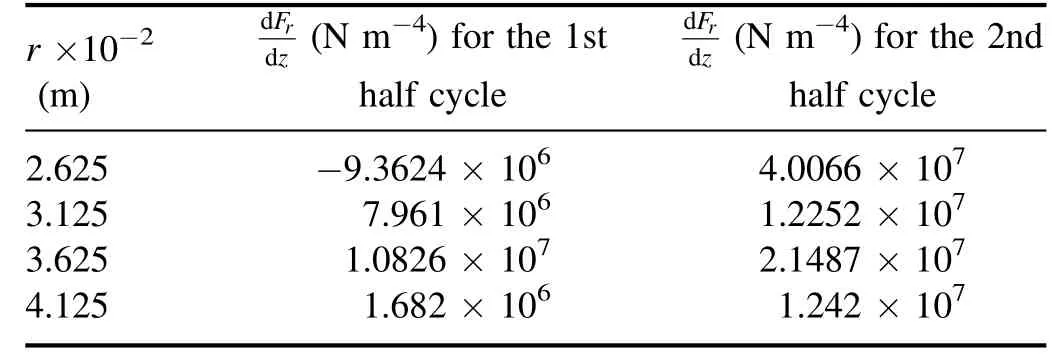
Table 2. versus r for the 1st and 2nd half cycles.
r×10-2(m)F z d d F z d d r(N m-4)for the 2nd half cycle 2.625-9.3624×1064.0066×107 3.1257.961×1061.2252×107 3.6251.0826×1072.1487×107 4.1251.682×1061.242×107 r(N m-4)for the 1st half cycle
Figures 7(a)and(b)present the distribution profiles ofFtwithzandr,respectively,for the 1st and 2nd half cycles.These figures show thatFthas approximately the same distribution profile in bothzandrasFrprofiles.The standard error values ofFtranged from 4.49% to 20.1% and from 3.89%to 17.85%for the 1st and 2nd half cycles,respectively.

Figure 7.Distribution profiles of Ft versus z and r for(a)the 1st half cycle and(b)the 2nd half cycle.
The change rate ofFtwithz,,for different radial positions is listed in table 3 for the 1st and 2nd half cycles.The values ofandfor the 1st and 2nd half cycles show that,atr=2.625×10⁻²m,FrandFtdecrease withzduring the 1st half cycle,while in the 2nd half cycle they both increase withz.At the other radial distances under consideration,FrandFtincrease withzmore rapidly in the 2nd half cycle than in the 1st one.
Table 3.versus r for the 1st and 2nd half cycles.
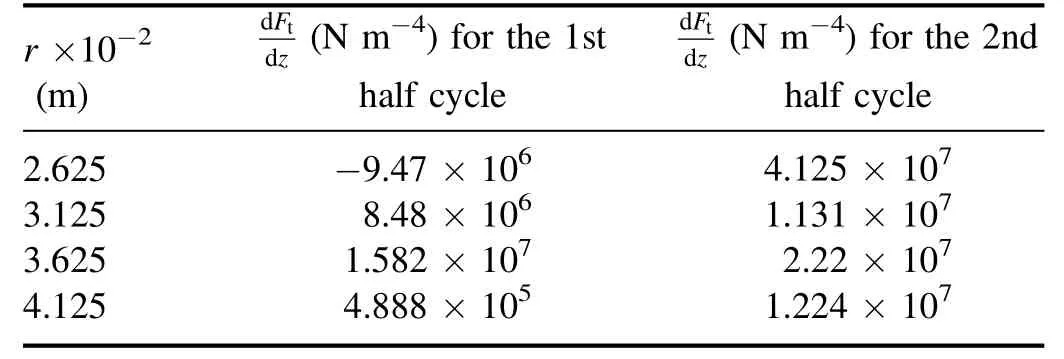
Table 3.versus r for the 1st and 2nd half cycles.
r×10-2(m)F z d d F z d d t(N m-4)for the 2nd half cycle 2.625-9.47×1064.125×107 3.1258.48×1061.131×107 3.6251.582×1072.22×107 4.1254.888×1051.224×107 t(N m-4)for the 1st half cycle
Axial distributions of the inclination angle θ of the PCS are estimated from the axial arrival time and the axial distance traveled by the PCS at differentrfor eachzunder consideration[24],and are shown in figures 8(a)and(b)during the 1st and 2nd half cycles,respectively.These figures show that in the 1st half cycle,PCS is strongly canted than in the 2nd half cycle,for allzvalues.At the 2nd half cycle,the PCS is approximately perpendicular to the axial distancez,along the coaxial electrodes.
Finally,we note that,owing to the axial distribution ofFtacting on the PCS motions during the axial phase,and for different radial distances in the 1st and 2nd half cycles,the inclination angle θ of the PCS varies with the axial distancezduring both half cycles and across the annular space between coaxial electrodes(rIEtorOE).The PCS is not planar,but is canted backward from the IE toward the OE during the 1st half cycle,while in the 2nd half cycle,it is approximately planar.Then,during the 1st half cycle,the PCS motion shape with respect to θ can lead to the formation of a powerful PF due to the nature of convergence of PCS at coaxial electrodes muzzle(just before the collapse phase).Conversely,during the 2nd half cycle,only a poor-quality PF occurs.Figure 9 shows the discharge current and voltage signals during the 1st and 2nd half cycles.As this figure shows,a PF voltage spike,the PF action is formed clearly during the 1st half cycle.
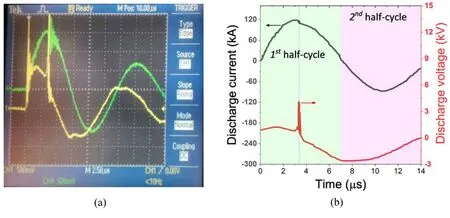
Figure 9.Discharge current(upper trace)and voltage(lower trace)without the introduction of magnetic probe set for(a)oscilloscope signals and(b)digitized signals.
Dependence of inclination angle,θ,on total magnetic force/unit volume,Ft,at differentrandzunder consideration,is listed in table 4(for the 1st and 2nd half cycles of discharge current).In order to examine the influence of the total magnetic force on the PCS inclination,table 4 shows thatFthas a significant effect on the PCS inclination angle,θ,during the 1st half cycle and differs from that of the 2nd half cycle.This may be attributed to the thickness of PCS during the axial phase.Previous results[25]showed that the ion density of PCS is higher in the region near the negative electrode than that in the region near the positive electrode.The thickness of PCS during the 1st half cycle is thin near positive IE,and is rather thick near the negative OE,whereas,a vice versa process is detected during the 2nd half cycle.In other words,the PCS region near the positive IE—in the 1st half cycle—is less dense,has a thin profile and is more likely to be affected by the stronger magnetic piston during most of the PCS axial trip.Here,Ftis much higher than that in the region near the OE,and,thus,causing PCS to incline backward giving the good focus formation.This is,certainly,not the case in the 2nd half cycle,in which the PCS region near the IE is denser,thicker and is,hardly,inclined by its magnetic piston distribution profile.
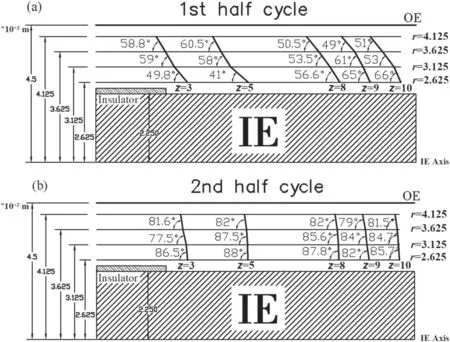
Figure 8.Variations of the inclination angle θ with z and r for(a)the 1st half cycle and(b)the 2nd half cycle.(both z and r are given in 10-2 m).
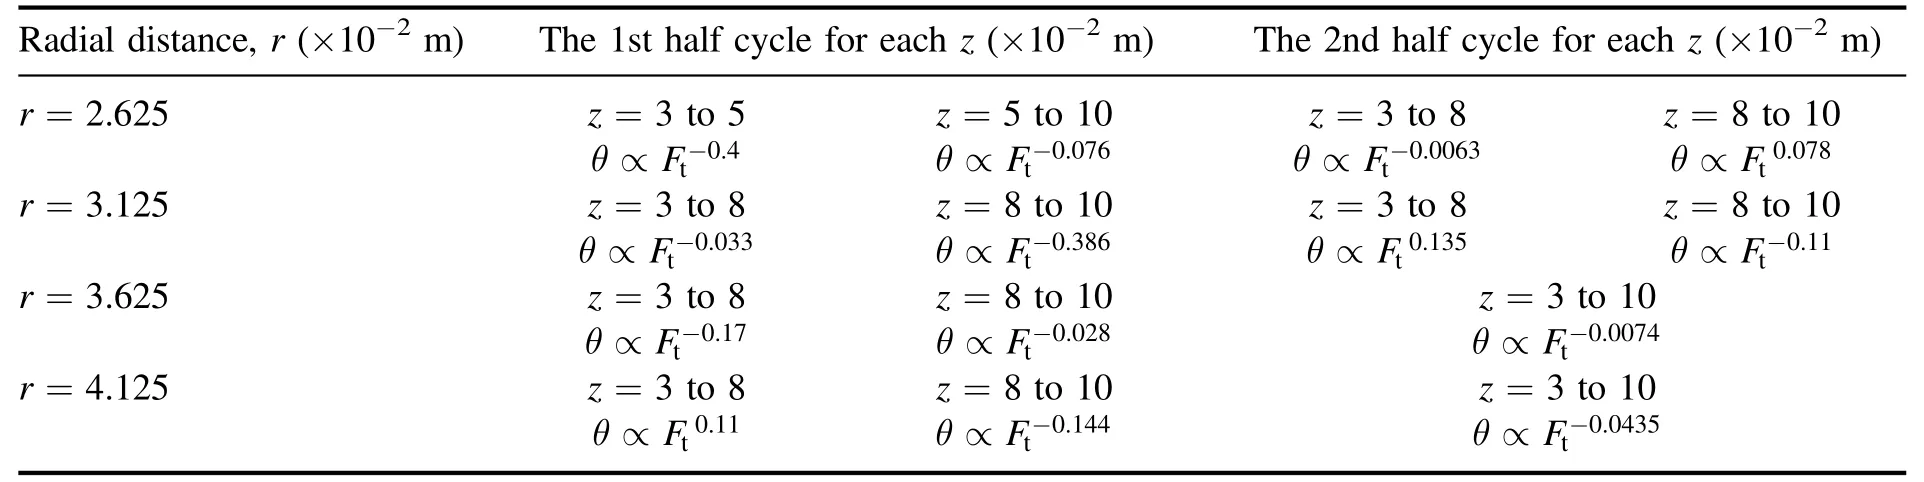
Table 4.θ ∝Ft versus r,z for the 1st and 2nd half cycles.
4.Conclusion
The reported simple-to-perform,home-made,four magnetic probes set technique is useful when other techniques such as fast time-resolved camera or laser shadowgraphy are not available to investigate the motion shape of PCS,the generated magnetic field induction,the magnetic force distribution and consequently its inclination angle.Results of axial azimuthal magnetic field induction,Bθ,as a function of coaxial electrodes axial distance,z,at different radial distances across the annular space between the coaxial electrodes showed that,for the 1st and 2nd half cycles,the magnitude ofBθduring the 2nd half cycle is greater than that during the 1st one.This may be attributed to energy losses,the diamagnetic effect,and current shedding factor.Results of total magnetic force/unit volume,Ft,which is estimated at the same discharge conditions mentioned above,concluded that,Ftis acting on PCS axial motion for different radial positions and,consequently,on its inclination angle,θ,withzdirection.PCS inclination angle during the axial rundown phase and through the annular space of coaxial electrodes is illustrated for the 1st and 2nd half cycles.Finally,experimental results showed that in the 1st half cycle(IE has +vepolarity),the PCS became more canted than in the 2nd one(IE has -vepolarity).Due to the nature of convergence of PCS at coaxial electrodes muzzle(during 1st half cycle)just before the collapse phase,the formation of a powerful PF is detected,while at the 2nd half cycle a poor-quality PF is observed in discharge current and voltage waveforms.This study confirmed that the PF formation depends on the PCS motion and shape during the axial phase and just before the collapse phase.
ORCID iDs
杂志排行

Plasma Science and Technology的其它文章
- Numerical simulation of carbon arc discharge for graphene synthesis without catalyst
- Enhanced removal of ultrafine particles from kerosene combustion using a dielectric barrier discharge reactor packed with porous alumina balls
- Visualization of gold nanoparticles formation in DC plasma-liquid systems
- Rice plant growth and yield:foliar application of plasma activated water
- An active tunable Fano switch in a plasmafilled superlattice array
- Comparison of sample temperature effect on femtosecond and nanosecond laser-induced breakdown spectroscopy