Experimental Investigation on the Hydrodynamic Performance of Quay-moored FSRU and LNG Carrier
2021-07-03,,,,,
,,,,,
(1.Wuhan Rules and Research Institute of China Classification Society,Wuhan 430022,China;2.State Key Laboratory of Ocean Engineering,Shanghai Jiao Tong University,Shanghai 200240,China)
Abstract:An experimental investigation on the hydrodynamic performance of an FSRU(Floating Storage Regasification Unit)and an LNG(Liquefied Natural Gas)carrier moored at a quay is presented.Quay-moored model tests for the FSRU and side-by-side-moored model tests for the FSRU and LNG carrier are conducted respectively in a wave basin.Mooring lines and fenders are adopted to connect the quay and vessels.The effects of environmental factors of wind,current and wave are all considered during the tests.In the seakeeping model tests,the dynamic responses of the system,including the sixdegree-of-freedom motions of the vessels,tensions on mooring lines and contact forces on fenders,are measured in various sea states.Compared with waves of other directions,the beam sea waves contribute to larger vessel motions,resulting in larger loads on mooring lines and fenders.The single FSRU quay mooring system has relatively calm responses among all the environmental conditions,whereas the side-by-side FSRU-LNGC quay mooring system is very sensitive to the environment,especially to the beam sea condition.
Key words:model test;side-by-side;FSRU;mooring line tension;fender force
0 Introduction
With an increasing demand for natural gas in many countries,Floating Storage Regasification Unit(FSRU)terminals play a pivotal role in the storage and regasification of Liquefied Natural Gas(LNG)[1-2].The FSRU,the most typical and widely-used offshore LNG receiving terminal,has received more attention due to its remarkable advantages,such as high security,small environmental impact and low cost.The FSRUis a ship-type structure equipped with an LNGstorage and regasification device that can vaporize the received LNG and deliver it to users through submarine pipelines.
During the offloading operation,vessels can be in tandem or in side-by-side configuration[3-4].The vessel’s six-degree-of-freedom motions,tank sloshing and their mutual coupling should be considered to ensure the offloading operation security.The sloshing of LNG can affect the motions and drift forces of structures due to the coupling between the sloshing and floating body motions[5].The coupling effect is the strongest at low filling levels in the beam sea.The effect of LNG-tank sloshing on the global motions of LNG carriers was investigated using a time-domain simulation scheme by Lee et al(2007)[6].
The turret-catenary system and the tower yoke system are commonly used when the FSRU is operating in the offshore area[7-8],while the quay mooring system is used when the FSRU works on shore.Ships and some other offshore floating structures are usually moored alongside the quay at the harbor.The quay mooring system consists of the floating structures,quays,mooring lines and fenders.As an input to the system,environmental loads could cause the motions of the floating structures.The mooring lines and fenders provide the restoring force acting on the floating structures against motions in different directions,respectively.Many software packages,such as MOORSIM,SHIPMOORand OPTIMOOR,have been developed for analyzing the hydrodynamic characteristics of vessels,fenders and mooring lines[9-11].Recently,studies on quay mooring systems were presented using numerical and experimental methods.A numerical calculation and model test study on a quay mooring semi-submersible platform[12]was carried out to study the effects of wind,current and wave on the quay mooring system.Liu et al(2016)[13]experimentally studied the hydrodynamic performance of a quay-moored jackup model.
In this paper,an experimental investigation on the quay-moored FSRUand LNGcarrier is presented.The main propose is to study the hydrodynamic performances of the singly-moored FSRU and side-by-side-moored FSRU-LNGCand assess the security of the quay mooring system.A series of model tests of the FSRU quay mooring system are carried out.Relative motions of the FSRU and the LNG carrier in different sea conditions are analyzed and the forces acting on the mooring lines and fenders are presented.Meanwhile,the effects of environmental conditions,especially wave directions,on the motions of the vessels are discussed.
1 Description of the floating system
The quay mooring system is positioned at a water depth of 60 m designed by CCS Wuhan Rules and Research Institute.Considering the main particulars of the vessels,the scales of the wave basin and capabilities of the test facilities,the linear scale of the prototype and the model is chosen asλ=64.
1.1 Vessels
The FSRU vessel is 340.50 m in length and 60 m in breadth.The LNGcarrier has a length of 290 m and a breadth of 45.6 m.Details of the vessels under different load conditions are listed in Tab.1.Fig.1 shows the configurations of the FSRU vessel.Each of the FSRU and the LNGcarrier is equipped with 8 tanks that are double-row arranged.Five typical fill levels of the FSRU and LNG carrier system in offloading operations are considered.For the FSRU,ballasting with 30%,50%,70%and fully loaded fill levels are considered while for the LNG carrier,ballasting with fully and 60%loaded fill levels are considered.Tab.2 lists the cooperation work conditions of the FSRU and the LNGcarrier in the model tests.

Tab.1 Particularsof the FSRU vessel and LNG carrier

Fig.1 General structure of the FSRUvessel

Tab.2 Cooperation work conditions
As shown in Fig.2,the global coordinate system and vessel-fixed coordinate system are defined for each vessel in the measurement of vessel’s motions.Six DOF motions of vessels are obtained based on the two coordinate systems.The relative motions are defined as zero in the initial state.

Fig.2 Coordinate systems of the model tests
1.2 Mooring system
The quay mooring system consists of the FSRU,the LNG carrier,the quay,mooring lines and fenders.As shown in Fig.3,there are 18 mooring lines and 4 fenders between the quay and the FSRU,and 24 mooring lines and 8 fenders between the FSRU and the LNGcarrier.One half of the 18 mooring lines are adopted to connect the FSRU and the quay in the bow and the other half in the stern.All 4 fenders are fixed to the quay and connect the FSRU in the parallel middle.The mooring lines between the FSRU and the quay are 52 mm in diameter with a minimum breaking load of 1 736 kN.The nonlinear strain-tension relation of the mooring lines is illustrated in Fig.4.The original length of the fenders is 9 m long when it is not compressed.The reaction force of the fender has nonlinear properties when it is under compression,as shown is Fig.4.In the initial state,the distance between the quay and the FSRU is smaller than the fender length,and fender forces are balanced by the pretension forcesin the mooring lines.

Fig.3 Quay mooring system

Fig.4 Stiffness characteristics
The arrangement of the mooring lines and fenders between the FSRU and the LNG carrier is similar to that between the FSRU and the quay.12 mooring lines are used to connect the FSRU and the LNG carrier in the bow and the rest in the stern.8 fenders are fixed to the FSRU.The specific locations of fenders are shown in Fig.3.Between the FSRU and the LNGcarrier,the mooring lines have a diameter of 40 mm with a minimum breaking load of 1 108 kN.The fenders adopted between the FSRUand the LNGcarrier are the same as those used between the FSRUand the quay.
1.3 Environmental conditions
Model tests were carried out with vessels subjected to irregular waves combined with steady wind and current to simulate various sea states.Wave directions are the main concern of this study.Random waves are described by the three-parameter Jonswap spectrum.Tab.3 lists the details of environmental conditions.The directions of the wind,wave and current are illustrated in Fig.2.

Tab.3 Environmental conditionsof various sea states
2 Experimental setup
A series of model testswere conducted at State Key Laboratory of Ocean Engineering(SKLOE),Shanghai Jiao Tong University in China.The dimensions of the basin are 50 m×40 m×10 m and the water depth wasset at 0.938 m according to the model scale.
The model set-up for the whole system is shown in Fig.5.During the tests,the mooring lines with similar angle,length and same axial stiffness were simplified into one group.Therefore,the 18 mooring lines between the FSRU and the quay(Line A)were divided into 10 groups and the 24 mooring lines between the FSRU and LNGcarrier(Line B)were divided into 10 groups.Tab.4 lists the groupings and corresponding numbers of the mooring lines.The mooring line models were composed of spring sections and steel wire sections,with the length and stiffness equivalent to the fulllength mooring system.

Fig.5 Model set-up for the quay mooring system

Tab.4 Grouping numbers of mooring lines
The contact forces on all the four fenders between the FSRU and the quay were measured.Among the 8 fenders between the FSRU and LNG carrier,2 in the bow and 2 in the stern were mainly involved in the movement of vessels.The contact forces on these 4 fenders were much greater than those on 4 fenders in the middle.Therefore,only the contact forces on the 4 fenders of the bow and the stern were measured during the model tests.The corresponding numbers of the 8 measured fenders were marked as illustrated in Fig.3.
The loading liquid used in the model test was fresh water whose density was about twice that of LNG.If the tank was to be loaded completely with water in the model test,the total mass of the model would be much larger than the target mass obtained according to the scale ratio.Therefore,we put foams at the bottom of the tank and separated foams from water by the organic glass and sealed.And then fresh water was loaded into the tank up to the target fill level.By this means,both the target model mass and fill level could be achieved.The change of liquid level in the tank was the main factor considered in model tests,and other factors such as mass and inertia could be guaranteed by using thismethod.Therefore,this method is reasonable and feasible.
Seakeeping tests with combination of wind,current and wave were conducted to get a comprehensive understanding of the hydrodynamic performance for the quay-moored FSRU and side-byside-moored FSRU-LNGC.The directions of the wind,current and waves are illustrated in Fig.2.The wave spectra were calibrated carefully in a current condition before the model tests.The dynamic responses,including the six-degree-of-freedom motions of vessels,the mooring line tensions and contact forces on the fenders,were measured directly.
3 Results and discussions
The model tests are mainly divided into two parts including a quay-moored test of a single FSRU vessel(F cases)and a test of the FSRU and an LNGcarrier moored side by side to the quay(FL cases),therefore,the experimental resultsare discussed respectively.
3.1 F cases
3.1.1 Statistical analysisof mooring line tensions
Tab.5 presents the maximum load and corresponding number of the mooring lines in each irregular wave test.It is noted that each group of the mooring lines is the combination of several similar mooring lines for simplification as explained in Chapter 2,so the tension in Tab.5 refers to the maximum value of per mooring line in each group.As shown in Tab.5,the maximum tension of a single mooring line is 1 340.7 kN(Line A4 of the F2 case),which is less than the breaking strength value of 1 736 kN of mooring lines.Therefore,the mooring lines would not break under the joint action of wind,current and wave.It is shown that the maximum tension of mooring lines appears on Lines A3,A4,A6 and A7,especially on Line A3.It is important to pay attention to these four groups of mooring lines in rough sea conditions to avoid the line breaking.It is noted that the large tensions always occur with the large yaw and sway motions.Variations of the FSRU’s yaw and sway motions versus maximum tensions of mooring lines are plotted in Fig.6 to get a better description and understanding of the relevance between each other.In general,larger yaw and sway motions lead to larger mooring line tension.
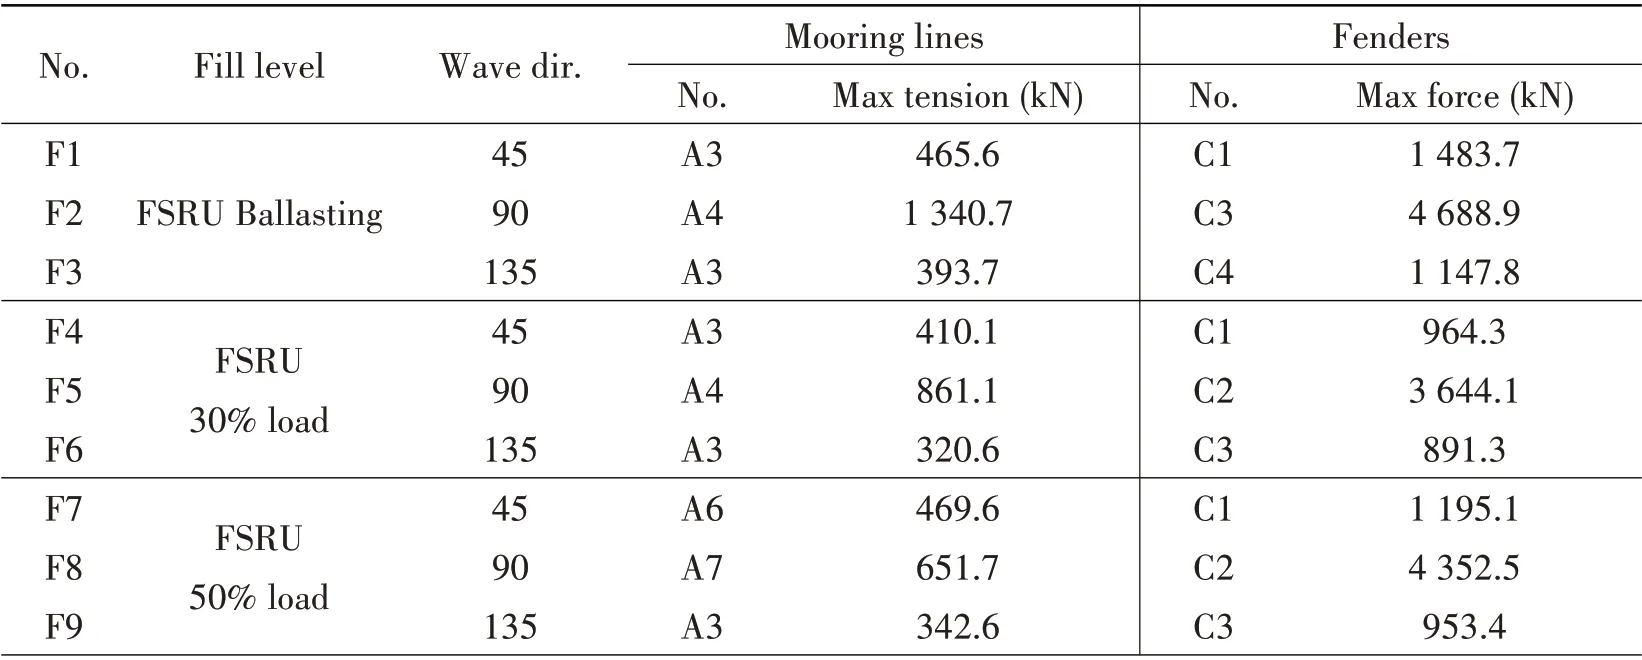
Tab.5 Forcesacting on the mooring linesand fenders of F cases

Tab.5(Continued)

Fig.6 Variations of the FSRU’s yaw and sway motions versus maximum tensions of mooring lines
3.1.2 Statistical analysisof contact force on fenders
The maximum contact force on fenders is 5 239.6 kN acting on the Fender C1 of the F14 Case(see Tab.5),which is less than the maximum reaction failure of the fender(19 600 kN).It is concluded that the fenders would not fail under the worst sea conditions.Furthermore,the contact forces of all fenders between the quay and the FSRU should be emphasized because the maximum contact force occurs on all four fenders.It is noted that the loads of mooring lines and fenders are sensitive to the wave direction.The forces of mooring lines and fenders under the 90°wave are much greater than those under other wave directions.
3.1.3 Vessel’s motions
Fig.7 shows the significant double amplitude values of the FSRU’s motions.It is shown that all the motions except the pitch motion are sensitive to the wave direction.The sway,heave,roll and yaw motions have the largest values under the 90°wave,but do not differ significantly between 45°and 135°waves.The pitch motion seems to be less sensitive to the wave directions.Contrary to other motions,FSRU’s pitch motion under the 90°wave is smaller than those under other wave directions.According to the arrangement of the mooring system,the increase of sway,roll and heave motions will inevitably lead to an increase of the loads on mooring lines and fenders.As listed in Tab.5,loads on mooring lines and fenders have the largest values under the 90°wave.In other words,the result of the FSRU’s motions is well consistent with the result of the forces on mooring linesand fenders.


Fig.7 Motions of the FSRUof the Fcases
3.2 FL cases
3.2.1 Statistical analysisof mooring line tensions
The maximum load and corresponding number of the mooring lines and fenders of the FL cases are listed in Tab.6 respectively.The maximum tension of a single mooring line between the FSRU and the quay is 1 825.3 kN acting on Line A4 of the FL14 case.Between the FSRU and the LNG carrier,the Line B7 of the FL5 case has the largest tension with a value of 2 986.9 kN.The wave direction of the FL5 case is 90°,same as the FL14 case.For the mooring lines between the FSRU and the quay,except for the FL14 case,the tensions of the other working conditions are less than the breaking strength value of the mooring line.But for mooring lines between the FSRU and the LNG carrier,the maximum tensions of the mooring lines in all the cases in the beam sea exceed the breaking strength,probably leading to the break of mooring lines.The maximum tension of a single mooring line commonly occurs on Lines A3,A4,A6 and A8 between the FSRU and the quay,and on Lines B4 and B7 between the FSRU and the LNG carrier.Therefore,more attention should be paid to these groupsof mooring linesin rough sea conditions.
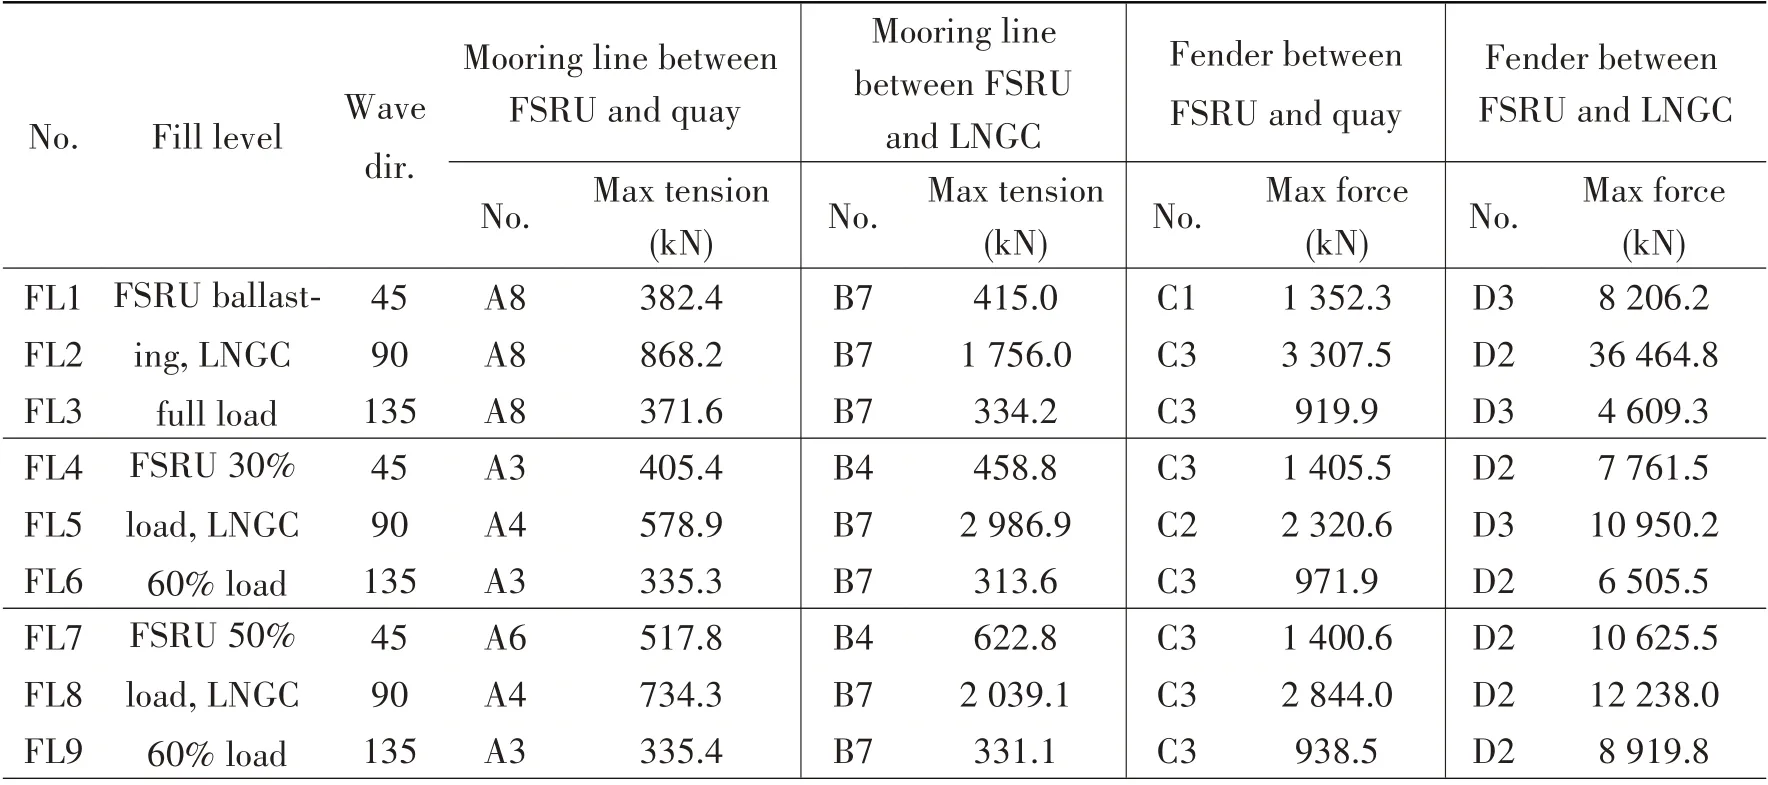
Tab.6 Forcesacting on mooring linesand fenders of the FL cases

Tab.6(Continued)
3.2.2 Statistical analysisof contact force on fenders
As shown in Tab.6,in the FL14 case,the Fender C1 and the Fender D2 have the largest contact force with the values of 4 452.6 kN and 37 571.9 kN respectively.The FL14 case refers to the work condition where the FSRU is fully loaded,the LNGcarrier is ballasted and the wave direction is 90°.It can be found that the maximum pressure on fenders far exceeds the maximum reaction force of the fender(19 600 kN)under the FL5 and FL14 cases between the FSRU and the LNGcarrier.Overall,the maximum load of the mooring lines or fenders between the FSRU and the quay or between the FSRUand the LNGcarrier alwaysoccurs in sea conditions with a wave angle of 90°.
3.2.3 Vessels’motions
The statistical results of the motions of the FSRU and the LNGcarrier recorded from the model tests are shown in Figs.8~9.In the FL14 case where the FSRU is fully loaded,the LNG carrier is ballasted and the wave angle is 90°,significantly large motions of the FSRU and the LNG carrier cause strong loads on the fenders and mooring lines.Thus,more mooring lines and fenders should be added to guarantee offloading security,or the offloading process should be stopped in the worse sea states.
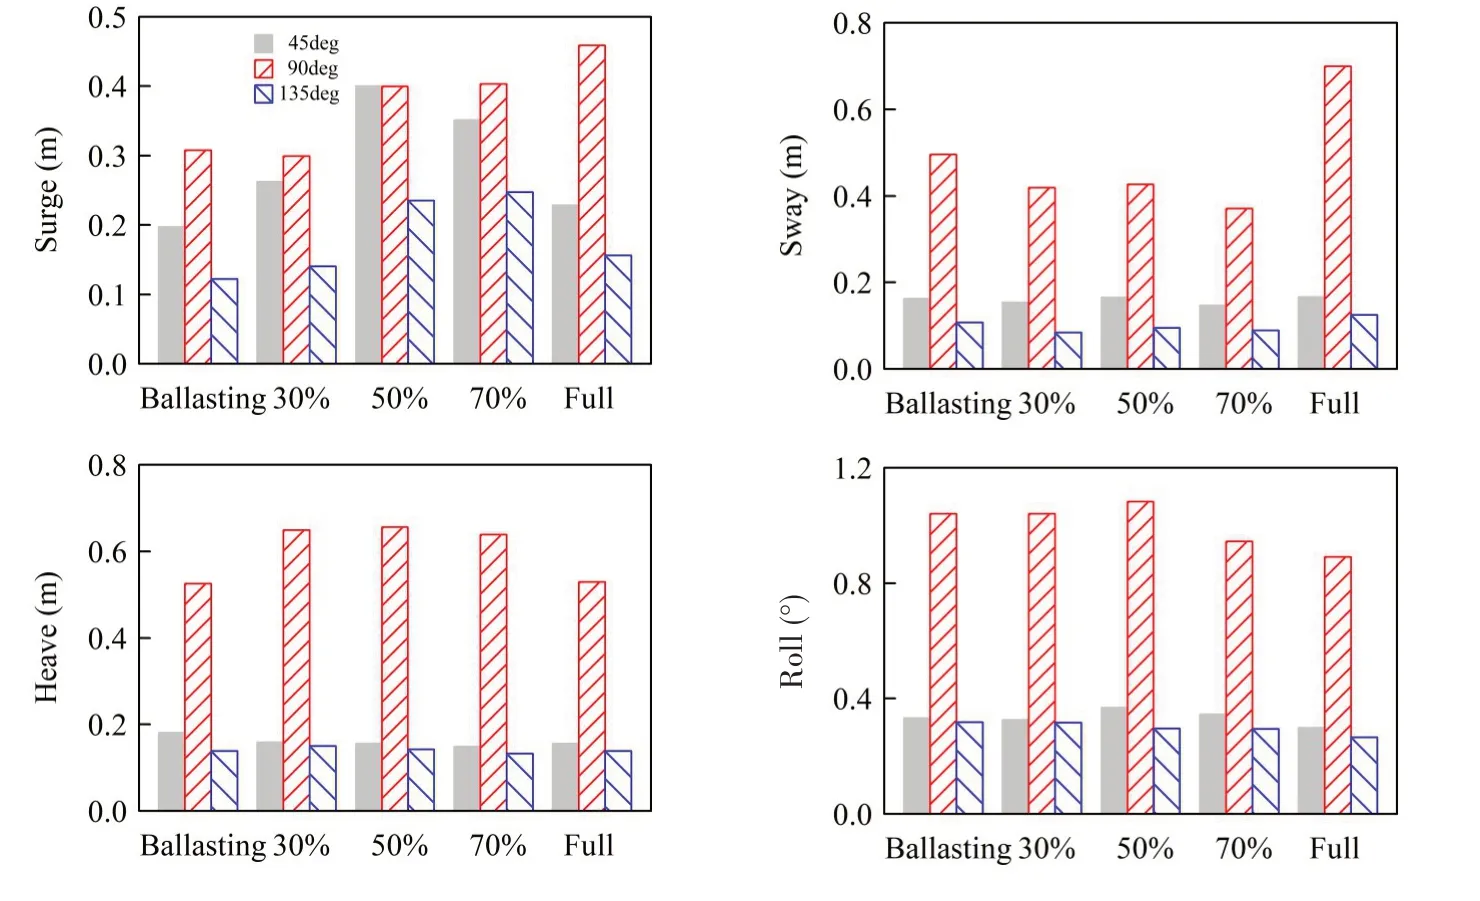

Fig.8 Motions of the FSRUin the FL cases

Fig.9 Motions of the LNGcarrier in the FL cases
As illustrated in Fig.10,six-degree-of-freedom motions of the FSRU and the LNG carrier in the FL cases are compared.The horizontal axis represents one-degree-of-freedom motion of the FSRU and the verticalaxis represents the corresponding motion of the LNG carrier.The straight line in the figure isy=xas the reference line.The location of points relative to the reference line can be used to judge in which case the FSRU has a larger motion.For example,the point at the right of the baseline represents that the motion of FSRU is larger than that of the LNGcarrier.It is found that six-degree-of-freedom motions of the LNGcarrier are larger than those of the FSRU,especially under 90°wave.The motions of the LNG carrier are directly affected by waves,causing large motions especially in the beam sea.The existence of the LNGcarrier resists and weakens the wave loads on the FSRU and results in smaller motions of the FSRU.Moreover,the natural roll,pitch and heave period of the LNGobtained from decay test are 24.8 s,8.96 s and 8.4 s respectively.The natural period of the LNG carrier is closer to the wave period,which leads to large motions of the LNGcarrier.

Fig.10 Comparison of the motions of FSRUand LNGcarrier
4 Conclusions
This paper presents the experimental results of a quay-moored model test for an FSRU and an LNG carrier in the wave basin in Shanghai Jiao Tong University in China.The motions of vessels,the mooring line tensions and the contact forces of fenders have been experimentally investigated in the seakeeping tests.The tests are divided into two parts,including quay-moored tests of a single FSRU vessel(F cases)and side-by-side quay-moored tests of an FSRU and an LNG carrier(FL cases).Main conclusions drawn through the experimental results can be summarized asfollows:
(1)During the quay-moored single FSRU test,all the maximum loads on the mooring lines and fenders are less than the break strength or failure contact forces.As a result,the quay mooring systemof the single FSRUhas good security.
(2)During the quay-moored test of side-by-side FSRU-LNGC,most mooring lines and fenders between the FSRU and the quay will not break or fail.But under all the 90°wave,between the FSRU and the LNG carrier,the largest tension acting on the mooring line is larger than its break strength,and the maximum tension acting on the fender exceeds its largest contact force.Consequently,more attention should be paid to the mooring lines and fenders between the FSRU and the LNG carrier.It is necessary to increase the numbers of the mooring lines and fenders in the beam sea,or to stop the operation work under the worse sea conditions.
(3)Wave direction plays an important role in the hydrodynamic performance of the quay mooring systems of the FSRUand the LNGcarrier.Compared to other wave angles,the 90°wave contributesto larger motions,which may cause greater loadson mooring lines and fenders.
(4)During the quay-moored tests of side-by-side configuration of the FSRU and the LNGcarrier,motions of the LNGcarrier islarger than those of the FSRU,especially under the 90°waves.
杂志排行
船舶力学的其它文章
- Application of the Cell-vertex Finite Volume Method in the Solution of the Lubrication Characteristicsof Journal Bearings
- Numerical Simulations on the Dynamic Characteristicsof a Shallow-draft Spar-type Floating Wind Turbine
- Study on Torque Characteristics and Structural Strength of Large Container Shipsunder Oblique Waves
- Collapse Analysis of Model Sphere of Titanium Manned Cabin under External Pressure
- Numerical Investigation of Dynamic Responsesof Ship Structure and Gas Turbine Subjected to Underwater Explosion
- Study on the Performance of Micro-perforated Plate Absorber under Coupling