Experimental Study on Characteristicsof Marine Propeller Cavitation and Noise
2021-07-03,,
,,
(China Ship Scientific Research Center(CSSRC),Wuxi214082,China)
Abstract:In order to study the relativity of propeller cavitation pattern and propeller radiated noise,a synchronous measurement technology was developed to measure the radiated sound and cavitation pattern simultaneously.Based on the model test results,the characteristics of marine propeller cavitation and noise were analyzed.Model test of a 2400 TEU container was carried out in the large cavitation channel of CSSRC.From the results of the propeller model test,the sheet and tip vortex cavitation has the highest noise level with a broadband feature.The tip vortex cavitation has a much weaker noise level than the sheet and tip vortex cavitation,but is higher than that of non-cavitation state.Noise spectra of the sheet and tip vortex cavitation and tip vortex cavitation both show a‘hump’around 1 kHz in model scale,corresponding to about 50-60 Hz in full scale.
Key words:ship propeller;cavitation noise;model test
0 Introduction
In the past decade,there is a dramatic increase of the underwater noise pollution,estimated by 3 to 6 dB/decade since the 1960s[1].Shipping is one of the largest contributors to the underwater noise pollution,the significance of which is even greater given that a large part of the energy of the ship-related noise falls within the range of 10-1 000 Hz and thus has a high potential to affect marine wildlife[2].
Sound emitted by a marine ship is greatly affected by the propeller cavitaion,especially when the ship propeller operates in a highly non-uniform and turbulent wake.Cavitating noise is much stronger than non-cavitating noise.So reduction of ship cavitating noise has been an important issue in the marine ship field.
In order to mitigate,control and alter propeller noise,a major breakthrough in ship design and operation is needed by the industry and research community.Ship propeller cavitation noise investigations mainly focus on computational prediction method,few detailed studies of the radiated noise of full-scale ships have been reported.Kamiirisa[3]developed a theoretical simulation method on the basis of bubble dynamics for predicting sheet cavitation noise from a marine screw propeller.Salvatore et al[4]developed an integrated hydrodynamics/hydroacoustics approach for marine propeller sheet cavitation noise.Arveson and Vendittis[5]measured and analysed the characteristics of a modern cargo ship radiated noise.The radiated noise data showed high-level tonal frequencies from the ship’s service diesel generator,main engine firing rate,and blade rate harmonics due to propeller cavitation.
A simultaneous measurement method capable of measuring the radiated sound and cavitation pattern simultaneously is developed in this paper,followed by description of the detailed model test method and analysis of the characteristicsof marine propeller cavitation and noise.
1 Model test method
1.1 Model test of marine propeller cavitation and noise
In most conditions,a ship propeller operates in a cavitating state.In order to evaluate and control ship propeller noise,a ship propeller model test including observation of the cavitation phenomena and noise measurementsshould be carried out.
A model test of ship propeller cavitation and noise measurement was conducted in the large cavitation channel(CLCC)of CSSRC,in which the propeller was operating at a relatively high Reynolds number.Fig.1 presents CSSRC’s large closed circulating water channel.The test section of the channel is 10.5 m in length,2.2 m in width and 2.0 m in height.Flow velocity in the test section can be adjusted from 1 m/s to 15 m/s.Pressure at the center of test section can be changed from 10 kPa to 300 kPa.

Fig.1 Test section of CSSRC’s CLCC
For propeller cavitation tests and noise measurements in the large cavitation channel,the model test conditions should satisfy the same propeller working conditions as predicted for the full scale ship.The real cavitation behaviour is achieved by adjustment of the dimensionless similarity numbers,i.e.thrust coefficientKT(propeller loading,KT-identity)and cavitation numberσn()0.8R(pressure similarity,σn()0.8R-identity).
The cavitation number is based on the propeller rotating speed and the location at 0.8Ron the blade position at zero angle(12 o’clock).

whereTis the propeller thrust,ρis the fluid density,nis the propeller rotational speed,RandDare the propeller radiusand diameter respectively,p0isthe atmospheric pressure.
1.2 Synchronous measurements for radiated noise and cavitation pattern
By means of high speed video records of cavitation and simultaneous measurements of noise,the relationship between propeller cavity dynamicsand detailsof propeller noise can be derived.
An LED lamp is used as the light source.A Photron-APX high speed video camera is installed outside the windows of the channel.The cavitation patterns are recorded by the high speed video camera,the parameters of which are listed in Tab.1.The setup of the high speed video camera and LED lamp is shown in Fig.2.
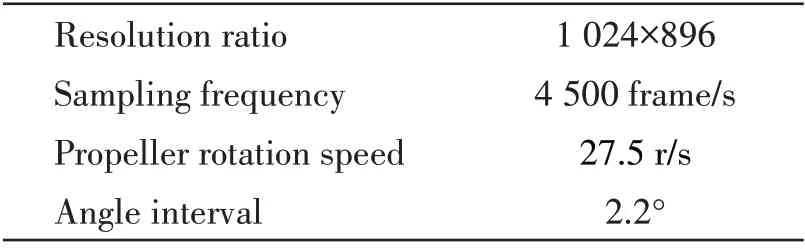
Tab.1 Main parameters of high speed video camera

Fig.2 The high speed video camera and LEDlamp
Below the test section of CLCCis a large water-filled anechoic chamber separated by acoustically transparent perspex windows,accommodating an omni-directional hydrophone of B&K 8105 at a distance of about 10 propeller diameters beneath the model propeller,which was used to measure the sound of the ship propeller model.The arrangement of the experiment is shown in Fig.3.

Fig.3 Schematic diagramof experimental setup
During the synchronization test,the high speed camera system is connected with the dynamic signal A/D board,one channel of which is used to receive the electric signal of the high speed camera.When the high speed recording starts,a trigger signal is set on that channel.From that trigger point,cavitation images and noise signals are simultaneously recorded.Fig.4 illustrates how the synchronizing signal is analyzed.

Fig.4 Trigger signal for synchronizing measuring method
2 Experimental results and analysis
2.1 Ship and propeller models
The vessel in this test is a 2400 TEU container,the principal dimensions of the vessel are 200 m in length,15.4 m in height and 32.3 m in width.The ship model was manufactured geometrically scaled to the full scale below its design draft line.The scale ratio is 24.8.The test model is 7.483 m in length and 0.419 m in design draft.To compensate the flow deceleration due to the boundary layer below wave suppressing plates,an extra height of 50 mm was added in depth above the design draft water line.The height of ship model is 0.469 m.
The propeller model,with a diameter of 250 mm,has the same scale ratio as the ship model.The main specifications of the ship and propeller model are listed in Tab.2.Fig.5 shows the installation arrangementsof the models.

Tab.2 Main specifications of ship and propeller models

Fig.5 Ship and propeller models in CLCC
2.2 Characteristics of marine propeller cavitation and noise
Based on the sampling pulse of the high speed camera,the synchronous noise signal can be obtained.In order to study the characteristics and the relation between cavitation types and propeller cavitation noise,the pressure of the test section was adjusted to make the propeller model in different cavitaiton states.The results of propeller cavitation noise are shown in Fig.6.The propeller noise signal changes obviously with different cavitation states.It can be seen that there are three typical signals in the figure.At the very beginning,the propeller has no cavitaion,and the noise signal isvery stable.When both thesheet cavitation and tip vortex cavitation occur(refer to Fig.7 for itscavitation patterns),the noise signal increases dramatically.When there is only tip vortex cavitation(refer to Fig.9 for its cavitation patterns),thenoisesignal becomes unstablecompared with that in non-cavitation state,butismuch lower compared with that in sheetcavitation and tip vortex cavitation state.as seen from Fig.8.and tip vortex cavitation,and the main frequency seems to be a little higher,probably because of a smaller vortex cavitation radius.

Fig.6 Results of ship propeller cavitation noise

Fig.7 Time-series photos of sheet and tip vortex cavitation from the high-speed video camera and its synchronous noise signal

Fig.8 Noise spectrumcorresponding to the noise signal in Fig.7

Fig.9 Time-series photos of tip vortex cavitation fromthe high-speed video camera and its synchronous noise signal
Sound pressure levels of the propeller model in different cavitation states are presented in Fig.11.The sheet and tip vortex cavitation has the highest noise level with a broadband feature.The tip vortex cavitation has a much weaker noise level than the sheet and tip vortex cavitation,but higher than that of non-cavitation state.Notably,noise spectra of sheet and tip vortex cavitation and tip vortex cavitation both show a‘hump’around 1 kHz in model scale,corresponding to about 50-60 Hz in full scale,and the‘hump’frequency of tip vortex cavitation seems a little higher than that of sheet and tip vortex cavitation.

Fig.10 Noise spectrum corresponding to the noise signal in Fig.9

Fig.11 Sound pressure levels of propeller model in different cavitation states
3 Concluding remarks
In order to study the characteristics of propeller cavitation noise and the relationship between cavity dynamics and propeller cavitation noise,a synchronous measurement technology was developed to record cavitation images and noise signalssimultaneously.
A propeller model test of a 2400 TEU container ship was carried out in the large cavitation channel of CSSRC.The characteristics of propeller cavitation and noise were analyzed.From the test results,the sheet and tip vortex cavitation has the highest noise level with a broadband feature.The tip vortex cavitation has a much weaker noise level than the sheet and tip vortex cavitation,but higher than that of non-cavitation state.Noise spectra of the sheet and tip vortex cavitation and tip vortex cavitation both show a‘hump’around 1 kHz in model scale,corresponding to about 50-60 Hzin full scale.
杂志排行
船舶力学的其它文章
- Application of the Cell-vertex Finite Volume Method in the Solution of the Lubrication Characteristicsof Journal Bearings
- Numerical Simulations on the Dynamic Characteristicsof a Shallow-draft Spar-type Floating Wind Turbine
- Study on Torque Characteristics and Structural Strength of Large Container Shipsunder Oblique Waves
- Collapse Analysis of Model Sphere of Titanium Manned Cabin under External Pressure
- Numerical Investigation of Dynamic Responsesof Ship Structure and Gas Turbine Subjected to Underwater Explosion
- Study on the Performance of Micro-perforated Plate Absorber under Coupling