Mapping and predicting a candidate gene for flesh color in watermelon
2021-06-24WANGChaonanLUANFeishiLIUHongyuAngelaDAVISZHANGQianDAIZuyunLIUShi
WANG Chao-nan,LUAN Fei-shi,LIU Hong-yu,Angela R.DAVIS,ZHANG Qi-an,DAI Zu-yun,LIU Shi
1 Key Laboratory of Biology and Genetic Improvement of Horticulture Crops (Northeast Region),Ministry of Agriculture and Rural Affairs/Horticulture and Landscape Architecture College,Northeast Agricultural University,Harbin 150030,P.R.China
2 South Central Agricultural Research Laboratory,Agricultural Research Service,U.S.Department of Agriculture,Washington,D.C.94710,USA
3 Horticulture Institute,Anhui Academy of Agricultural Science,Hefei 230031,P.R.China
4 Anhui Jianghuai Horticulture Technology Co.,Ltd.,Hefei 230031,P.R.China
Abstract The color of watermelon flesh is an important trait determined by a series of carotenoids. Herein,we used Cream of Saskatchewan (pale yellow flesh) and PI 186490 (white flesh) as parental materials for an F2 segregation and initial mapping using the bulked segregant analysis sequencing (BSA-seq) strategy. The BSA results revealed a flesh colorrelated QTL that spans approximately 2.45 Mb on chromosome 6. This region was preliminarily positioned in a 382-kb segment,and then narrowed down into a 66.8-kb segment with 1 260 F2 individuals. A total of nine candidate genes were in the fine mapping interval,but only Cla007528 (encoding chlorophyllase) had non-synonymous mutations and was significantly expressed between the parental materials throughout flesh development. We also checked the expression patterns of the carotenoid metabolic pathway genes based on RNA-seq data and qRT-PCR validation. Three genes in the xanthophyll cycle (ClCHYB, ClNCED-1 and ClNCED-7) exhibited differential expression patterns between the two parental lines at different flesh color formation stages. ClPSY1,ClPDS, ClZDS, ClCHXE,ClCRTISO and ClLCYB also exhibited clearly different expression patterns accompanied by carotenoid accumulation.
Keywords:watermelon,fine mapping,flesh color,QTL,transcriptome
1.Introduction
The flesh color of watermelon (Citrullus lanatus) is an important quality trait that influences consumer selection. Watermelon flesh colors can be divided into several categories:red,pink,canary yellow,pale yellow,salmon yellow,orange,white and light green. Different carotenoid compositions are responsible for the diversity of watermelon flesh colors. Lycopene is the major pigment for red and pink flesh colors (Kanget al.2010);pro-lycopene (tetra-cis-lycopene) and β-carotene are the major pigments for salmon yellow and orange flesh,respectively (Tadmoret al.2005;Banget al.2010;Sandraet al.2017);and carotenoids in the xanthophyll cycle pathway (such as lutein,neoxanthin,and violaxanthin) are the pigments for yellow flesh (Liuet al.2012;Yoo Kilet al.2012;Jinet al.2019). The study of watermelon flesh color inheritance could be dated back to 1937 (Porter 1937). Several studies have performed heredity analyses among different flesh colors in watermelon,and the results can be summarized as the follows:canary yellow (C) is dominant among most of the flesh colors (c) (such as pink,red,and orange) except for white,which is designatedWfand epistatic to canary yellow (Wehner 2007);red flesh is dominant to orange and salmon yellow,the allelei-CinhibitsCandc,and when the parental genotype presents the homozygous genes (i-C/i-c),theni-Cwould inhibitC,thus promoting theYlocus to produce red flesh (Hendersonet al.1998). These results were not verified by recent findings of Banget al.(2010),who reported that thepygene produces pale yellow flesh using a cross of red and canary yellow flesh color watermelon.
Scientists have reported some major genes or QTLs related to flesh color in watermelon. Hashizumeet al.(2003) performed the first QTL mapping of two red flesh color-related QTLs,which were detected in group 2 and group 8 and accounted for 35.8 and 35.5% of the phenotypic variance,respectively. Redfleshed watermelon starts to accumulate a large amount of lycopene close to the mature stage,and these watermelons have been selected and domesticated from the white-fleshed wild types (Guoet al.2013). The key gene for red flesh color in watermelon isClLCYB,which is annotated as lycopeneβ-cyclase,and it was excavated and finely mapped on chromosome 4 with three genetic populations;in addition,two SNP non-synonymous mutations were found in the coding region ofClLCYBamong red flesh and yellow flesh watermelon accessions (Liuet al.2015;Wanget al.2019). Subsequently,Zhanget al.(2020) conducted cloning and transgenic analyses of theLCYBgene,and their findings revealed that the abundance of the ClLCYB protein,rather than theClLCYBtranscription level,was negatively correlated with lycopene accumulation.ClPHT4;2(annotated as a function of the chromoplast-localized phosphate transporter) determines the development of flesh color through carotenoid accumulation,and it also controls the level of sweetness,which is regulated by the transcription factorsClbZIP1andClbZIP2(Zhanget al.2017). Sandraet al.(2017) mapped a major QTL (qFC.1) associated with β-carotene accumulation for orange flesh on chromosome 1.Yscrproduces the scarlet red flesh color and was initially fine-mapped in a 150-kb region on chromosome 6 (Liet al.2020). In the present study,we fine-mapped a candidate gene related to watermelon flesh color formation. These results may provide a basis for gene function analyses and molecular breeding for watermelon fruit color in the future.
2.Materials and methods
2.1.Experimental materials
The pale yellow-colored watermelon inbred line“Cream of Saskatchewan”(shortened as“COS”;Citrullus lanatussubsp.vulgaris) and white-fleshed“PI 186490”(C.lanatussubsp.mucosospermus) were used as the parental materials for the F1generation and F2population. The seeds of COS and PI 186490 were kindly provided by Dr.Angela R.Davis from the South Central Agricultural Research Laboratory,Agricultural Research Service,U.S.Department of Agriculture. All the experimental materials were grown in a greenhouse on the experimental farm of the Xiangyang Experimental Agricultural Station of Northeast Agricultural University,China. Mature fruits were harvested at 35-45 days after self-pollination,cut longitudinally and then photographed for phenotyping by visual inspection. The flesh color of the parental materials and the main flesh color types in the segregated population are shown in Fig.1. Flesh samples were collected from the center and the surrounding areas in equal parts from the two parents (COS and PI 186490) at 18,26 and 42 days after pollination (DAP),with three biological replicates. Tissues were frozen in liquid nitrogen immediately and stored at -80°C until used for total RNA extraction and RNA-seq.
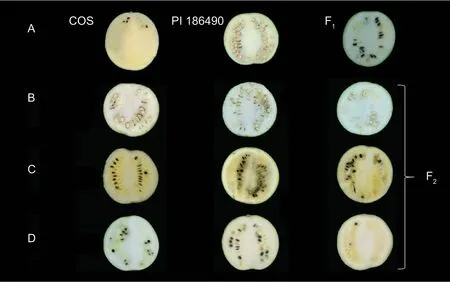
Fig.1 Phenotypes of the parental lines and F1 (A) and F2 (B-D) populations of watermelon. A,COS (pale yellow flesh),PI 186490 (white flesh) and the F1 generation of COS×PI 186490 (pale yellow and white mixed flesh),from left to right. B-D,F2 generation of COS×PI 186490 segregated into different kinds of flesh color (B,white flesh;C,pale yellow and non-pale yellow flesh;D,pale yellow and white mixed flesh).
2.2.Bulked segregant analysis sequencing (BSAseq) and initial mapping
DNA was extracted from the young leaf tissues of the two parents,and the F1and F2populations (284 individuals).For the BSA-seq analysis and initial mapping,20 pale yellow-fleshed and 20 white-fleshed individuals from the F2population were chosen for gene pool construction and re-sequenced using the Illumina HiSeqTMXten platform (Biomarker,Beijing,China). The re-sequencing depth of the parental materials and gene pools was 20×. Resequencing data from the two parental materials and gene pools were aligned to the reference genome of 97103 (V1) (Guoet al.2013) using the Burrows-Wheeler Aligner for detecting nonsynonymous single nucleotide polymorphisms (nsSNPs). Samtools1.0 (Trust Sanger Institute,Hong Kong,China) was used to obtain the Binary Alignment/Map (BAM) files for SNP detection (Henget al.2009),and SNPs were annotated with SnpEff tool (http://snpeff.sourceforge.net/) and then identifiedviastrict criteria described by Silvaet al.(2012). Based on the SNP loci sequence,SNP2CAPS Software (Institute Plant Genetics &Crop Plant Research,Gatesleben,Germany) was used to detect the mining of cleaved amplified polymorphic sequences (CAPS) loci.Uniform CAPS loci that were evenly distributed on the target chromosome were selected for the PCR primer design. CAPS primers were filtered through six restriction endonucleases (HindIII,TaqI,ScaI,XhoI,EcoRI andBclI,New England Biolabs,United States),with the sequences in the BSA-seq region. In the genomic locations where SNPs could not be converted into CAPS markers,we used LGC-Kompetitive allele-specific PCR (LGC-KASP) markers for further analysis,which was performed at the Vegetable Research Center of the Beijing Academy of Agricultural and Forestry Sciences,China. Genotyping of the F2individuals was performed with the polymorphic CAPS and KASP markers. Genetic linkage and QTL analyses were performed with IciMapping V3.3 Software (Menget al.2015). The linkage groups in the map were represented by the Map Chart 2.1 Software package (Voorrips 2002).
2.3.Fine mapping and candidate gene annotation
Molecular markers at both ends of the preliminary location interval were used to screen the recombinant individual plants among the 1 260 F2individuals. CAPS markers were continuously designed at the preliminary region,and the recombinant individuals were used to further narrow the localization interval. The recombined individuals were set in the greenhouse of the Xiangyang Experimental Agricultural Station of Northeast Agricultural University,China in the spring of 2018. Mature fruits were cut and photographed after maturity for the determination of flesh color. Recombinants with the received trait (yellow flesh) were selected to narrow down the mapping region. Candidate genes in the fine mapping region were predicted and annotated according to the reference genome of cultivar 97103 (V1) (Guoet al.2013).
2.4.Candidate gene cloning and gene structure variation analysis in the carotenoid pathway between the two parental materials
To analyze the differences between the candidate genes in the fine mapping region between the two parents,we cloned the CDS sequence of the candidate geneCla007528,and non-synonymous mutations were identifiedviathe alignment of the parents’ resequencing data. The primers forCla007528cloning are as follows:forward (5´-3´):ATGGCTATGGCTACTGCTTCTTTTC and reverse (5´-3´):TACTAAGGAGTCAGCCATTTTCAGA.After total RNA extraction and the formation of target cDNA fragments,the target gene was ligated with the pMD18-T vector and transferred intoEscherichiacoliDH5α competent cells (Code no.9057,TaKaRa). Finally,bacterial liquid PCR and agarose gel electrophoresis were used for positive detection. The positive bacterial liquid was sent to Sangon Biotechnology (Shanghai,China) for sequencing. Sequence comparisons were performed using DNAMAN Software (Lynnon Biosoft,United States) to analyze the differences in candidate genes between the parents. IGV Software was used to compare the nine key genes in the carotenoid metabolism pathways,namely,ClPSY1(Cla009122),ClZDS(Cla003751),ClNCED-7(Cla005404),ClCRTISO(Cla017593),ClCHYB(Cla006149),ClLCYB(Cla005011),ClPDS(Cla010898),ClNCED-1(Cla009779),andClCHXE(Cla011420),with the resequencing data of the two parents.
2.5.RNA-seq analysis of COS and PI 186490 and RT-PCR validation
Flesh samples for RNA extraction were collected randomly from the center of five injury-free watermelon fruits from each accession (three out of the five fruits with a consistent growth status were selected for RNAseq) at three different ripening stages (18,26 and 42 DAP) of the two parents. The strand-specific RNAseq libraries were prepared according to the protocol of Zhonget al.(2011) and sequenced on an Illumina HiSeq 2000 system using the single-ended 100-bp mode (Bolgeret al.2014). Three replicates of each sample were performed. Total mRNA was enriched by the Ribo-ZeroTMMagnetic Kit (Epicentre,USA). After the mRNA was fragmented into short fragments,it was reverse transcribed into cDNA. The cDNA fragment was purified and connected to the Illumina sequencing adapter,and then sequencing was performed. The RNA-seq data were analyzedviaTopHat (version 2.0.3.12) (Trapnellet al.2009),which was based on Bowtie analysis (Langmeadet al.2009) for the fragment mismatches and reads alignment to the watermelon genome (Guoet al.2013).After performing the comparison,the number of reads mapped to each watermelon gene model was derived and then standardized to the number of reads per kilobase of transcript per million mapped reads (RPKM). To identify differentially expressed genes (DEGs) during fruit development,the variance stabilization data module in DESeq (Anders and Huber 2010) was used to transform the original data. The raw sequencing data have been stored in the NCBI SRA under number PRJNA587316.
The expression patterns of the candidate genes in the fine mapping region (Table 1) and carotenoid metabolic pathway genes,namely,ClPSY1(Cla009122),ClZDS(Cla003751),ClNCED-7(Cla005404),ClCRTISO(Cla017593),ClCHYB(Cla006149),ClLCYB(Cla005011),ClPDS(Cla010898),ClNCED-1(Cla009779) andClCHXE(Cla011420),were verified by qRT-PCR analysis performed with qTOWER3G (Analytik Jena AG,Germany) (Appendix A). First-strand cDNAs were synthesized using a ReverTra Ace qPCR RT Kit (code:FEQ-101) from Toyobo (Osaka City,Japan). Each sample was analyzed with three biological replicates.Cla020175was used as the internal control (Wanget al.2016). The relative gene expression levels were determined by the 2ΔΔCTmethod (Schmittgen and Livak 2008;Rene and Thomas 2016).

Table 1 Functional annotation of candidate genes in the fine mapping region
3.Results
3.1.Initial mapping and fine mapping
The flesh color of the genetic population is shown in Fig.1,and the major flesh color of the F1was white with a little yellow flesh in the seed cavity. In the F2population,20 plants had pale yellow flesh (phenotyped as“2”),23 plants had white flesh (phenotyped as“0”) and 241 plants had pale yellow and white mixed flesh (phenotyped as“1”,Fig.2). BSA-seq identified the preliminary localization interval in a 2.67-Mb region (from 5 836 700 to 8 514 460) located on chromosome 6 (Fig.3). In this interval,60 pairs of CAPS primers were designed and 35 were used as polymorphism markers.The F2generation population was genotyped by selecting 12 pairs out of the 35 polymorphism CAPS markers with clear amplification bands and even distribution in the BSA-seq region,and another seven markers were designed by LGC-KASP. According to the genotype results of 19 markers,two markers (chr06_8566303andchr06_9015828) were used to perform partial segregation after the chi-square test. After the linkage analysis and QTL mapping,we obtained a linkage group spanning 52.97 cM;however,the CAPS markers and LGC-KASP markers were found to be uniformly distributed on the linkage group and consistent with the physical location of each marker in the genome. An obvious QTL signal (LOD=3.9) related to flesh color was detected between markerschr06_7045768andchr06_7972466(Fig.4),and spanned a 926.698-kb region with 56 candidate genes.Subsequently,288 recombinants were screened from 1 260 F2individuals using the markerschr06_7045768andchr06_7972466. In addition,12 polymorphic CAPS markers were developed in the preliminary mapping region for further shortening of the positioning interval.According to the genotypes of five received-trait (yellow flesh) recombinants,we narrowed down the mapping region to 66.8 kb,and nine candidate genes were found between markerschr06_7072008andchr06_7005204(Fig.5).
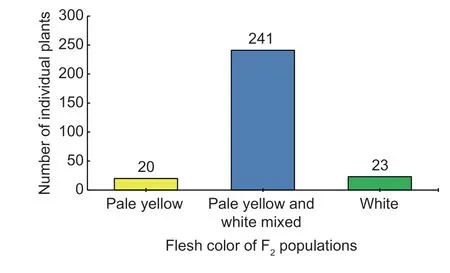
Fig.2 Inheritance of the mature flesh color traits in the F2 populations of watermelon.
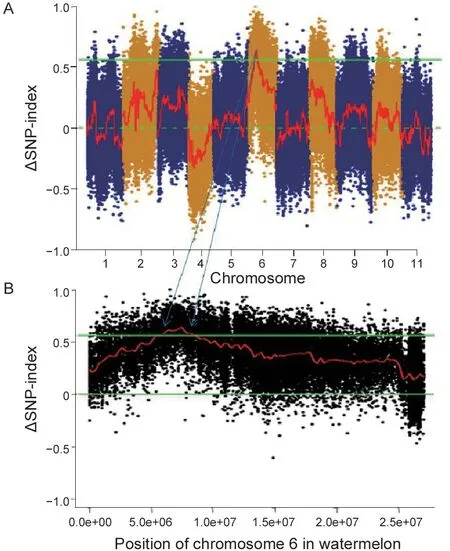
Fig.3 Bulked segregant analysis (BSA) targeting candidate intervals. A,BSA analysis of flesh color across 11 chromosomes in watermelon. B,detailed distribution of SNP on chromosome 6. The upper solid green line represents a threshold value of 0.99 confidence interval. BSA targeting candidate interval is located on chromosome 6,from 5 836 700 to 8 514 460 bp.
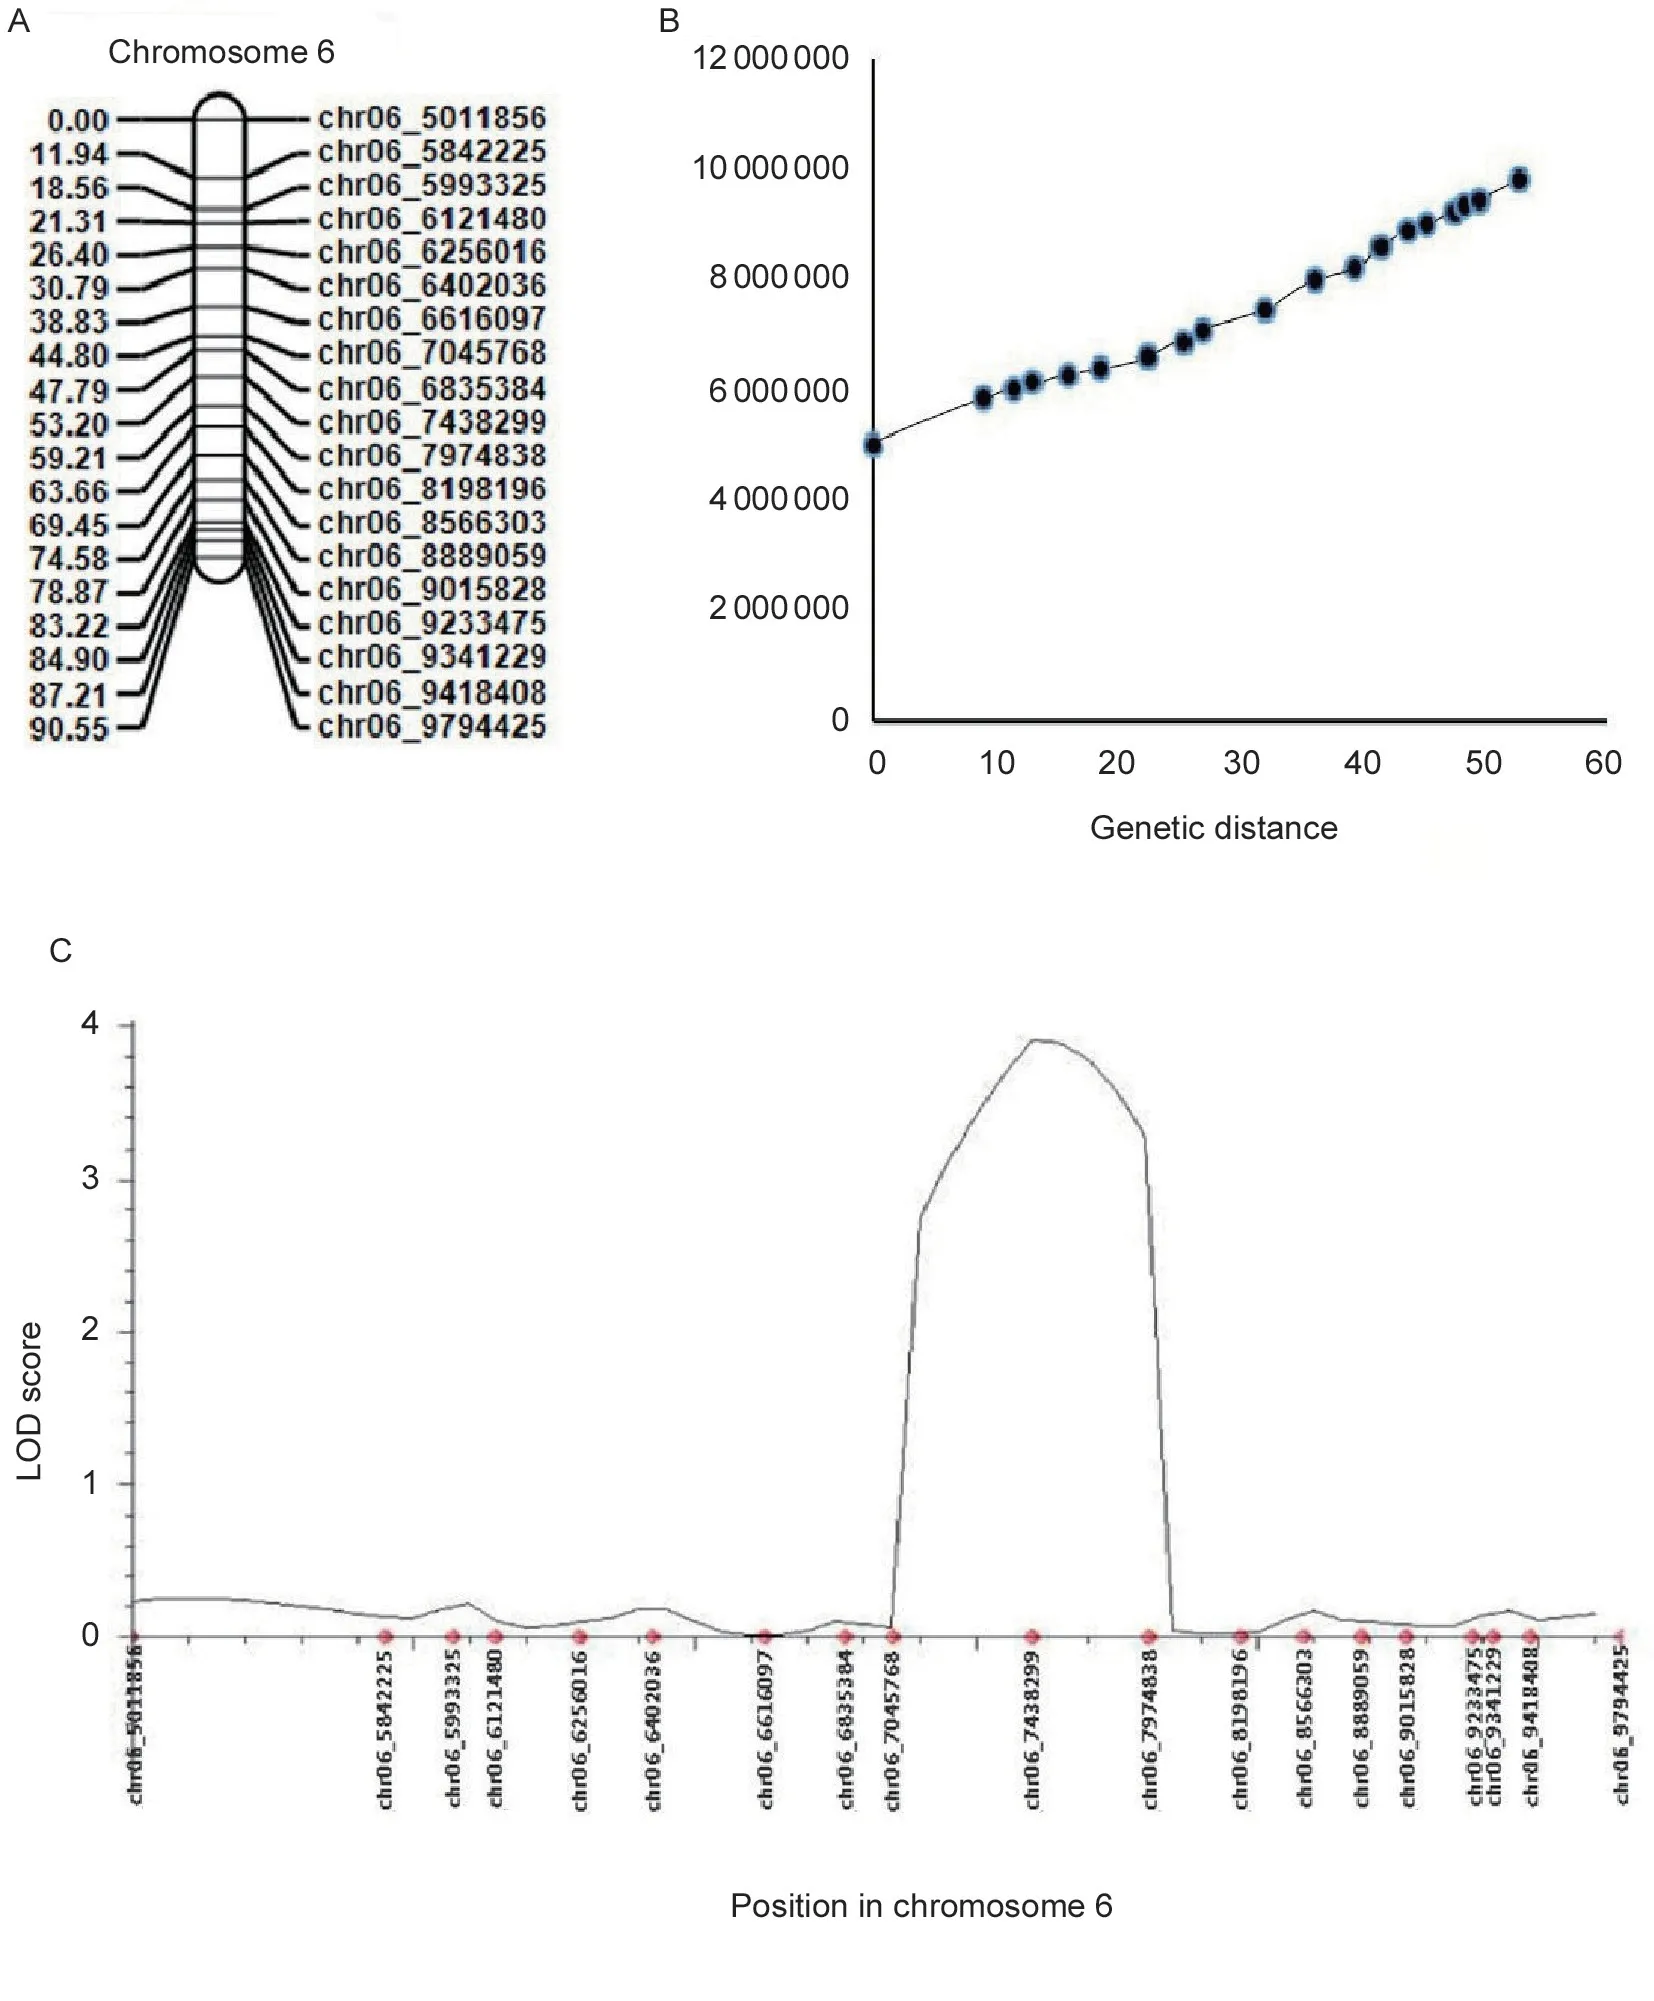
Fig.4 Genetic linkage map and its collinearity analysis. A,genetic linkage map within the preliminary localization interval. B,collinearity analysis of the genetic linkage map within the preliminary localization interval. C,QTL analysis of the major pale yellow flesh genes in the localization region.
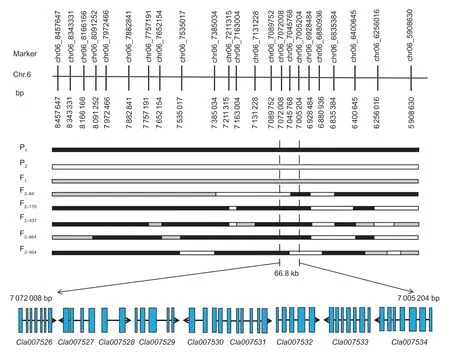
Fig.5 Fine mapping of the genes that control the color of watermelon pale yellow flesh through recombinant recessive individuals and the candidate genes in the fine mapping interval. P1 black frame represents the parent material COS;P2 white frame represents the parent material PI 186490;F1 is the gray frame;F2-64,F2-170,F2-437,F2-664,and F2-954 are recessive recombinant individuals with pale yellow flesh.
3.2.Candidate gene prediction and expression analysis
A comparison and analysis of the candidate gene sequences between the two parents with the resequencing data showed that only theCla007528gene had a non-synonymous mutation in the coding region,while theCla007526gene had one synonymous mutation in the coding region,and the remaining seven candidate genes had no mutation in the coding region. Referring to the RNA-seq results,onlyCla007528was found to be differentially expressed between both parents. Therefore,this gene may be considered the main candidate gene (Appendix B). We cloned the coding region ofCla007528in both parents for a comparative analysis. Upon comparison of the candidate gene sequences between the two parents with the clone resequencing data,four SNP mutations (at the 46th,50th,453rd and 806th bases,respectively) (Appendix C) were found in the exon of a candidate gene (Cla007528),although only two mutation sites were found based on the parental resequencing data alignment. Among the exons of the candidate gene (Cla007528),four SNPs led to three amino acid changes (mutation of the 46th base from C/G to G/C resulted in the 16th amino acid changing from arginine [R] to glycine [G],mutation of the 50th base from C/G to A/T resulted in the 17th amino acid changing from serine [S] to tyrosine [Y],mutation of the 453rd base from A/T to C/G did not cause an amino acid change,and mutation of the 806th base from G/C to A/T resulted in the 269th amino acid changing from cystine [C] to tyrosine [Y]),and the nonsynonymous mutations were consistent with the results of the parental resequencing comparison (Appendix C).
One KASP marker (chr06_7040350) was designed according to the non-synonymous SNP in theCla007528coding region and genotyped with 22 pale yellow-fleshed and pale yellow mixed with white individuals and 22 white-fleshed individuals from the F2generation. The genotyping results obtained with thechr06_7040350marker showed that there were 14 individuals consistent with the genotype of COS (C/C),eight individuals consistent with the genotype of F1(G/C) and no individuals consistent with the genotype of PI 186490 (G/G) in the group with pale yellow flesh and pale yellow mixed with white. However,the white-fleshed individuals contained two individuals consistent with the genotype of C/C,10 individuals with the same genotype as G/C,and 10 individuals consistent with the genotype of G/G (Appendix D). Additionally,chr06_7040350marker was also verified in nine watermelon lines with different flesh color with the genome re-sequencing data,the base mutation (G/G) occurred in line PI 186490 (white flesh) and ZXG1555 (green flesh) which did not accumulate any colored carotenoids in the mature fruits. Also,thechr06_7040350mutation did not occur in other colored watermelon lines (Appendix E). The analysis of the above results showed thatchr06_7040350on the candidate gene could effectively distinguish the color of the flesh,although some individuals could not be distinguished accurately,which may be related to this gene representing a QTL that regulates the formation of pale yellow flesh in watermelon.
3.3.Overview of the RNA-seq results
Screening out the interference factors,such as sequencing joints,primer sequences and low-quality data,a total of 116.28 Gb of clean data was obtained. Moreover,6.46 Gb of clean data was found for each sample and the Q30 base percentage was at least 92.87%. The clean reads of each sample were sequentially aligned with the designated reference genome,and the alignment efficiency ranged from 94.12 to 95.84%. The results of the Pearson coefficient correlations were good,DEGs were identified according to their expression levels in different samples,and functional annotation and enrichment analyses were performed. Large numbers of DEGs were highly expressed in the pairwise comparison as the fruit matured,and fruit color was continuously accumulated as the fruit ripened. The number of DEGs in the intergroup comparison increased sharply,especially at 42 DAP,and the quantity of the DEGs was significantly larger in this group than the other groups (Appendix F).
Based on the mapping results,we paid attention to the“carotenoid biosynthesis”,“photosynthesis”,and“porphyrin and chlorophyll metabolism”pathways. From the RNA-seq results,six and nine DEGs were enriched (P<0.05) in this metabolic cycle from line COS at 26 and 42 DAP,respectively. This finding demonstrated that more vital proteins were encoded by these DEGs. For example,ClPSY,ClLCYB,ClCHYB,ClZEPandClNCEDparticipated in this cycle to regulate the formation of flesh pigments (lycopene,carotene,lutein,zeaxanthin,and neoxanthin) as the fruit matures (Fig.6-A and B).In addition,geranyl-geranyl pyrophosphate (GGPP) is involved in the carotenoid metabolism cycle and photosynthesis cycle as the main precursor (Fig.6-A).Therefore,the key significantly enriched DEGs (P<0.05) related to the photosynthetic cycle were analyzed. In the pathways“photosynthesis”and“photosynthesisantenna proteins”,three DEGs encoded oxygenevolving enhancer proteins,which were involved in the regulation of photosystem II;three DEGs encoded photosystem I reaction center subunits,which can form complexes with ferredoxin in photosystem I;three DEGs encoded ferredoxin,which were filtered from our results;four DEGs encoded the chlorophylla-bbinding proteins;and one DEG encoded the light-harvesting complex II protein (LHCP). The LHCP functions as a light receptor that captures and delivers excitation energy to photosystems I and II,with which it is closely associated. The important DEGs identified above all participated in the active regulation of photosynthesis,and most of them showed a high level of expression at 26 DAP in line COS. In addition,as the fruit matures,all these DEGs showed higher transcriptional levels in line COS than line PI 186490 (Fig.6-B). In addition to the above pathways,DEGs significantly enriched (P<0.05) in“porphyrin and chlorophyll metabolism”were filtered and two DEGs that encode chlorophyll(ide)breductase NYC1 and 7-hydroxymethyl chlorophyll a reductase,which are involved reducing photosynthetic efficiency,were identified. They showed 6.76-and 4.83-fold higher transcriptional expression in line COS than in line PI 186490 at 42 DAP,respectively. Both DEGs showed an increasing expression trend in line COS and were relatively stable in line PI 186490. The DEGCla007528that encodes chlorophyllase was also enriched (P<0.05) in this pathway and screened from previous fine mapping work,and it showed a high level of expression in line PI 186490 at 26 DAP. The above results might suggest that the significant enrichment of DEGs in line COS participate in improving and reducing photosynthesis to achieve a balanced use of GGPP (Yuanet al.2015). Moreover,in line PI 186490,chlorophyllase accelerated chlorophyll degradation and reduced photosynthetic efficiency. As a result,more GGPP was likely consumed to supplement the photosynthesis cycle and the content of GGPP used in the carotenoid cycle was significantly reduced,thus affecting the color of the flesh (Fig.6-A).
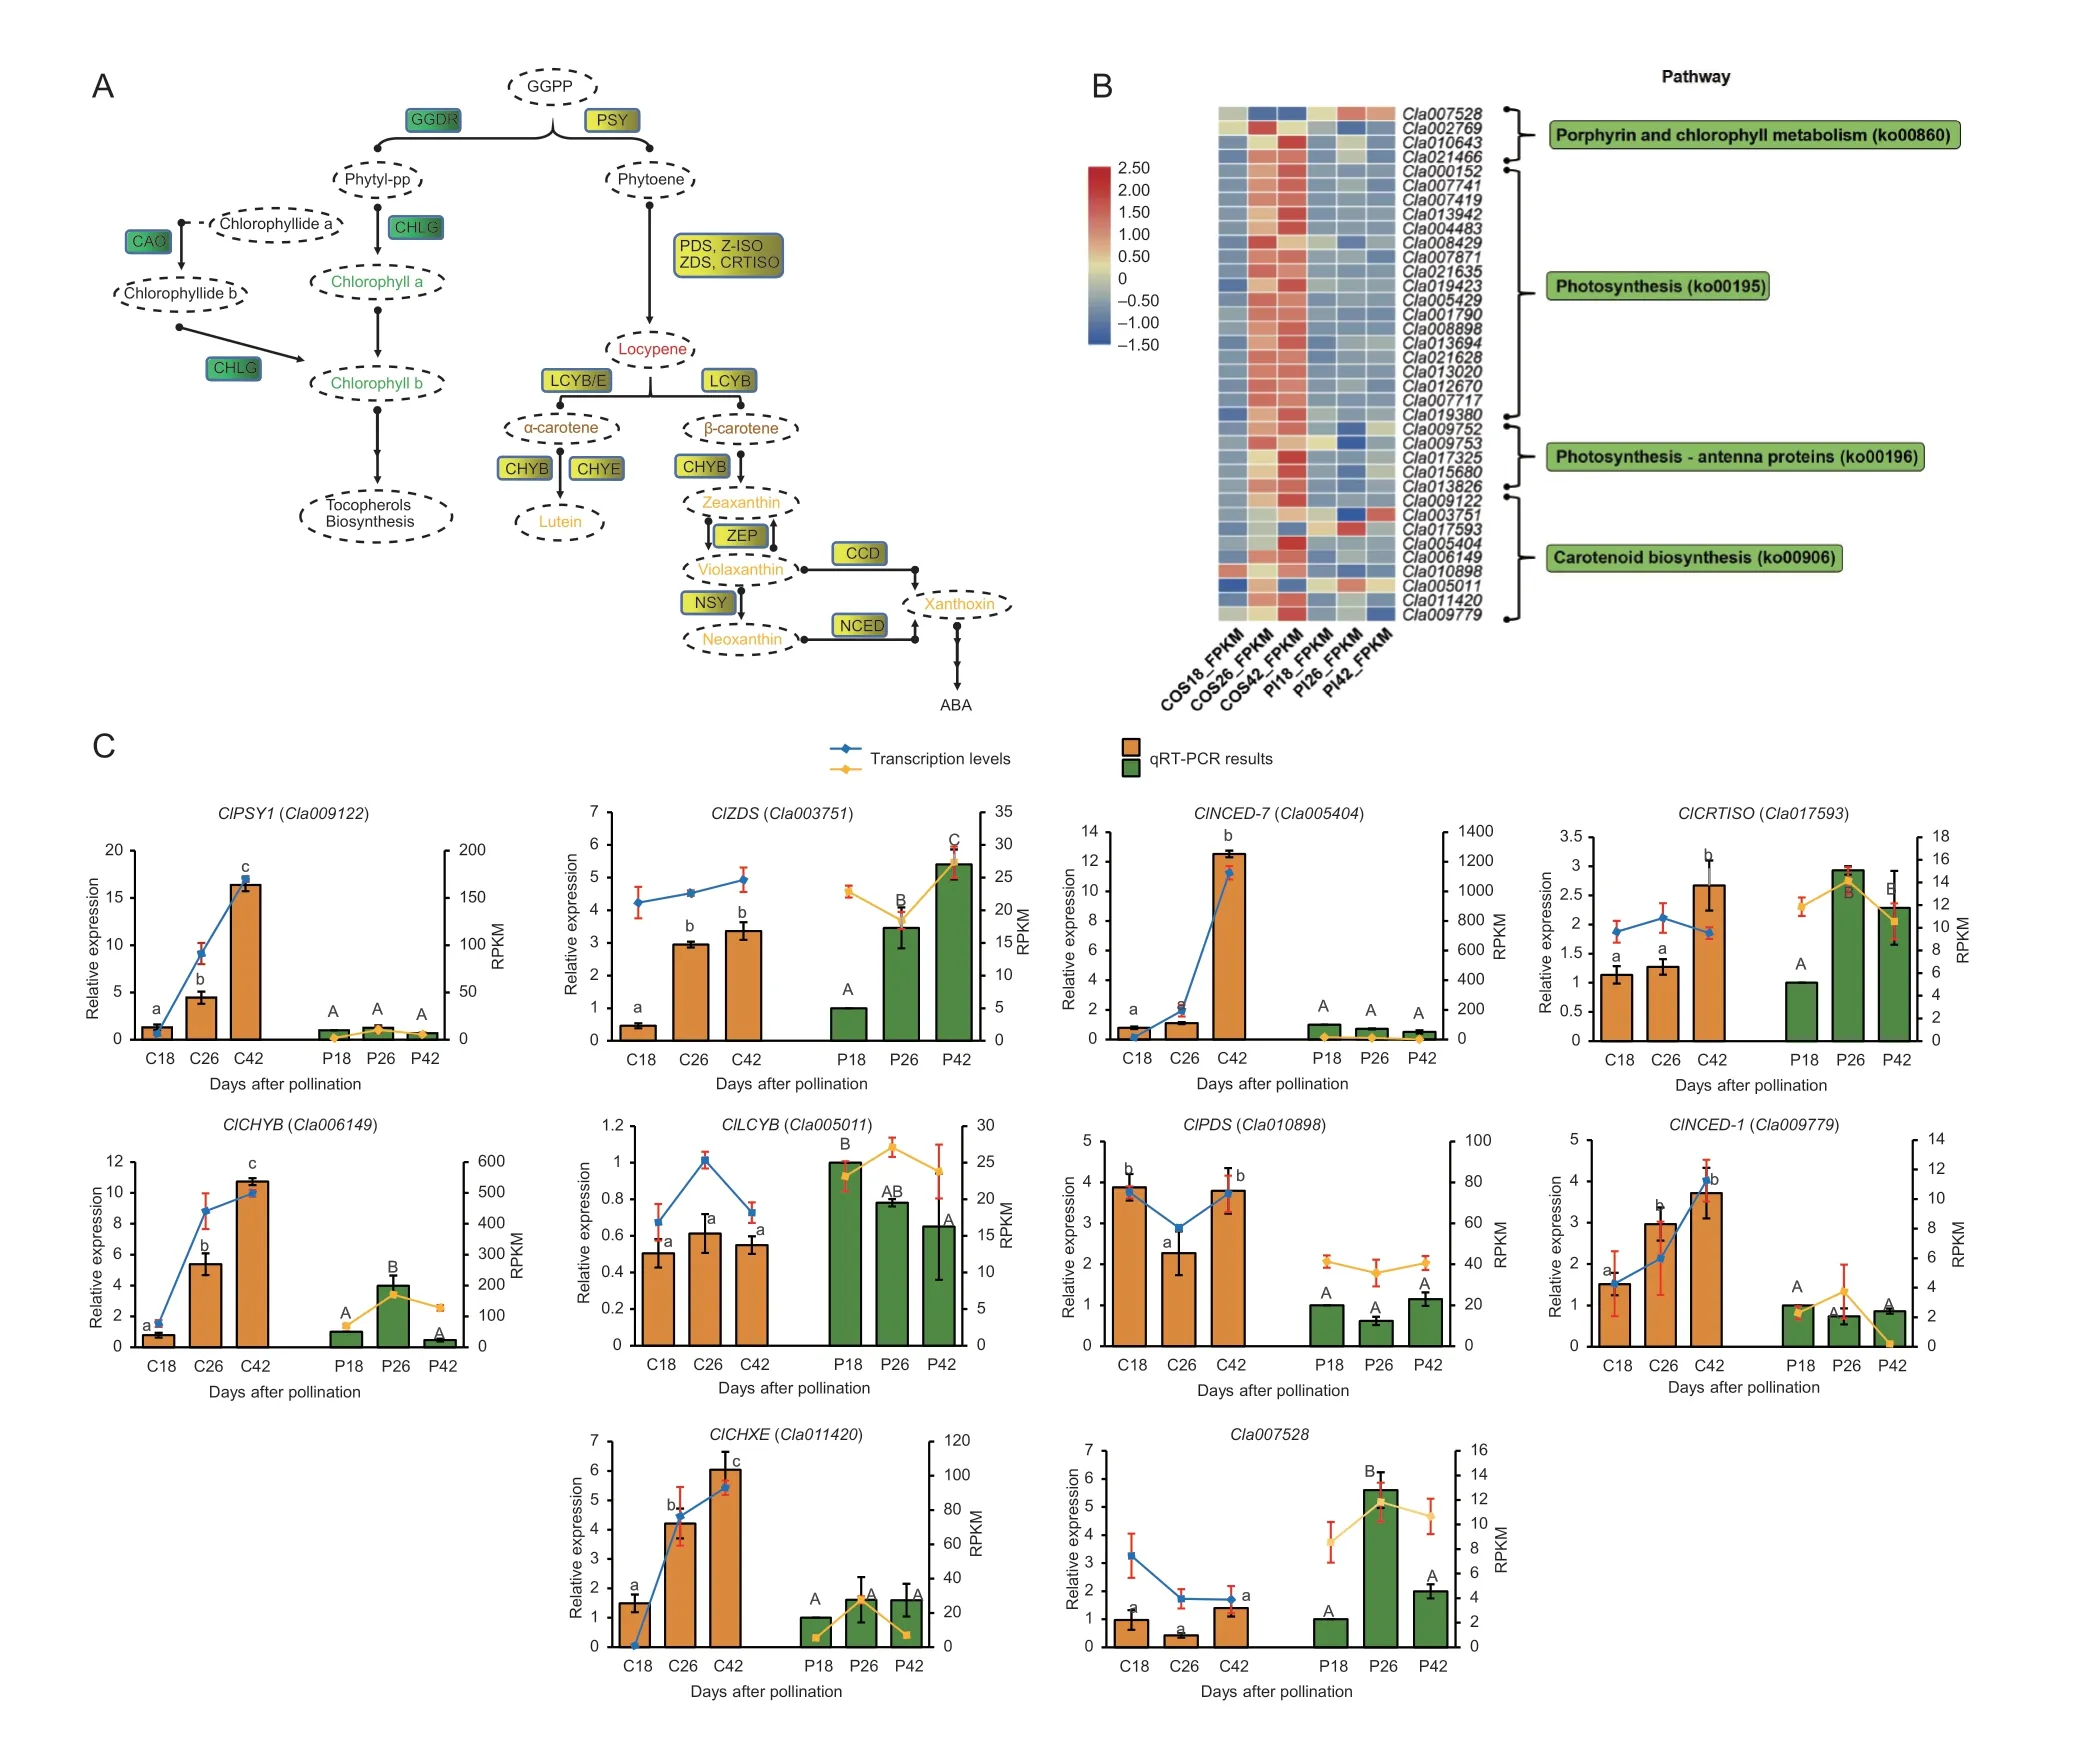
Fig.6 Expression pattern analysis of key differentially expressed genes (DEGs) involved in the pathway related to carotenoids and the photosynthesis metabolic cycle. A,biochemical pathways of carotenoid and chlorophyll within the co-precursor geranyl-geranyl pyrophosphate (GGPP). B,transcriptional level of key DEGs involved in the pathways that are closely correlated with carotenoid synthesis and photosynthesis. The abscissa represents different time periods after pollination of line COS and PI 186490,and the ordinate represents the annotated genes. The depth of the module color represents the amount of gene expression (RPKM).C,expression levels of one candidate gene and nine major genes of the carotenoid synthesis pathway in COS and PI 186490 obtained via RNA-seq and qRT-PCR. C18,C26 and C42 represent COS at 18,26 and 42 days after pollination,and PI18,PI26,and PI42 represent PI 186490 at 18,26 and 42 days after pollination,respectively. Means with different lowercase letters and uppercase letters differed significantly among the development stages in the same accession P≤0.05 and P≤0.01,respectively. Vertical bars indicate standard errors.
3.4.Expression profiles of genes in the carotenoid pathway
To provide further insight into flesh color formation,we also checked the expression pattern of nine carotenoid pathway genes in different flesh development stages between the two parental materials based on RNAseq data and qRT-PCR technology (Fig.6-B and C).ClPSY1is the key“switch gene”of the carotenoid metabolic pathway and showed a continuous growth trend in COS and significantly higher relative expression in COS than in PI 186490. The expression level ofClPDSwas significantly higher in COS than PI 186490,and the expression levels ofClCHYBandClCHXEwere higher in COS than PI 186490 and continued to rise as the fruit ripened,with the expression of both genes showing similar levels. Based on the expression level and pattern,ClNCED-7andClNCED-1may play an important role in flesh color formation. ForClNCED-7,at 42 DAP,COS showed significantly higher expression levels compared with PI 186490,while forClNCED-1,significant differences were exhibited through the whole developmental stage.ClZDS,ClCRTISOandClLCYBwere relatively consistent between lines COS and PI 186490. These results show that most of the above described DEGs involved in the biosynthesis pathway of carotenoids showed an increasing trend in COS and the encoded products accumulated with plant growth. Additionally,Cla007528encoding chlorophyllase was increased considerably in PI 186490 compared with COS,and it contributes to regulating flesh color changes. We also compared the sequence variation and gene structure of the carotenoid pathway genes that exhibited significantly different gene expression patterns based on the re-sequencing data of COS and PI 186490. A singlenucleotide mutation in the exon ofClNCED-1led to one amino acid change (the 832nd base had a G/C to A/T mutation,resulting in the 278th amino acid changing from valine [V] to isoleucine [I]) (Appendix G).ClPSY1,ClNCED-7,ClCRTISO,ClCHYB,ClPDS,andClCHXEdid not have any non-synonymous mutations or gene structure variations in the coding region.
4.Discussion
According to previous research,chlorophyll is known to exist primarily in chloroplasts that contain carotenoids and chlorophyll enzymes have been identified as the key genes for chlorophyll degradation. In the chlorophyll synthesis pathway,the degradation of chlorophyll is closely related to the formation of carotenoids and pigment proteins,and chlorophyllase plays an extremely important role (Tripathy and Pattanayak 2012). Color change is associated with the degradation of chlorophylls and the shift of the carotenoid composition between xanthophylls and carotenes (mainly phytoene,lycopene and β-carotene) as described by Enfissiet al.(2016). In addition,the formation of the photosystem complexes of the chloroplast thylakoid membranes requires carotenoids,chlorophylls,and various apoproteins (Thornberet al.1987;Herrinet al.1992;Vonet al.1995). Carotenoids absorb light in the blue region of the spectrum (400-600 nm),and the absorbed energy can be transferred to chlorophylls (Bartley and Scolnik 1995).Cla007528showed higher expression in PI 186490 than in COS at three time points (18,26 and 42 DAP) as indicated by the transcriptome and qRT-PCR results.Chlorophyllase generally plays an important role in the degradation of chlorophyll and is closely related to the carotenoid metabolic pathway (Tripathy and Pattanayak 2012). The degradation of chlorophylls is slow,while the accumulation of carotenoids is rapid (Yuanet al.2015). Since the GGPP molecule is a direct precursor to the biosynthesis of these functionally related molecules,it also serves as an important metabolic hub in the biosynthesis of the basic components of photosynthesis (Meieret al.2011).
According to the Kyoto Encyclopedia of Genes and Genomes (KEGG) analyses of COS and PI 186490 transcriptome data,we also found that the DEGs of COS were significantly enriched in photosynthesis,carotenoid biosynthesis and other metabolic processes in the plant hormone signal transduction pathway,among which the carotenoid biosynthesis and phytohormone signal transduction pathways contained a series of DEGs with positive effects on the regulation of flesh color changes.In the carotenoid biosynthesis pathway,we found nine major genes that were differentially expressed at different times in the parent.ClPSY1,ClCHXE,ClCHYB,ClNCED-7andClNCED-1presented significantly lower concentrations in PI 186490 than COS. In our previous research (Fanget al.2020),we used liquid chromatography-tandem mass spectrometry (LC-MS/MS) to determine the pigment contents of COS and PI 186490 in mature flesh (42 DAP) and found that the pigments phytoene,violaxanthin and lutein presented primary differences between the two accessions. Interestingly,the synthesis of the three kinds of carotenoids corresponded to the significant DEGs forClPSY1,ClCHXE,ClCHYBandClNCEDs in our research.
ClPSY1is generally considered to be the most important regulatory enzyme in this pathway. Feedback regulation within the carotenoid pathway and among carotenoids,MEP and ABA can regulate the supply of isoprene substrates and the accumulation of carotenoids and ABA (Römeret al.2000;Beyeret al.2002;Cuttrisset al.2007;Baiet al.2009). Zhuet al.(2011) found that under light induction,the high expression of thePSYgene can activate the MEP pathway and increase the content of GGPP substrate. HigherClPSY1expression resulted in higher levels of precursor metabolites,and the expression level ofClPSY1was significantly higher in COS than PI 186490,which led to a higher content of the phytoene in COS than PI 186490 (Fig.6-C). The expression of theCla007528gene in PI 186490 was obviously higher than in COS in the three periods. The low expression ofCla007528in COS may result in a low level of chlorophylldecomposed substrate and lead to an accumulation of GGPP substrate,which is consumed in the carotenoid pathway. The high expression ofClPSY1in COS resulted in a high content of phytoene,which acts as the upperstream substrate in carotenoid generation. Our results are consistent with previous research showing that the GGPP substances produced in the MEP metabolic pathway not only act as the starting substrate for the carotenoid metabolic pathway but also for the chlorophyll pathway. The synthesized precursors are the result of linking the important metabolic hubs of the carotenoid metabolism pathway and the chlorophyll synthesis pathway (Meieret al.2011),and they represent the processes by whichClPSY1regulates the first important step in the formation of carotenoids.ClPDSconverts the upstream phytoene to ε-carotene,which is the substrate for lycopene regulated byClZDS. The high expression ofClPDSin COS may be related to the higher phytoene contents in the decomposed substrate. However,the expression ofClCRTISO,ClZDSandClLCYBgenes in the two parents were almost the same,which might be related to the digestive capacity of their enzymatic activity or protein level. According to the analysis of RNA-seq data and qRT-PCR results,the expression ofClCHYB,ClNCED-1andClNCED-7genes,which are related to the xanthophyll cycle,increased during fruit growth and development in COS and were significantly higher in PI 186490,especially at 42 DAP (Fig.6-B and C).ClCHYBadjusts and controls the accumulation of zeaxanthin,andClNCEDs are involved in the formation and accumulation of ABA,which is strictly coordinated and controlled by source and library metabolites (Fig.6-A).This finding is in line with our pigment substance results in the parent material. The high expression ofClCHYBandClNCEDs in the COS line may cause a large amount of violaxanthin accumulation. These results are consistent with the discovery of a large amount of violaxanthin in COS (Fanget al.2020). Furthermore,NCEDis believed to be involved in the synthesis of the phytohormone ABA,which controls abiotic stress signaling pathways at the end of the carotenoid metabolic pathway (Cazzonelli and Pogson 2010).ClNCEDscontribute to the biosynthesis of ABA,and the high expression ofClNCEDs can produce a large amount of ABA in COS and lead to negative feedback adjustments for chlorophyllase.
InPiper betleL.landrace KS,ABA upregulates the expression of chlorophyllase (Guptaet al.2012),and during tomato ripening,the production of ABA could enhance the degradation of chlorophyll (Suet al.2015).TheCla007528gene may regulate chlorophyll degradation through feedback regulation with ABA,thereby affecting the accumulation of xanthophylls,neoxanthin,zeaxanthin and violaxanthin in carotenoid substances. Therefore,ClPSY1,ClCHYB,ClNCED-7andClNCEDsare related to the carotenoid metabolism pathway and highly expressed because of the low level of chlorophyllase in COS,and these genes play a positive role in regulating the accumulation of flesh color during fruit growth and development. Previous work has shown that during the photoinduction process,thechyb,bktandpsygenes were upregulated and chlorophyll synthesis-related genes were downregulated,which is beneficial to promoting the transformation of GGPP into carotenoids. Subsequently,lutein could be synthesized. In short,chlorophyllase encoded byCla007528is very likely a core element that regulates the carotenoid metabolic pathways in COS and PI 186490 and controls the flesh color through the accumulation of vital pigments violaxanthin and lutein,which accumulated in COS to generate its flesh color.
5.Conclusion
We used the BSA-seq method and then finely mapped the QTLs of watermelon flesh color to a 66.8-kb segment with 1 260 F2individuals on chromosome 6.Cla007528,which encodes chlorophyllase,presented non-synonymous mutations and was significantly expressed between the parental materials throughout flesh development,and it was also considered the most likely candidate gene.ClPSY1,ClCHYB,ClNCED-1andClNCED-7all exhibited differential expression patterns between the two parental lines at different flesh color formation stages based on the RNA-seq data and qRT-PCR validation.
Acknowledgements
This work was supported by the National Natural Science Foundation of China (31601775),the Project of China Postdoctoral Science Foundation (2017M611345),the earmarked fund for China Agriculture Research System of MOF and MARA (CARS-25),and the Natural Science Foundation of Heilongjiang Province,China (C2017034).
Declaration of competing interest
The authors declare that they have no conflict of interest.
Appendicesassociated with this paper are available on http://www.ChinaAgriSci.com/V2/En/appendix.htm
杂志排行
Journal of Integrative Agriculture的其它文章
- Lignin metabolism regulates lodging resistance of maize hybrids under varying planting density
- Adoption of small-scale irrigation technologies and its impact on land productivity:Evidence from Rwanda
- Comparison of grain yield and quality of different types of japonica rice cultivars in the northern Jiangsu plain,China
- Natural nematicidal active compounds:Recent research progress and outlook
- lmproving grain appearance of erect-panicle japonica rice cultivars by introgression of the null gs9 allele
- Comparative transcriptome analysis of different nitrogen responses in low-nitrogen sensitive and tolerant maize genotypes
