Comparative transcriptome analysis of different nitrogen responses in low-nitrogen sensitive and tolerant maize genotypes
2021-06-24DUQingguoYANGJuanShahSYEDMUHAMMADSADlQYANGRongxinYUJingjuanLlWenxue
DU Qing-guo,YANG Juan,Shah SYED MUHAMMAD SADlQYANG Rong-xinYU Jing-juan,Ll Wen-xue
1 National Engineering Laboratory for Crop Molecular Breeding/Institute of Crop Sciences,Chinese Academy of Agricultural Sciences,Beijing 100081,P.R.China
2 State Key Laboratory of Agrobiotechnology,College of Biological Sciences,China Agricultural University,Beijing 100193,P.R.China
Abstract Although previous researches have greatly increased our general knowledge on plant responses to nitrogen (N) stress,a comprehensive understanding of the different responses in crop genotypes is still needed. This study evaluated 304 maize accessions for low-N tolerance under field conditions,and selected the low-N sensitive Ye478 and low-N tolerant Qi319 for further investigations. After a 5-day low-N treatment,the typical N-deficient phenotype with yellowing older leaves was observed in Ye478 but not in Qi319. After the 5-day low-N stress,16 RNA libraries from leaf and root of Ye478 and Qi319 were generated. The differentially expressed genes (DEGs) in the root of Qi319 up-regulated by special N deficiency were mainly enriched in energy-related metabolic pathways,including tricarboxylic acid metabolic process and nicotinamide metabolic process. Consistent with yellowing older leaves only observed in Ye478,the special N deficiency-responsive DEGs related to thylakoid,chloroplast,photosynthetic membrane,and chloroplast stroma pathways were repressed by low-N stress in Ye478. A total of 216 transcription factors (TFs),including ZmNLP5,were identified as special N deficiencyresponsive TFs between Qi319 and Ye478,indicating the importance of transcriptional regulation of N stress-responsive pathway in different tolerance to low-N stress between crop genotypes. In addition,15 miRNAs were identified as DEGs between Qi319 and Ye478. Taken together,this study contributes to the understanding of the genetic variations and molecular basis of low-N tolerance in maize.
Keywords:maize,genotype,nitrogen,RNA-seq,differentially expressed genes
1.lntroduction
As the basic constituent of protein,nucleic acid and phospholipid,nitrogen (N) is essential for plant growth and development. To obtain high yields,excessive chemical N fertilizer was applied in the field. In 2010,the average N application was 51 Tg N yr-1with a 25% nitrogen use efficiency (NUE) in China;in contrast,the average N application was 21 Tg N yr-1with a 68% NUE in the USA (Zhanget al.2015). Over-application of N fertilizer not only increased the input cost for farmers but also eventually accelerated greenhouse gas emissions,soil acidification and water eutrophication (Juet al.2009;Guoet al.2010;Cuiet al.2018). It is therefore imperative to understand the molecular mechanisms of low-N tolerance in plants and to breed crop cultivars with improved NUE.
Nitrate or ammonium concentration in soil solutions varied from 100 μmol L-1to 10 mmol L-1(Milleret al.2007). To overcome N variations in the soil,plants have evolved sophisticated adaptive strategies,including morphological,physiological and biochemical mechanisms (Stittet al.2002;Vidal and Gutiérrez 2008). Under mild N limitation,primary and lateral root length ofArabidopsisincreased (Gruberet al.2013);whereas the total root development was delayed under severe N limitation (Arayaet al.2015). The axile root length,lateral root density and crown root number of maize were also regulated by N supply (Wanget al.2004;Liet al.2021a;Gaoet al.2015). Plants also tuned their transport activity to compensate N variations in the soil (Gojonet al.2009). These adaptations to N variations in the soil were at least partially dependent on changes in gene expression (Vidal and Gutiérrez 2008).
Some microarray and RNA-seq analysis of plants,including maize,have revealed that N-responsive genes were involved in a wide range of biological processes (Palencharet al.2004;Gutiérrezet al.2007;Wanget al.2007;Biet al.2014;Muet al.2017). Transcriptome analysis found that low-N stress reduced the expression levels of genes related to antenna system,light absorption,light transport,and electron transport in maize (Muet al.2017). It is well known that pathways for the production of reducing equivalents (the pentose phosphate pathway and glycolytic pathway) and genes involved in carbon (C) metabolism were affected by N supply. The balance between N and C metabolism is important for plant normal growth (Huppe and Turpin 1994). Introduction of theZmDof1gene into rice could increase C/N assimilation and thus enhance rice growth under low-N conditions (Kuraiet al.2011). N availability also regulated the secondary metabolism,protein synthesis,cytokinin translocation and signaling,auxin transport and signaling,and transcription regulation (Wanget al.2003). Using GWAS approach,a nitrate transporter OsNPF6.1 and a transcription factor OsNAC42 were identified,and NAC42-NPF6.1 signaling cascade conferred high NUE on rice (Tanget al.2019).Theindicanitrate reductase geneOsNR2allele improved the function of a nitrate transporter OsNRT1.1B and could increase rice NUE under N-sufficient conditions (Gaoet al.2019). Despite substantial progress on plant responses to N stress,a more detailed understanding of the response diversity in crop genotypes is needed.
Ranking the first in total production among major staple cereals,maize is not only an important raw material for biofuel and many other industrial products but also an important model system for genetic research (McLaren 2005;Neuffer and Sheridan 1980). Maize consumes about one-fifth of global N fertilizer,and maize yield is frequently threatened by low-N stress (FAO 2000;Maresmaet al.2016;Liet al.2021b). The genetic variations of maize are rich,which provides a good example to learn the molecular mechanism underlying the response to low-N stress in crop genotypes. This study evaluated 304 maize accessions for low-N tolerance under field conditions,and selected two lines,Ye478 (low-N sensitive) and Qi319 (low-N tolerant) that differ in their tolerance to low-N stress for further investigations. Based on the physiological indices tested,transcriptomic analysis of the leaves and roots of low-N tolerant and sensitive maize inbred lines was used to elucidate the potential molecular mechanisms underlying the responses to low-N stress in maize genotypes.
2.Materials and methods
2.1.Plant materials
In 2017 and 2018,304 maize accessions were evaluated for low-N tolerance in field experiments at Shunyi Agricultural Experimental Station of Institute of Crop Sciences,Chinese Academy of Agricultural Sciences. Among these accessions,one with low-N sensitivity (the inbred line Ye478) and one with low-N tolerance (the inbred line Qi319) were selected for further research;these two were selected because they were widely used in the breeding of hybrid maize in China (Penget al.2011;Zhanget al.2017).
Uniform seeds of the inbred lines Ye478 and Qi319 were surface sterilized in 3% NaClO for 20 min,and then germinated in moist filter paper tubes at 25°C until two leaves emerged. After removing the endosperms,the seedlings were then transferred to 3-L pots supplied with modified half-strength Hoagland’s nutrient solution for 2 days and then supplied with full-strength Hoagland’s nutrient solution containing 0.02 mmol L-1Ca(NO3)2(low-N) or 2 mmol L-1Ca(NO3)2(control). The basic nutrients in hydroponic solutions were described by Duet al.(2016). In the low-N solution,CaCl2was added to maintain the same concentration of calcium with normal conditions. The solution was changed every 2 days to ensure pH stability,and continuous aeration was provided during maize growth.The maize seedlings were grown in a growth room with 14 h light/10 h dark,28/22°C day/night temperature regime,and 300 μmol m-2s-1light intensity. Root and shoot samples were collected at indicated times after the initiation of low-N stress treatment and frozen in -80°C for further use.
2.2.RNA isolation,library construction and sequencing
Total RNA was extracted from the shoots and roots of maize seedlings subjected to low-N stress for 5 days with TransZol Up Reagent (TransGen Biotech,China). The contaminated genome DNA was removed by incubation with DNase I. A total of 3 μg of the purified RNAs were enriched with Oligo(dT) mRNA magnetic beads. The random hexamers were used for first-strand cDNA synthesis. After secondstrand cDNA synthesis,terminal paring and sequencing ligation,the fragments were purified and subsequently amplified by PCR. A total of 16 libraries (eight samples each in two biological replicates) were generated and sequenced with the Illumina HiSeq 2500 Platform (Berry Genomics,Beijing,China).
2.3.Transcriptome analysis
The raw reads were produced after excluding low quantity reads (Q≤30),adapter sequences and reads with more than 10% unknown bases. The clean reads were mapped to the maize reference genome version 4 (B73_RefGen_v4,ftp://ftp.ensemblgenomes.org/pub/plants/release-41/fasta/zea_mays/dna/) using HISAT2 v2.1.0 with default parameters (Kimet al.2015). The transcript abundance was determined by StringTie v1.3.3 with the aligned reads and represented as fragments per kilobase of transcript per million mapped reads (FPKM) (Perteaet al.2015). To identify the differentially expressed genes (DEGs),reads count of each transcript was calculated using HTSeq v0.8.0 (Anderset al.2015),and then performed with the R package“edgeR”(Robinsonet al.2010). Genes with log2(fold-change) ratio≥1 and false discovery rate (FDR)≤0.05 between two group samples were considered as DEGs. Gene Ontology (GO) enrichment were performed using AgriGO v2.0 (http://systemsbiology.cau.edu.cn/agriGOv2) with default parameters (Tianet al.2017). GO annotation results were visualized using WEGO (Web Gene Ontology Annotation Plotting) for the comparation of two cluster genes (Yeet al.2018).
2.4.Real-time RT-PCR
A total of 5 μg of purified total RNA was used for first-strand cDNA synthesis by SuperScriptTMIII reverse transcriptase (Invitrogen,USA). Quantitative real-time PCR was performed in an ABI 7500 system using the PowerUpTMSYBRTMGreen Master Mix (Applied Biosystems,USA).Three replications were carried out for each sample.ZmUBQ1was used as internal control,and the comparative Ctmethod was applied to determine the relative expression levels of selected genes. The primers designed for real-time RT-PCR are listed in Appendix A.
2.5.Determination of chlorophyll content and photosynthetic rate
The first and second bottom leaves were sampled for chlorophyll contents according to the procedure described by Cheirsilp and Torpee (2012). The pigments were extracted with 1:2 alcohol:acetone (v/v) solution for 24 h in the dark,and the optical densities OD663and OD645for each sample were determined. The chlorophyll content was calculated as:Chlorophyll content (mg g-1FW)=(20.21OD645+8.02OD663)×Extraction buffer volume (mL)/FW (g).
Photosynthetic rates of the second bottom leaf were measured using LI-6400XT Portable Photosynthesis System (LI-COR,USA) in the greenhouse. The middle part of leaves was used for measurement,and nine leaves were sampled for each treatment.
2.6.Measurement of root length
After a 5-day low-N treatment,the roots were floated in a transparent plastic tray and observed using the Epson Perfection V850 Pro Scanner (Nagano,Japan). The total root length was measured by WinRIZO Pro Software (Regent Instruments Inc.,Canada). The experiments were replicated for five times.
2.7.Measurement of plant weight and N content
Five independent plants were harvested and weighted for the shoot and root fresh biomass. To measure the N content,the samples were dried firstly at 105°C for 30 min,and then at 70°C for 3 days until the weight became constant. The dried samples were milled into a fine powder for N analysis. Nitrogen content was measured using performed Elemental Analyzer EA1108 (Carlo Erba Strumentazione,Milan,Italy).
3.Results
3.1.Different responses to low-N stress between the inbred lines Qi319 and Ye478
In field experiments,the inbred lines Qi319 and Ye478 showed different tolerance to low-N stress,i.e.,Qi319 was found to be low-N tolerant,and Ye478 was found to be low-N sensitive. To precisely determine the different responses to low-N stress between Qi319 and Ye478,they were cultivated in hydroponic solutions containing sufficient (4 mmol L-1) or limiting (0.04 mmol L-1) NO3--N. At the onset of treatment (low-N stress for 1 and 3 days,respectively),the relative shoot and root fresh weights (N-deficiencyvs.N-sufficiency) of both Qi319 and Ye478 were similar between N-sufficient and -deficient conditions (Fig.1-A). On the 5th day of low-N stress,the relative shoot fresh weight decreased by 52% for Ye478 and only by 17% for Qi319 (Fig.1-A). The difference between Qi319 and Ye478 was also observed for relative root fresh weight after 5 days of low-N stress (Fig.1-A).A phenotypic difference between Qi319 and Ye478 was evident at 5 days after low-N treatment,when the typical N-deficient phenotype with yellowing older leaves was observed in Ye478 but not in Qi319 (Fig.1-B). In agreement with the observation,the chlorophyll levels in older leaves of Qi319 after 5 days of low-N stress was~25% higher than those in Ye478 (Fig.1-C). The relative root/shoot weight ratios were much higher for Ye478 than for Qi319 after 3 and 5 days of low-N treatment,which indicated that a higher proportion of carbohydrate was allocated to the roots of the low-N sensitive inbred line Ye478 (Fig.1-D). Low-N stress led to a significantly decrease in N concentration in the shoots and roots of both Qi319 and Ye478 (Fig.1-E).However,the total N concentration in the shoots and roots of Qi319 was significantly higher than that of Ye478 under low-N conditions (Fig.1-E). These results suggested that the inbred line Qi319 is more tolerant to low-N stress than Ye478 under hydroponic conditions.
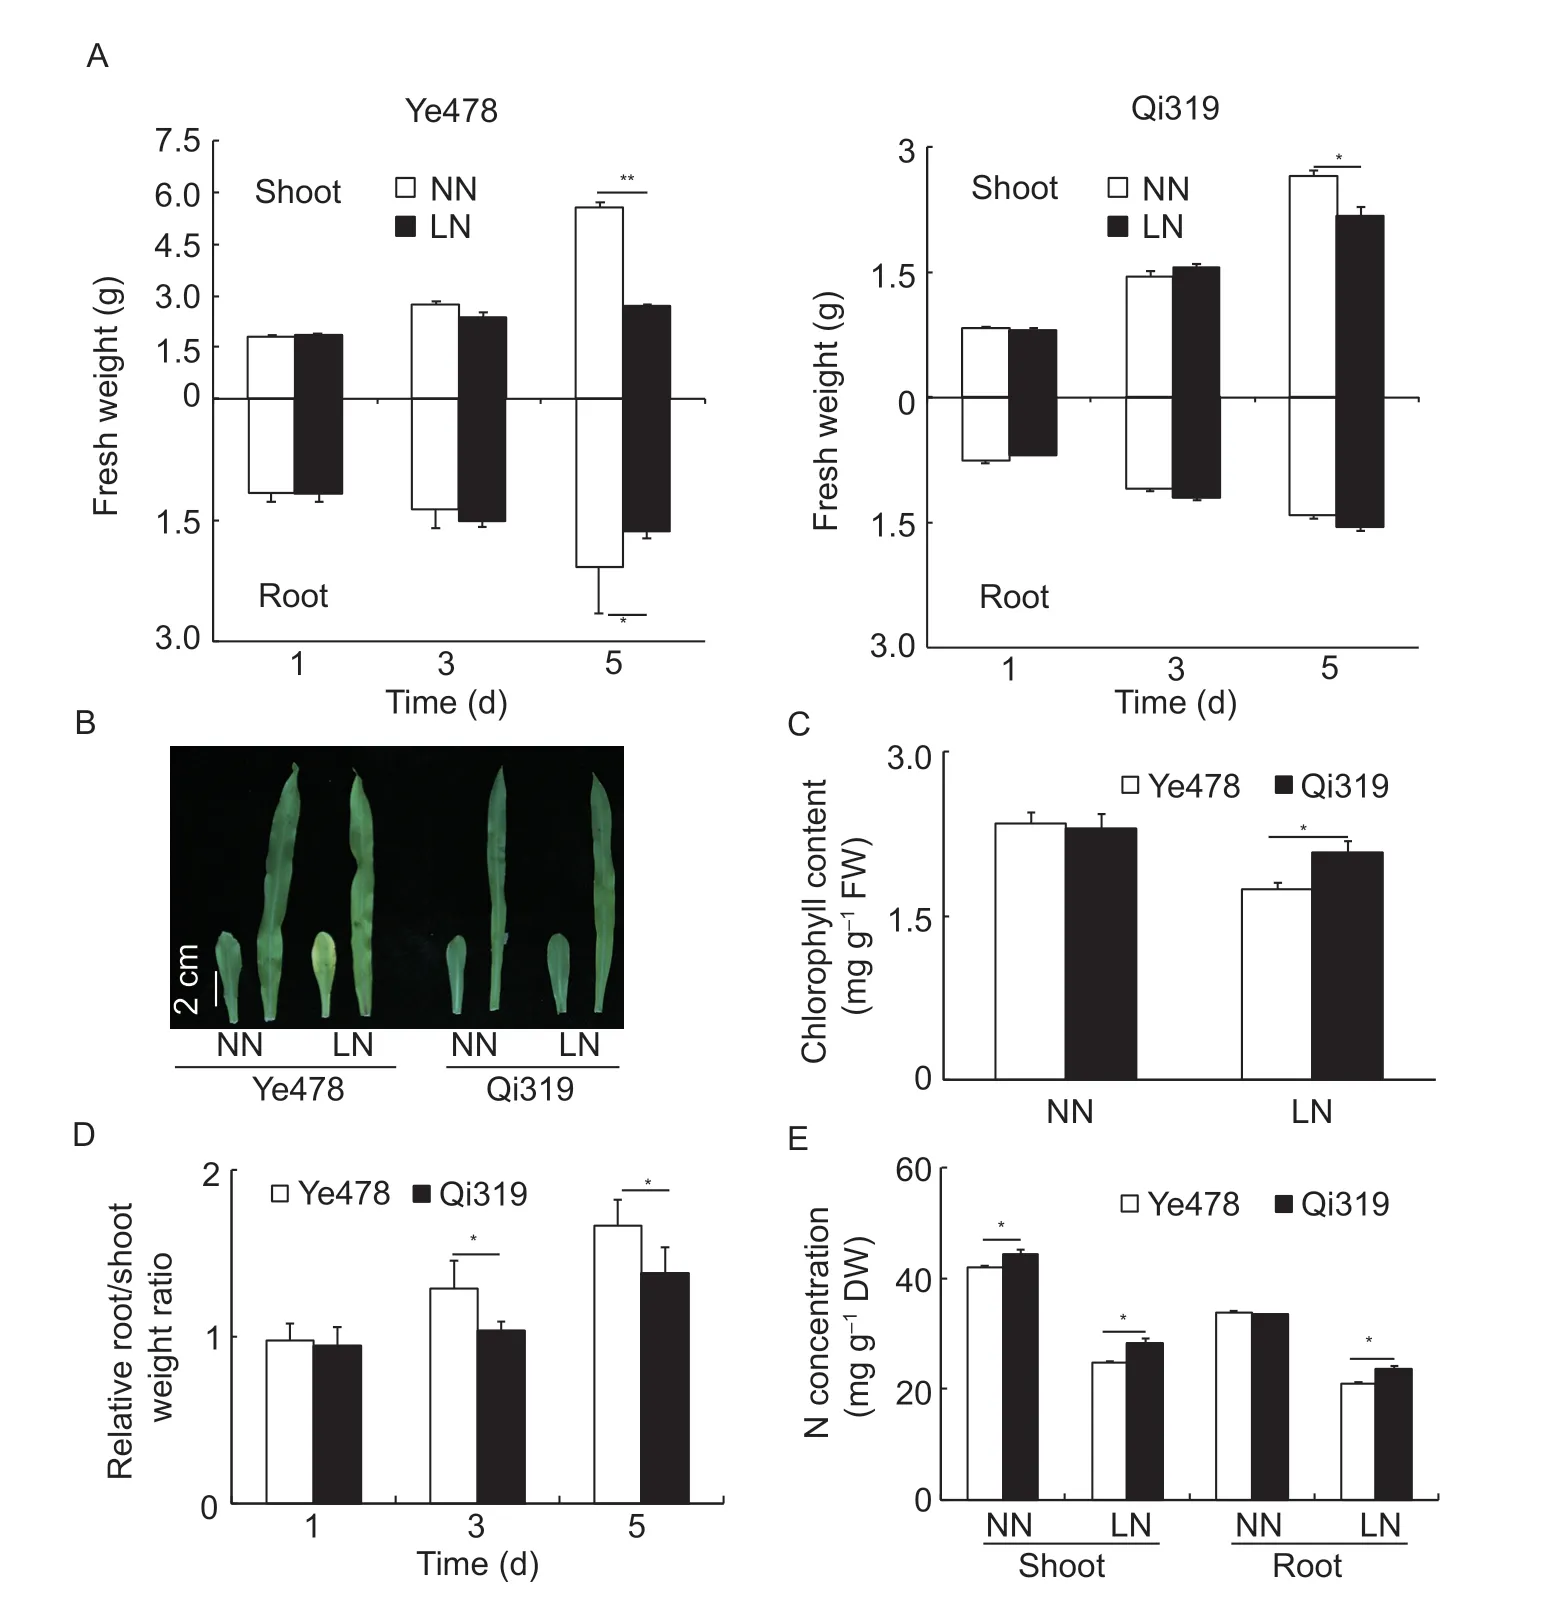
Fig.1 Different responses of the maize inbred lines Qi319 (tolerance) and Ye478 (sensitivity) to low-nitrogen (LN) stress. A,the shoot and root fresh weights of Qi319 and Ye478 with N stress as indicated durations. B,older leaves of Qi319 and Ye478 after 5 days of LN treatment. C,chlorophyll content of older leaves of Qi319 and Ye478 after 5 days of LN treatment. D,relative root/shoot weight ratios (LN vs.normal nitrogen (NN) of Qi319 and Ye478 with N stress as indicated durations. E,N concentrations in the shoot and root of Qi319 and Ye478 after 5 days of LN treatment. Error bars represent SE for five independent experiments. Asterisks indicate significant differences as determined by Student’s t-test (**,P<0.01;*,P<0.05).
3.2.Global transcriptome analysis of inbred lines Qi319 and Ye478
To identify molecular events or pathways involved in response to low-N stress,we generated a total of 16 RNA libraries from shoots and roots of both Qi319 and Ye478. The samples were obtained from hydroponically grown maize that had been provided with sufficient or low-N for 5 days,when the phenotypic difference between Qi319 and Ye478 was evident. All the samples were analyzed in two biological replicates. These RNA libraries yielded more than 0.38 billion raw reads,and 0.37 billion reads were left after removing adapters and low-quality reads.Of these,approximately 89% could be mapped to maize B73 v4 reference genome (ftp://ftp.ensemblgenomes.org/pub/plants/release-41/fasta/zea_mays/dna/) (Appendix B). Compared with Qi319,Ye478 had a much higher mapping rate to B73 reference genome either in shoot or in root,suggesting that the genome backgrounds of the low-N sensitive line Ye478 and the low-N tolerant line Qi319 are different.
To investigate the variability between each replicate,the Pearson’s correlation coefficient was calculated. Except for the libraries of Qi319 LN shoot,the Pearson’s correlations were in a range between 0.97 to 0.99 (Appendix C),which suggests a high quality standard for both biological replicates. Thus,the average FPKM value represented the gene expression level for each sample. Overall,36 243 genes were detected in at least one of the 16 samples,including 33 257 protein coding genes and 106 miRNAs (Fig.2-A). The proportions of genes expressed in high levels (FPKM≥10),medium levels (2≤FPKM<10) and low levels (FPKM<2) were similar among the samples (Fig.2-B). These results suggested that we obtained enough coverage of the shoot and root transcriptome of Ye478 and Qi319.
To eliminate the effects of transcriptional noise,only the genes with FPKM≥1 were analyzed further. A total of 25 923 genes including 1 489 transcriptional factors and 49 miRNAs were retained. Heatmap shows the amounts of genes that were differentially expressed among these samples (Fig.2-C). The expression profiles of selected genes determined by qRT-PCR were consistent with the sequencing data (Appendix D). The correlation coefficient between qRT-PCR and RNA-seq was 0.98 (Appendix D),indicating the reliability of our RNA-seq data.
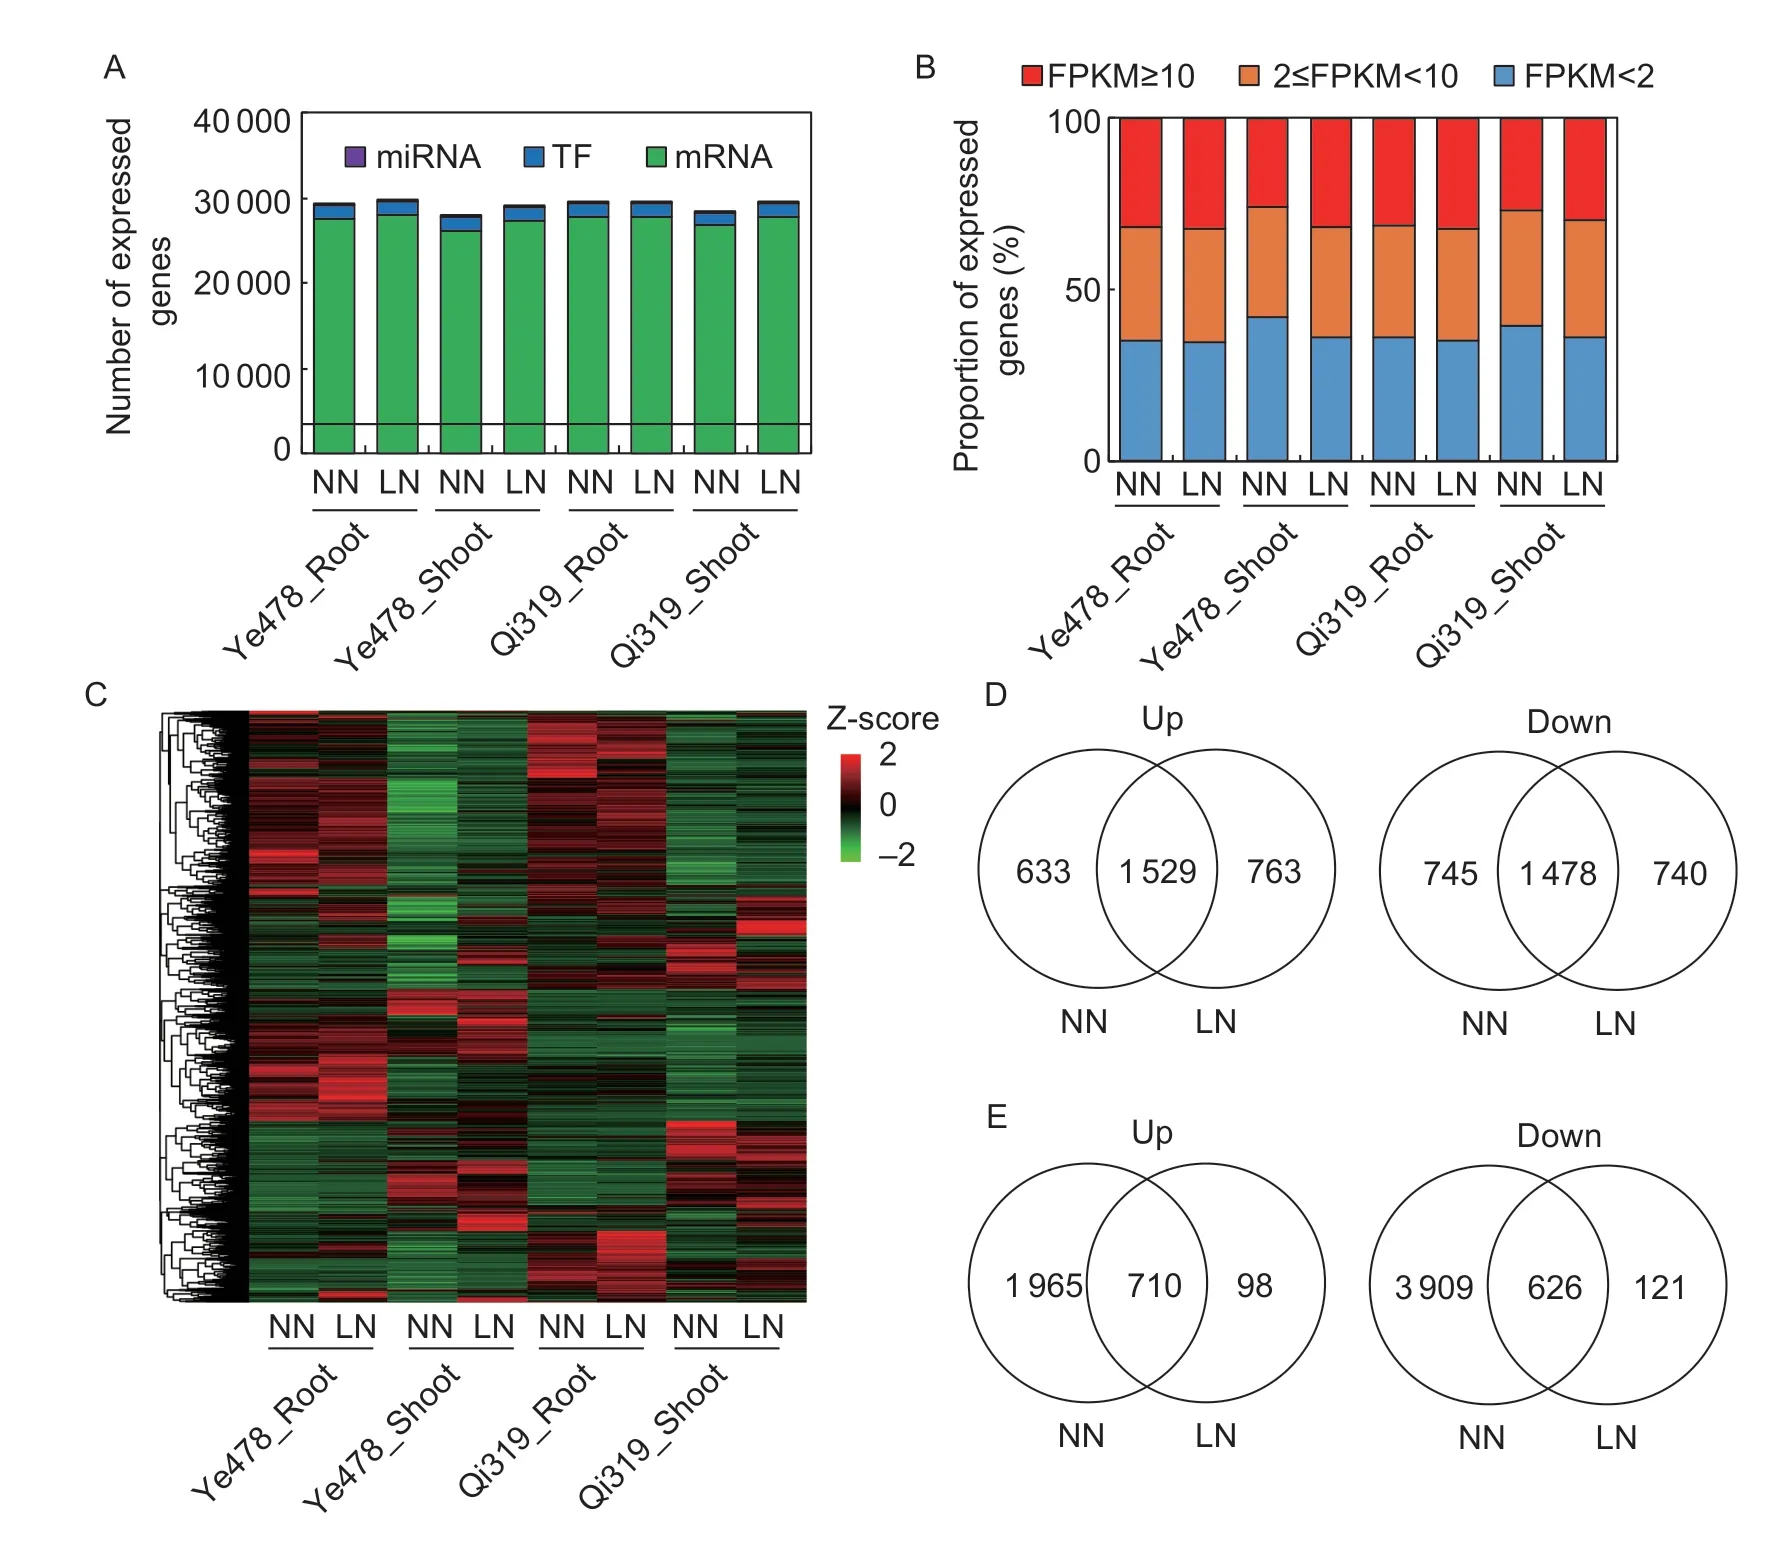
Fig.2 Global transcriptome analysis of the inbred lines Qi319 (low-N tolerance) and Ye478 (low-N sensitivity). A,numbers of miRNA genes,transcription factor (TF) genes,and non-TF protein coding (mRNA) genes expressed in each sample. B,proportions of expressed genes with high levels (FPKM≥10),middle levels (2≤FPKM<10),and low levels (FPKM<2) in each sample. C,heatmap showing the differentially expressed genes (FPKM≥1) among each sample. D and E,Venn diagram illustrating DEGs in the root (D) and shoot (E) between Ye478 vs.Qi319 under normal nitrogen (NN) or low nitrogen (LN) conditions.
We first analyzed the DEGs between Ye478 and Qi319 under N-deficient condition. The DEGs contained 4 510 genes in root and 1 555 genes in shoot (Fig.2-D). Among these genes,763/98 up-regulated and 740/121 downregulated genes in root/shoot were identified as special DEGs between Ye478 and Qi319 under N-deficient condition (Fig.2-D). GO analysis showed that the up-regulated genes in the root of Qi319 were related to tricarboxylic acid biosynthetic process (GO:0072351,P=6.0e-6,26.05-fold enrichment),nicotianamine biosynthetic process (GO:0030418,P=6.0e-6,26.05-fold enrichment),and oxidoreductase activity (GO:0016491,P=1.8e-5,1.72-fold enrichment) (Appendix E). The up-regulated genes in the shoot of Qi319 were mainly enriched in tubulin binding (GO:0015631,P=2.5e-9,12.37-fold enrichment) cytoskeletal protein binding (GO:0008092,P=1.0e-7,8.5-fold enrichment),mitotic cell cycle process (GO:1903047,P=1.1e-5,7.8-fold enrichment),and cell cycle (GO:0007049,P=1.1e-6,5.37-fold enrichment) (Appendix E).
3.3.Common responses to nitrogen stress between Qi319 and Ye478
After 5 days of low-N stress,a total of 426/361 up-regulated and 225/41 down-regulated genes in root/shoot were identified as N deficiency-responsive genes common to Qi319 and Ye478 (Fig.3-A and B). These N deficiencyresponsive genes common to Ye478 and Qi319 should be mainly originated from low-N stress,and not from genotypic difference. In root,the N deficiency up-regulated genes were enriched in secondary metabolic progress,including carotene metabolic process (GO:0016119,P=1.3e-7,21.68-fold enrichment),terpene metabolic process (GO:0042214,P=7.4e-7,16.1-fold enrichment),phytosteroid metabolic process (GO:0016128,P=3.0e-7,14-fold enrichment),and oxidation-reduction process (GO:0055114,P=3.5e-14,2.6-fold enrichment) (Fig.3-C).In contrast,the N deficiency down-regulated genes in root were involved in trehalose metabolic process (GO:0005991,P=5.2e-13,40.69-fold enrichment),disaccharide biosynthetic process (GO:0046351,P=3.4e-12,32.73-fold enrichment),oligosaccharide biosynthetic process (GO:0009312,P=1.1e-10,22.14-fold enrichment),and cellular carbohydrate biosynthetic process (GO:0034637,P=3.5e-5,5.16-fold enrichment) (Fig.3-C). In shoot,the N deficiency up-regulated genes were enriched in glutathione transferase activity (GO:0004364,P=3.0e-6,9.91-fold enrichment),organic acid transmembrane transporter activity (GO:0005342,P=1.3e-6,7.81-fold enrichment),N compound transport (GO:0071705,P=1.9e-7,4.34-fold enrichment),and oxidoreductase activity (GO:0016491,P=1.7e-9,2.47-fold enrichment) (Fig.3-D). The N deficiency down-regulated genes in shoot were enriched in substrate-specific transmembrane transporter activity (GO:0022891,P=2.1e-5,6.6-fold enrichment) and ion transmembrane transporter activity (GO:0015075,P=1.7e-3,5.7-fold enrichment) (Fig.3-D).
3.4.Identification of root N deficiency-responsive DEGs in Qi319 vs.Ye478
Due to the importance of root in plant nutrition,we identified N deficiency-responsive DEGs between the roots of Qi319vs.Ye478. A total of 2 293 genes were identified as DEGs in low-N sensitive Ye478vs.low-N tolerant Qi319 under N-deficient conditions (Fig.3-A;Appendix F). In Qi319,743 special N deficiency-responsive DEGs were identified,while 1 550 genes were identified as special N deficiencyresponsive DEGs in Ye478 (Fig.3-A). MapMan analysis showed that among the special N deficiency-responsive DEGs,the genes involved in ascorbate and glutathione pathway,which is important for maintaining structural integrity of biofilm system and preventing membrane lipid peroxidation (Noctor and Foyer 1998),were more abundant in Ye478 than in Qi319 (Appendix G). This further indicated that low-N stress has more deleterious effects on Ye478 than on Qi319.
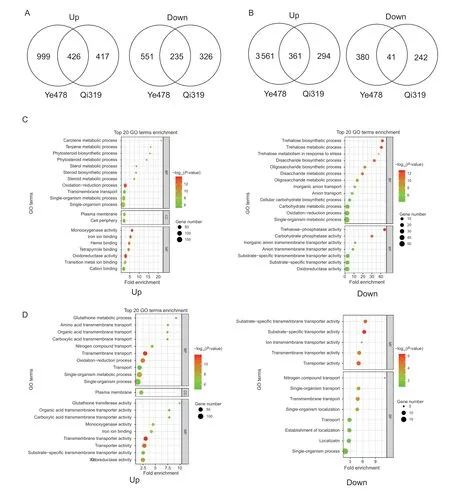
Fig.3 Overview of nitrogen (N) deficiency-responsive genes in the inbred lines Qi319 (low-N tolerance) and Ye478 (low-N sensitivity). A,Venn diagram illustrating N deficiency-responsive genes in the root of Qi319 and Ye478. B,Venn diagram illustrating N deficiency-responsive genes in the shoot of Qi319 and Ye478. C,Top 20 Gene Ontology (GO) classification of common N deficiency-responsive genes in the root between Qi319 and Ye478. D,Top 20 GO classification of common N deficiency-responsive genes in the shoot between Qi319 and Ye478. The point size represents the number of genes in the pathway;the point color represents -log10(P-value).
The hypothesis was further verified by GO analysis (Fig.4). The special N deficiency up-regulated genes in Ye478 were enriched for UDP-glycosyltransferase activity (GO:0008194,P=1.5e-7,2.82-fold enrichment),transmembrane transporter activity (GO:0022857,P=3.3e-7,2.04-fold enrichment),plasma membrane (GO:0005886,P=1.3e-12,2.03-fold enrichment),and intrinsic component of membrane (GO:0031224,P=4.2e-8,1.31-fold enrichment) (Fig.4),which was not detected in low-N tolerant Qi319. Interestingly,the special N deficiency up-regulated genes in Qi319 were enriched for nicotianamine metabolic process (GO:0030417,P=1.8e-8,50.61-fold enrichment),tricarboxylic acid metabolic process (GO:0072350,P=3.6e-6,16.87-fold enrichment),amine metabolic process (GO:0009308,P=2.1e-5,6.38-fold enrichment),and monooxygenase activity (GO:0004497,P=2.7e-5,3.47-fold enrichment) (Fig.4),suggesting that compared with low-N sensitive Ye478,low-N tolerant Qi319 could generate more energy and organ compounds to adapt to low-N stress.Interestingly,several glutamine synthetase genes includingZm00001d011610,Zm00001d026501,Zm00001d043845,andZm00001d048050were specifically down-regulated by low-N stress in Ye478,but not in Qi319 (Appendix F). This indicated the efficient N assimilation in the low-N tolerant line Qi319.
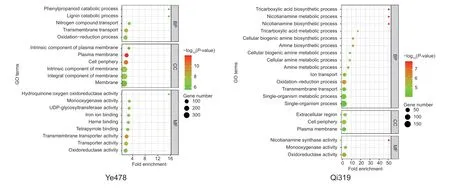
Fig.4 Nitrogen deficiency-responsive differentially expressed genes (DEGs) between the roots of Qi319 (low-N tolerance) vs.Ye478 (low-N sensitivity). Top 20 Gene Ontology (GO) classification of special-N-deficiency up-regulated genes in Qi319 and Ye478. The point size represents the number of genes in the pathway;the point color means -log10(P-value).
3.5.Identification of shoot N deficiency-responsive DEGs in Qi319 vs.Ye478
The special N deficiency-responsive DEGs in Ye478 shoot were consisted of 3 941 genes,which was~7 times as many as that of Qi319 (Fig.3-B;Appendix F). A lot of biological pathways were different between Ye478 and Qi319 after 5 days of low-N stress. MapMan analysis shows differences in plenty of pathways including light reactions,lipids,fermentation,tetrapyrrole,mitochondrial electron transport,ascorbate,glutathione,and secondary metabolism pathways between Ye478 and Qi319 (Fig.5-A).Zm00001d034543andZm00001d049650encoded the photosystem I reaction center subunit II-1 chloroplast and photosystem II core complex protein psbY,respectively.The expression levels of the two genes were repressed by low-N stress (Fig.5-B). In agree with MapMan analysis,the reduction was more obvious in Ye478 than in Qi319 (Fig.5-B).
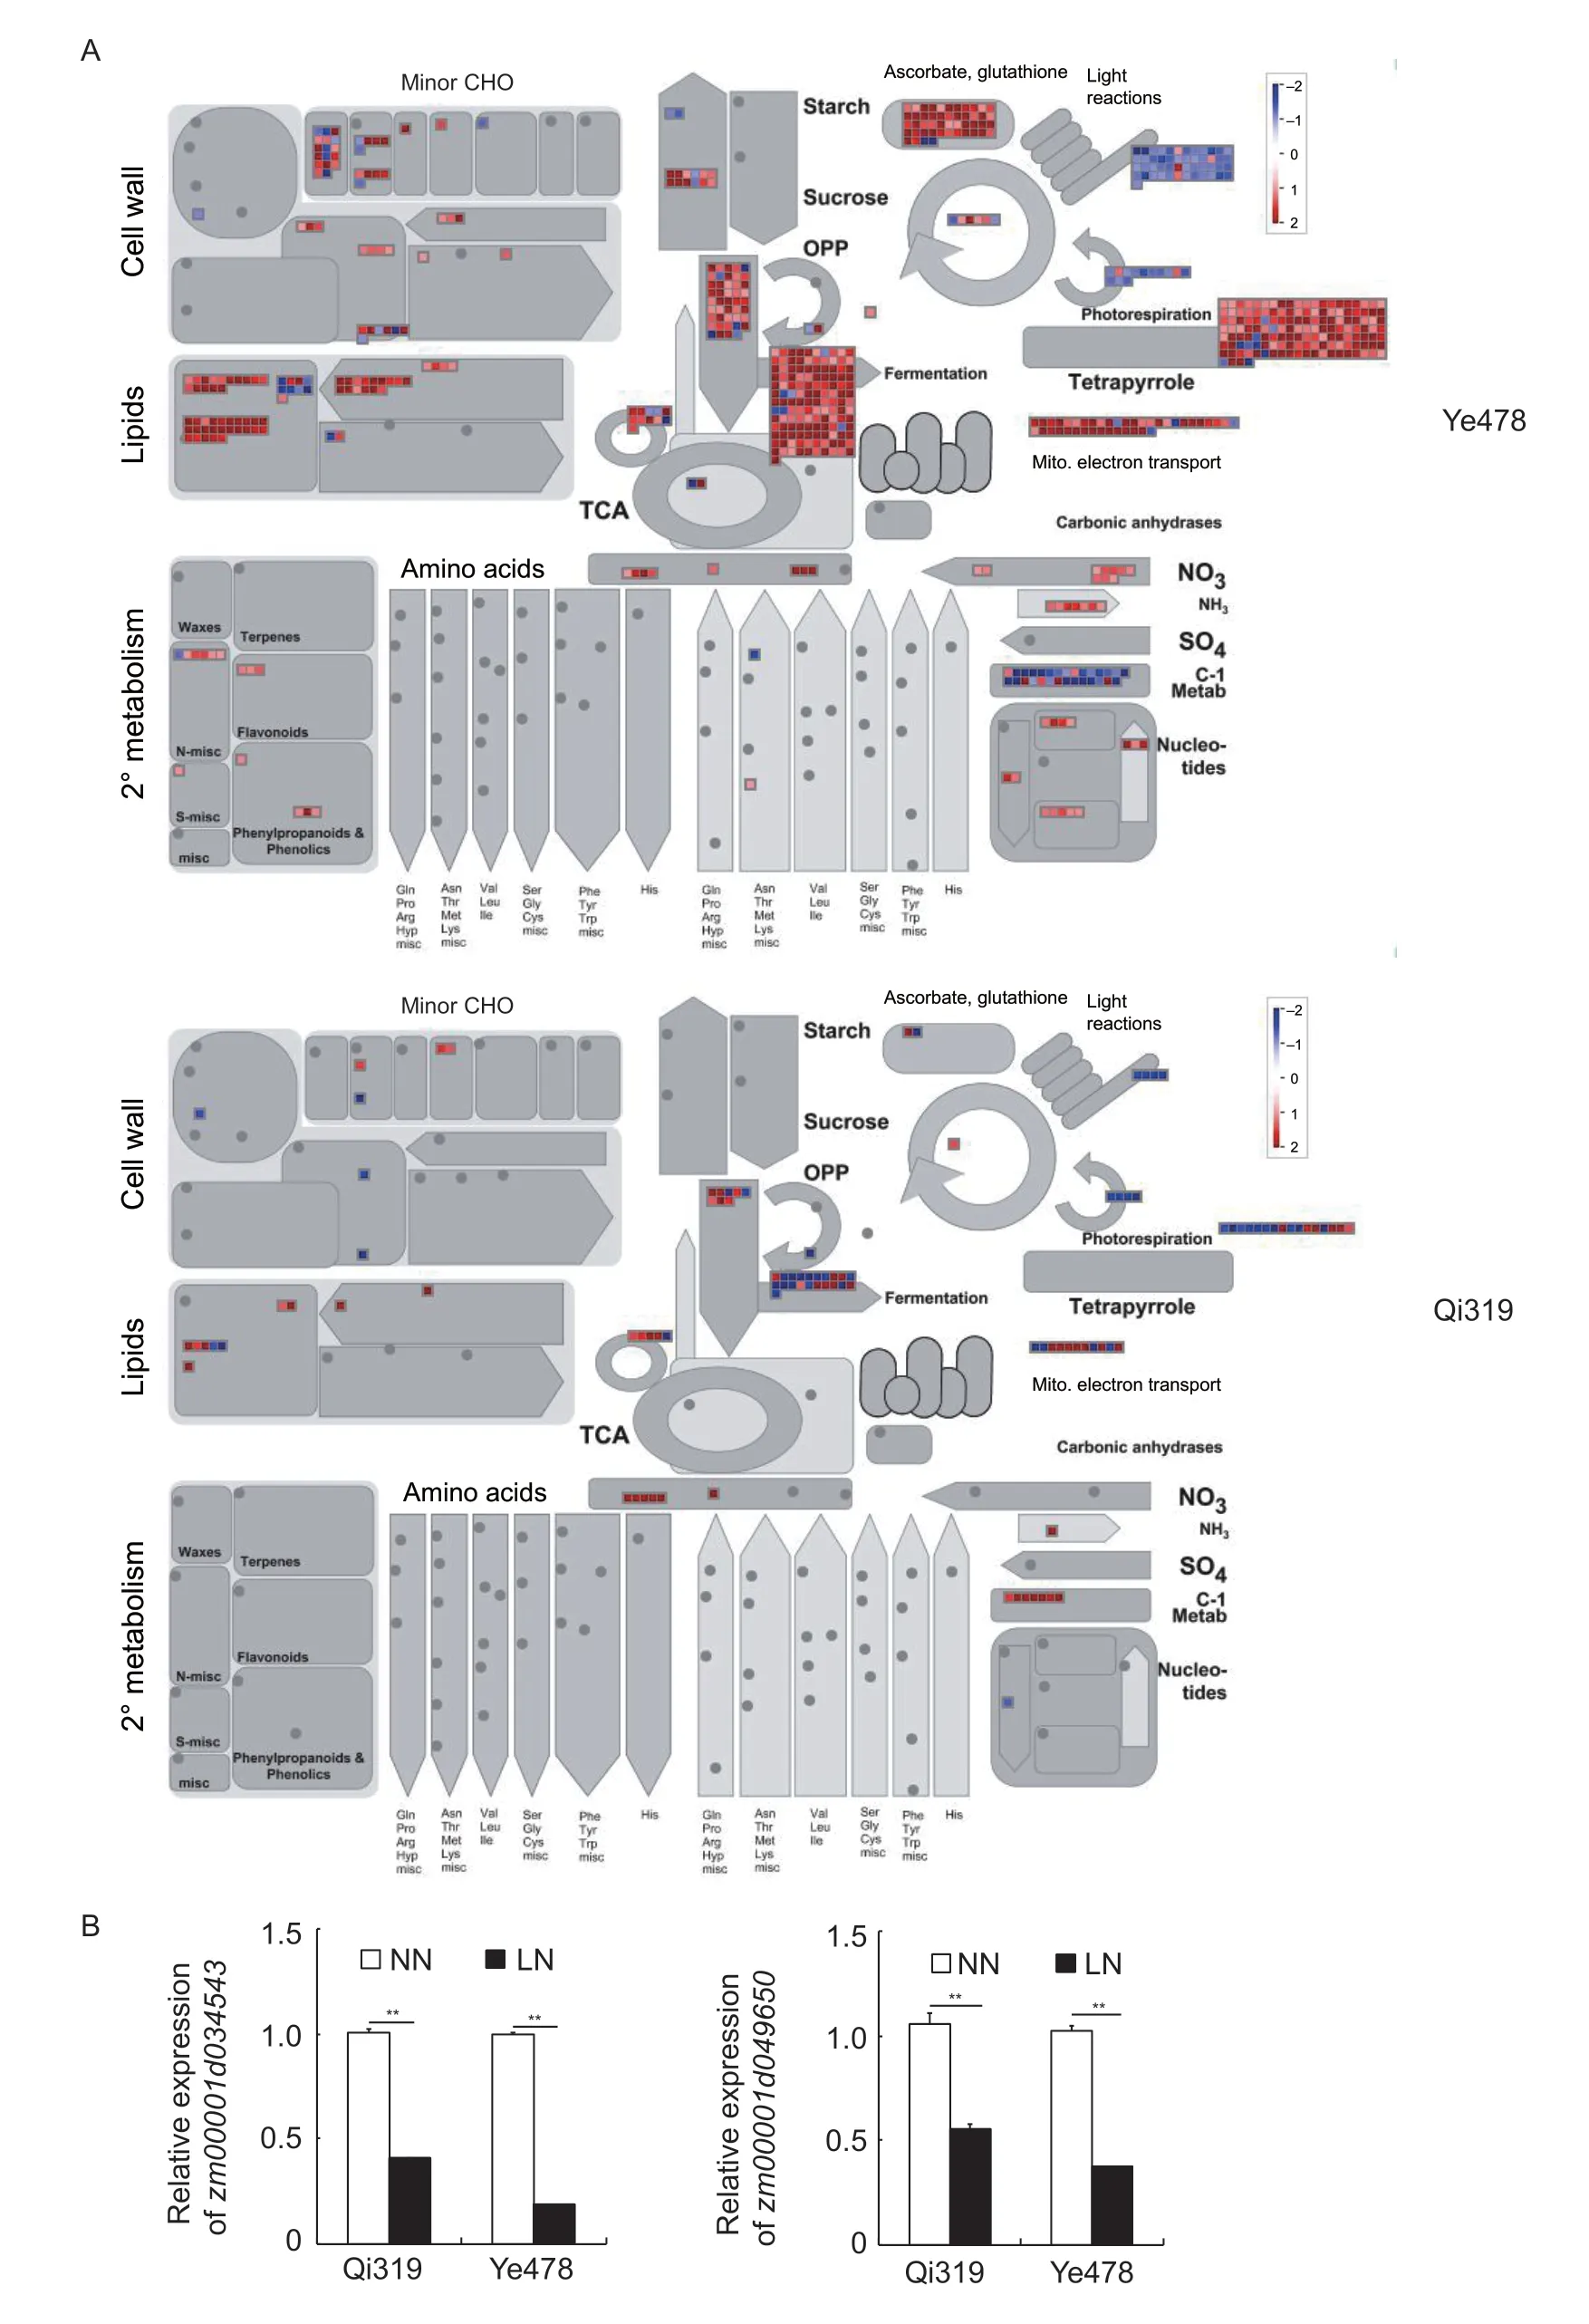
Fig.5 Nitrogen (N) deficiency-responsive differentially expressed genes (DEGs) between the shoots of Qi319 (low-N tolerance) vs.Ye478 (low-N sensitivity). A,the different N deficiency-responsive metabolic pathways between the roots of Qi319 and Ye478 determined by MapMan analysis. B,the effects of N availability on the zm00001d034543 and zm00001d049650 abundance in Qi319 and Ye478. Data are presented as mean±SE (n=3). Asterisks indicated significant difference between low N (LN) and normal N (NN) treatments as determined by Student’s t-test (**,P<0.01).
The special N deficiency up-regulated genes in Qi319 were enriched for terpene synthase activity (GO:0010333,P=1.2e-8,21.46-fold enrichment),microtubule cytoskeleton (GO:0015630,P=4.0e-6,5.41-fold enrichment),mitotic cell cycle process (GO:1903047,P=12.0e-5,4.84-fold enrichment),regulation of cell cycle (GO:0051726,P=2.7e-5,4.44-fold enrichment),response to external stimulus (GO:0009605,P=2.6e-5,4.13-fold enrichment),and cell cycle process (GO:0022402,P=9.0e-6,3.78-fold enrichment) (Appendix H). The special N deficiency downregulated genes in Qi319 were enriched for phenylpropanoid metabolic process (GO:0009698,P=8.6e-7,56.75-fold enrichment),secondary metabolic process (GO:0019748,P=7.0e-6,13.90-fold enrichment),apoplast (GO:0048046,P=4.1e-6,10.47-fold enrichment),fatty acid metabolic process (GO:0006631,P=9.2e-6,6.95-fold enrichment),and lignin catabolic process (GO:0046274,P=1.1e-6,3.78-fold enrichment) (Appendix H). GO analysis showed that all the special N deficiency-responsive DEGs related to photosystem (GO:0009521,P=1.6e-20,18.83-fold enrichment),photosynthetic membrane (GO:0034357,P=8.5e-31,11.68-fold enrichment),thylakoid (GO:0009579,P=1.2e-37,6.95-fold enrichment),chloroplast stroma (GO:0009570,P=1.5e-13,6.82-fold enrichment),and chloroplast (GO:0009507,P=1.1e-32,5.1-fold enrichment) pathways were repressed by low-N stress in Ye478 (Appendix H),which was consistent with the reduced chlorophyll levels in the older leaves of Ye478 after 5 days of low-N stress (Fig.1-C). The leaf net photosynthetic rate was also significantly decreased in Ye478 after 5 days of low-N stress,but the change was not found in Qi319 (Appendix H). And the net photosynthetic rate in Qi319 was significantly higher than that in Ye478 under low-N conditions (Appendix H). These results suggested that the integrity of photosynthesis system in low-N tolerant Qi319 would contribute to its adaption to low-N stress.
3.6.Roles of transcription factors in different N deficiency-responses between Qi319 and Ye478
Regulation of gene expression at the transcriptional level is important for N deficiency-responses in plants. The transcription factorsANR1,GNC,DOF1,andCCA1were reported to be involved in N-stress responsive pathway inArabidopsis(Zhang and Forde1998;Kuraiet al.2004;Biet al.2005;Gutiérrezet al.2008). In the present research,a total of 514 transcription factors,includingAP2s,bZIPs,Dofs,andLBDs,were identified as N deficiency-responsive transcription factors (Appendix I). To identify the special N deficiency-responsive transcription factors between Qi319 and Ye478,we filtered the factors in each inbred line. The special N deficiency-responsive transcription factors between Qi319 and Ye478 were defined if relative fold change ≥2 in Qi319vs.Ye478. Under low-N stress,87 transcription factors in root and 142 transcription factors in shoot expressed differentially between Qi319 and Ye478 (Appendix I). The transcription factors belonged to 30 families. NIN-like protein ZmNLP5 attracted our attention because it played important roles in N-deficient responses in maize,and knocked out ofZmNLP5reduced N content (Geet al.2019). The expression levels ofZmNLP5were much higher in low-N tolerant Qi319 than in low-N sensitive Ye478 (Appendix I),which was consistent with the increasing N content in low-N tolerant lines.
3.7.Roles of miRNAs in different N deficiencyresponses between Qi319 and Ye478
Previous studies have revealed that miRNAs regulate maize adaptive responses to N stress (Zhaoet al.2012;Sunet al.2018). To identify the special N deficiencyresponsive miRNAs between Qi319 and Ye478,we filtered the N deficiency-responsive miRNAs in each inbred line. The special N deficiency-responsive miRNAs between Qi319 and Ye478 were defined if relative fold change ≥2 in Qi319vs.Ye478. A total of 15 miRNAs belonging to 10 families in root and 11 miRNAs belonging to six families in shoot were identified as special N deficiency-responsive miRNAs (Fig.6-A and B). InArabidopsis,oxidative stress suppressed miRNA398 expression (Sunkaret al.2006).The expression level of miRNA398 was lower in Ye478 shoot than in Qi319 shoot,indicating that the oxidative stress originated from low-N is more serious in Ye478 than in Qi319. Overexpression of miRNA160 produced more lateral roots than WTArabidopsis(Lianget al.2012). The N-induced miRNA160 could be only observed in Qi319 root,which was in agree with higher relative root length in Qi319 than in Ye478 under low-N stress (Fig.6-C).
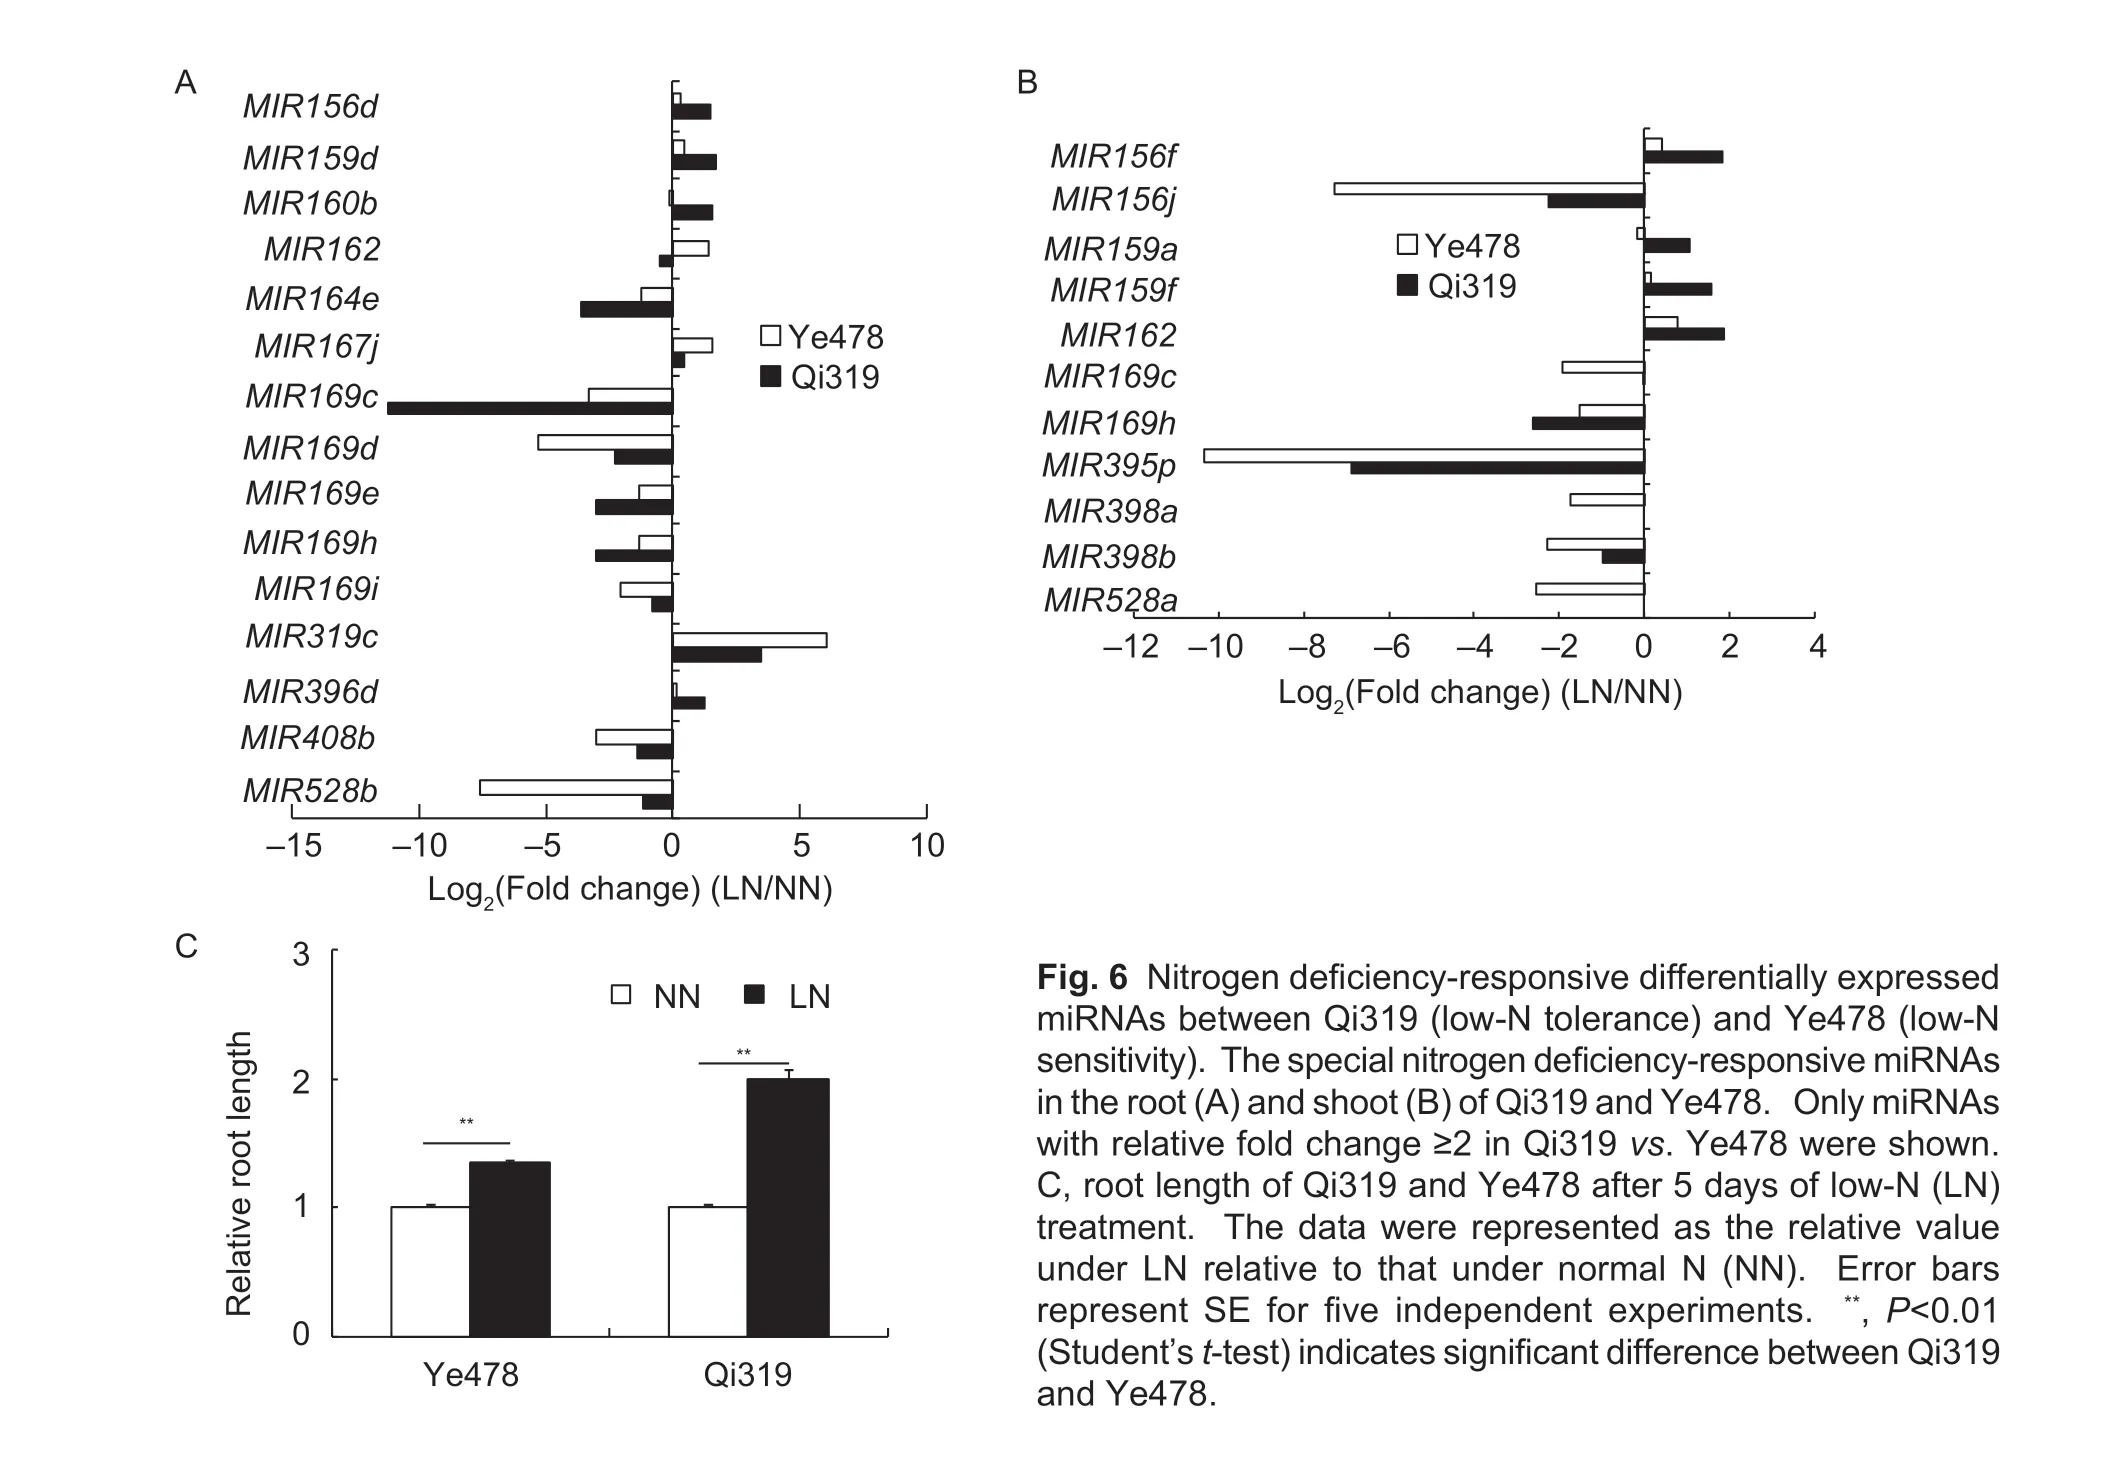
Fig.6 Nitrogen deficiency-responsive differentially expressed miRNAs between Qi319 (low-N tolerance) and Ye478 (low-N sensitivity). The special nitrogen deficiency-responsive miRNAs in the root (A) and shoot (B) of Qi319 and Ye478. Only miRNAs with relative fold change ≥2 in Qi319 vs.Ye478 were shown. C,root length of Qi319 and Ye478 after 5 days of low-N (LN) treatment. The data were represented as the relative value under LN relative to that under normal N (NN). Error bars represent SE for five independent experiments. **,P<0.01 (Student’s t-test) indicates significant difference between Qi319 and Ye478.
4.Discussion
The elite line Ye478 is one of the fundamental parents for hybrid maize in China,which is characterised with high combining ability,relative low plant height and lodgingresistance. However,the inbred line Ye478 is sensitive to abiotic and biotic stresses,such as drought,high temperature,ear rot disease,and stem rot disease. In contrast,the inbred line Qi319 was confirmed to be resistant to several foliar diseases (Wanget al.2014),indicating that improved line of disease-resistant Ye478 could be obtained through hybridization with Qi319. In the present research,we showed that Qi319 was more tolerant to low-N stress than Ye478 in both field and hydroponic solutions. These results suggested that Qi319 could be a germplasm resource to improve both abiotic and biotic stress-resistance of Ye478.
Some microarray and RNA-seq analysis have revealed that low-N stress affects a wide range of biological processes in plants. However,the molecular responses of crop responses to low-N stress are still poorly understood,especially for crop genotypes. In maize,low N repressed the expression levels of genes related to photosystem I and photosystem II,and thus,leaf chlorophyll content,actual quantum yield of PSII photochemistry,photochemical quenching,and electron transport rate were decreased (Muet al.2017). This phenomenon was also observed in low-N sensitive Ye478:(1) The yellowing older leaves were observed in Ye478 but not in Qi319 after 5 days of low-N treatment;(2) all DEGs down-regulated by special N deficiency were enriched in thylakoid,chloroplast,photosynthetic membrane,photosystem enrichment,and chloroplast stroma pathways in Ye478;(3) the low-N-mediated repression ofZm00001d034543andZm00001d049650was more obvious in Ye478 than in Qi319;(4) the net photosynthetic rate was significantly decreased in Ye478 after 5 days of low-N stress,but not in Qi319. In contrast,the down-regulated genes by special N deficiency in Qi319 were enriched for phenylpropanoid metabolic process,secondary metabolic process and fatty acid metabolic process. These results highlighted the importance of photosynthesis in low-N tolerance of maize and the related genes could be the indicators for evaluating maize germplasm for low-N tolerance.
Under N deficient conditions,the N concentrations in both shoot and root of Qi319 were higher than those of Ye478. This could be due to the increased nitrate uptake capacity or an improved root system in Qi319 under low-N stress. To test the two hypotheses,we first checked theNRT(nitrate transporter) mRNA abundance. InArabidopsis,AtNRT1.1,AtNRT2.1andAtNRT2.2were the main players for nitrate uptake (Kraiseret al.2011). By alignment,the homologous ofAtNRT1.1,AtNRT2.1andAtNRT2.2was identified in maize (Zm00001d027285,Zm00001d029932,Zm00001d054057,andZm00001d054060) and their expression levels were similar between Qi319 and Ye478 under low-N stress. These results suggested that the nitrate uptake capacity was not the main contributor to different tolerance to low-N stress between Qi319 and Ye478.However,the expression of glutamine synthetase genes (Zm00001d011610,Zm00001d026501,Zm00001d043845,andZm00001d048050) were significantly down-regulated by low-N stress in Ye478,but not in Qi319,which indicated the efficient N assimilation in Qi319. Low-N treatment significantly reduced the root weight of Ye478 but did not affect that of Qi319,indicating that root weight of Qi319 was not sensitive to low-N stress. This could be at least partly depend on miRNA160. InArabidopsis,overexpression of miRNA160a produced more lateral roots than WT plants (Lianget al.2012). Thus,the improved root system in Qi319 should be another main factor for the different tolerance to low-N stress between Qi319 and Ye478.
Several transcription factors have been demonstrated to be involved in an N stress-responsive pathway inArabidopsis(Zhang and Forde 1998;Kuraiet al.2004;Biet al.2005;Gutiérrezet al.2008). However,the transcriptional regulation of N stress-responsive pathway remains to be understood. Overexpression ofzmm28(MADS-box transcription factor) under the control of a moderate-constitutive promoter increased the photosynthesis capacity and N utilization (Wuet al.2019);NIN-like protein ZmNLP5 directly regulated the expression of nitrite reductase 1.1 by binding to the nitrate-responsivecis-element,and a natural loss-of-function allele ofZmNLP5conferred less N accumulation in Mo17 (Geet al.2019). RNA-seq data was analyzed and it was found thatzmm28was filtered out due to its low presence in maize seedlings. When the original RNA-seq data was examined,it was found that the expression levels of bothZmm28andZmNLP5were significantly higher in low-N tolerant Qi319 than in low-N sensitive Ye478,indicating that the transcriptional regulation of N stress-responsive pathway was also important for the different tolerance to low-N stress between Qi319 and Ye478.
5.Conclusion
Compared with low-N sensitive Ye478,the root weight of Qi319 was insensitive to low-N stress. Transcriptome analysis revealed that the DEGs in the root of Qi319 upregulated by special N deficiency were mainly enriched in metabolic energy related pathway. At 5 days after low-N treatment,the yellowing older leaves were observed in Ye478 but not in Qi319. The special N deficiency-responsive DEGs related to thylakoid,chloroplast,photosynthetic membrane,and chloroplast stroma pathways were repressed by low-N stress in Ye478. Furthermore,the net photosynthetic rate was significantly decreased in Ye478 after 5 days of low-N stress. Thus,the improved root system and integrity of photosynthesis apparatus in Qi319 should be the main factors for the different tolerance to low-N stress between Qi319 and Ye478.
Acknowledgements
This work was supported by grants from the Ministry of Agriculture of China for Transgenic Research (2018ZX0800916B),the National Natural Science Foundation of China (31861143004) and the Agricultural Science and Technology Innovation Program of Chinese Academy of Agricultural Sciences.
Declaration of competing interest
The authors declare that they have no conflict of interest.
Appendicesassociated with this paper are available on http://www.ChinaAgriSci.com/V2/En/appendix.htm
杂志排行
Journal of Integrative Agriculture的其它文章
- Effects of plant density and nitrogen rate on cotton yield and nitrogen use in cotton stubble retaining fields
- Adoption of small-scale irrigation technologies and its impact on land productivity:Evidence from Rwanda
- Lignin metabolism regulates lodging resistance of maize hybrids under varying planting density
- Natural nematicidal active compounds:Recent research progress and outlook
- lmproving grain appearance of erect-panicle japonica rice cultivars by introgression of the null gs9 allele
- ldentifcation of blast-resistance loci through genome-wide association analysis in foxtail millet (Setaria italica (L.) Beauv.)
