Pore characterization of PM Mg-0.6Ca alloy and its degradation behavior under physiological conditions
2021-05-21EshwrPhniShuhkrNiddvoluDinKrgerBeritZellerPlumhoffDomonkosTolniBjrnWieseFrnkFeyerendThomsEelRegineWillumeitmer
Eshwr Phni Shuhkr Niddvolu, Din Krüger, Berit Zeller-Plumhoff,Domonkos Tolni, Björn Wiese, Frnk Feyerend, Thoms Eel, Regine Willumeit-Römer
a Division Metallic Biomaterials, Institute of Materials Research, Helmholtz-Zentrum Geesthacht, Max-Planck-Str. 1, Geesthacht 21502, Germany
b Magnesium Innovation Center (MagIC), Institute of Materials Research, Helmholtz-Zentrum Geesthacht, Max-Planck-Str. 1, Geesthacht 21502, Germany
Received 13 March 2020; received in revised form 12 May 2020; accepted 17 May 2020
Available online 24 June 2020
Abstract
Keywords: Porous Mg-0.6Ca; In vitro; Degradation; μCT; Sintering.
1. Introduction
Mg combines the aspects of minimized stress shielding effect with self-degrading capability making them potential candidates for load bearing biomedical implant applications[1-3].Micro alloying proves to be beneficia in improving the degradation resistance in Mg alloy in combination with decent mechanical properties[4-6].It is also reported that certain Mg degradation products exhibit positive effects on the environment surrounding the implant [7]. Good biocompatibility and better mechanical properties compared to degradable polymers increased research interest on porous Mg materials for their suitability as scaffold materials [8,9].
For suitability as a scaffold material, open porous structures with pore permeability are required.Many existing techniques produce porous Mg materials with both open and close pore structures. The production techniques include liquid-gas infiltration crucible melt extraction [10], metal-gas eutectic unidirectional solidificatio method (GASAR) [11], negative salt pattern molding [9], pressure induced foaming [12],powder metallurgy [13-15], and indirect solid free form fabrication [16,17]. Available literature on porous pure Mg or Mg alloys mainly focusses on degradation behavior with emphasis on microstructure and mechanical properties in relation to scaffold material applications [8-10,15,18,19].Studies showed successful results in fabricating materials with various porosities and pore sizes [14,18,20,21]. In these studies, porosities greater than 35% with a large surface connected porosity were generated since pore interconnections facilitate uniform cell seeding and transport of metabolites[8,18,22]. It is also reported that even in porous Mg materials with >50% porosities, compressive strengths comparable to human cancellous bone can be achieved [9,18,22,23]. Of all these techniques, powder metallurgy processing is considered to have an advantage of ease in controlling the pore size by selecting suitable sizes of the space holder material and thereby altering the mechanical properties of the produced parts. Suggested space holder materials are urea, carbamide,ammonium bicarbonate, camphene, naphthalene and PMMA,which decompose at intermediate temperatures prior to actual sintering [22-24]. All aforementioned studies indicated that an increase in porosity resulted in decrease of degradation resistance in such materials.
However, limited studies exist on fabricating Mg materials with both open and closed pore structures with their simultaneous effect on degradation resistance. Dutta et al. [20] have produced Mg scaffolds with bulk porosities ranging from 8%till 40%by varying naphthalene space holder content.Though the surface open and closed pore structures were only visually shown, they reported high pore interconnectivity for Mg specimens with 40% bulk porosity and therefore weak degradation resistance in these specimens. In another study [13], at 38vol% porosity, high pore interconnectivities are confirme in the specimen cross sections as visualized by the formed degradation products at the internal part of the specimens during immersion in NaCl. However, the nature of porosity was not detailed in this work. In view of developing porous Mg for implant applications, it is important to realize a threshold porosity where both degradation resistance and mechanical properties compromise. This broadens the applicability of porous Mg materials in both load bearing and scaffold related applications with tailored degradation rates through varied porosities.
Achieving high densities by sintering using air atomized Mg powders is often challenging because of the oxide layer that develops on powder particle surfaces right after atomization techniques. This is, however, desired as the oxide layer behaves as an insulator and prevents burning of pure Mg fine during handling [25]. It is reported that despite the presence of this oxide layer,high densities in the fina sintered parts are achievable by sintering under high purity Ar atmosphere at elevated sintering temperatures [26,27]. As powder metallurgy technique offers the possibility for the near net shape production of sintered parts, several binder components are explored for their suitability in Metal Injection Molding (MIM) of Mg alloys.The mechanical properties of such MIM Mg specimens with low residual porosities are reported to be comparable to that of as cast counterparts making them suitable for both structural and biomedical applications [26,28].
Alloying additions play a critical role in altering the degradation kinetics of Mg alloys.Ca is regarded as one of the most promising alloying element due to its cell signaling function,biocompatibility and its presence in human bone [29]. With respect to degradation resistance, low concentrations of Ca in Mg are favored [3,6,29-32]. Limiting Ca concentration to 0.6-0.8wt%for improved degradation resistance and adequate mechanical properties in Mg alloys were proposed[27,30,33].In addition, the low enthalpy of formation of CaO compared to MgO during liquid phase sintering can improve densifi cation in Mg-Ca alloy systems. This enthalpy descent depending on the local concentration of Ca in the Mg-Ca-O system is shown in experiments [34] and in thermodynamic calculations [35].
This work aims at providing details of how the internal pore structure developed via Ar sintering of Mg-0.6Ca specimens affects their degradation characteristics. The discussions for the observed degradation are based on material’s pore parameters like pore sizes, nature of porosity, pore interconnectivity and pore curvatures which are assessed by micro computed tomography (μCT) analysis. Alloy degradation was assessed via a semi static immersion test for 16 days under physiological conditions. Significan factors affecting material degradation based on different specimen porosities were discussed and a threshold porosity for a reproducible degradation behavior and acceptable mechanical strengths was proposed for these class of porous specimens. Since presence of impurities is detrimental to degradation, the starting powders and the sintered specimens were subjected to chemical analysis prior to immersion testing. The notable feature of the present work lies in production of porous Mg-0.6Ca specimens possessing both open and closed pore structures without the use of space holder particles or gas interventions.
2. Materials and methods
2.1. Starting powders and Mg–0.6Ca powder mix preparation
Powders produced by gas atomization technique were used as starting materials as shown in Fig. 1A and B for pure Mg and master alloy powders, respectively. In the present work,pure Mg powder was added with Mg-10Ca master alloy powder following the rule of mixtures to produce Mg-0.6Ca powder mix. Distilled cyclohexane was added to this powder mix to ensure thorough mixing and later dried under Ar atmosphere. Table 1 summarizes chemical composition of the raw powders used in the study.
2.2. Specimen compaction and sintering
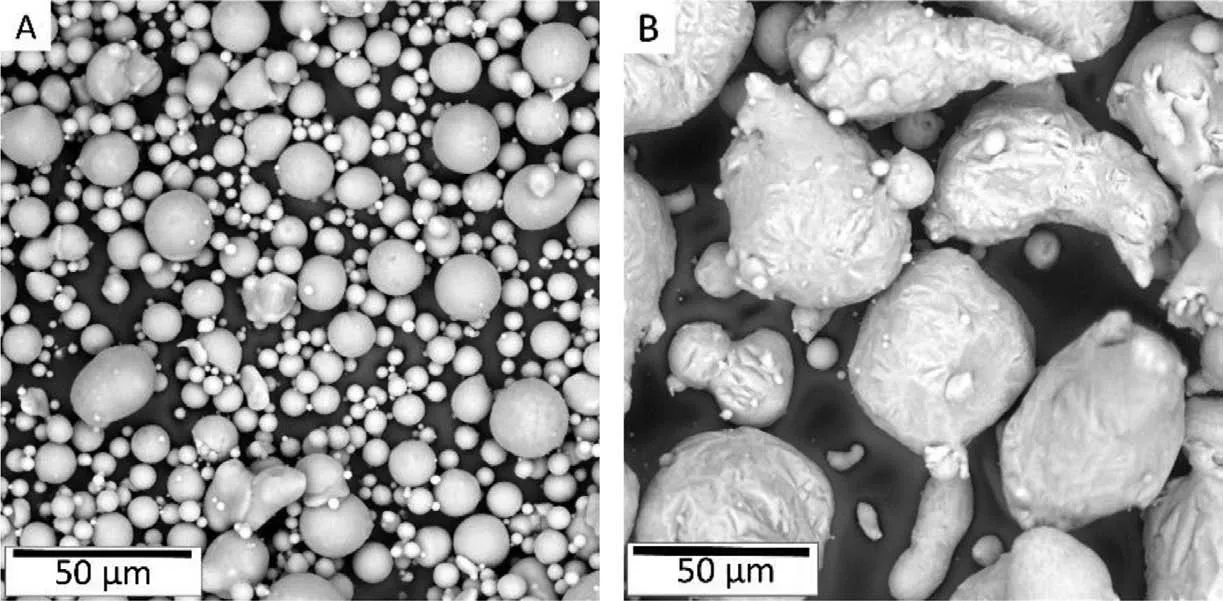
Fig. 1. Raw powders used in the study. A) Air atomized pure Mg particles of near spherical morphologies B) Mg-10Ca master alloy powder with spherical to ellipsoid morphologies. Both powders exhibit smaller satellite particles attached to their surfaces. Occasionally, fin particle clusters are also observed.
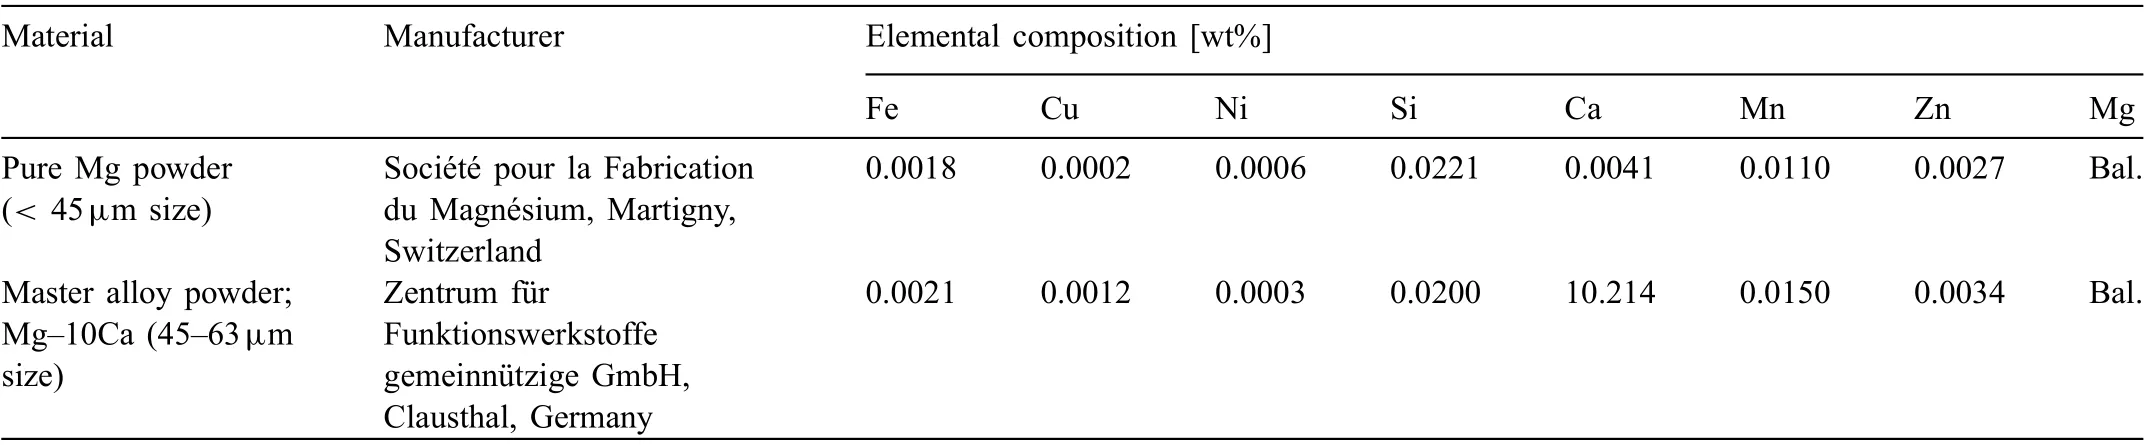
Table 1 Raw powder specification in gas-atomized condition used in the production of Mg-0.6Ca powder mix.
Cylindrical specimens of approximately 11mm × 11mm(diameter × height) and micro tensile specimens were manually compacted at 100MPa using a pneumatic hydraulic press.Specimen dimensions and weights were recorded prior to sintering. Raw powder storage, powder mixing and compaction took place inside an Ar glove box compartment (MBraun,Garching, Germany) to prevent atmospheric contaminations and promote safety during powder handling. Sintering was carried out under high purity Ar gas for 64h at ambient pressure conditions in a retort furnace (MUT RRO350-900,Jena, Germany). Furnace sintering temperatures were chosen in the region between 560°C-635°C at 15°C interval where the master alloy Mg-10Ca forms partial liquid between 516°C-579°C and forms complete liquid at temperatures above 579°C during liquid phase sintering as shown in the Mg rich side of Mg-Ca phase diagram in Fig. 2B. Additional sintering runs with intermediate temperatures were later conducted to narrow down the open to close pore formation temperature in the specimens. Sintering run schematic is shown in Fig. 2A. It should be noted that in Fig. 2A the recorded sample sintering temperatures are shown as they generally were 8- 9K lower than the set furnace sintering temperatures. Vacuum heating was employed to reduce atmospheric contaminations and promote uniform heating. The heating rate was changed from 10K/min to 1K/min for the fina 100K to lessen the drastic liquid phase formation before the onset of actual sintering. High purity Ar was input at the onset of actual sintering segment [28,36]. In addition,sample crucible was surrounded by loose Mg coarse powder(oxygen getter material) to prevent hindrance from residual oxygen during sintering. It should be noted that in Fig. 2B,the vertical line was drawn at 10.214wt% owing to the actual Ca content in the used master alloy as indicated in Table 1.
2.3. Density and porosity measurements
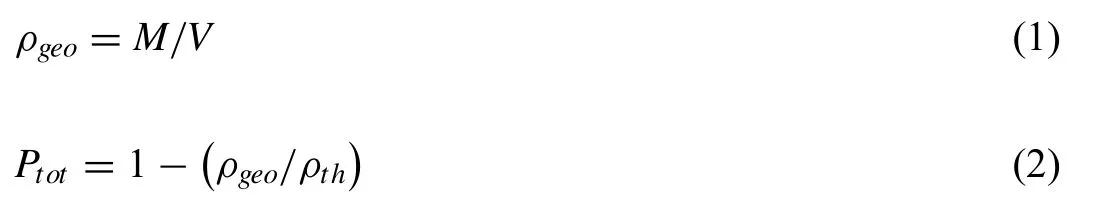
The geometrical density (ρgeo) was measured using Eq. (1) after obtaining the volume (V) and mass (M) of sintered porous Mg-0.6Ca specimens. Specimen volume was obtained via the dimensional measurements using calipers(16EX, Mahr Metering Systems GmbH, Göttingen, Germany)and mass was determined using an analytical weighing balance with 0.0001g precision (LA320S, Sartorius AG, Göttingen, Germany). The percentage error in the measured diameter and length of sintered specimens was less than 1% and 5%,respectively.Specimen porosity(Ptot)was then calculated using Eq. (2). An average for 14 samples was recorded for this purpose. Theoretical density value (ρth) for Mg-0.6Ca alloy used was 1.75g/cm3as determined by Helium gas pycnometer (AccuPyc II 1340, Micromeritics GmbH, Aachen,Germany) measured directly on Mg-0.6Ca powder mix prior to compaction. The fraction of closed pores formed in Mg-0.6Ca specimens sintered at different temperatures was assessed from their segmented μCT pore volumes.
2.4. Chemical analysis
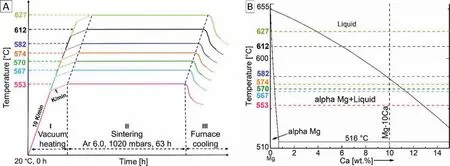
Fig. 2. A) Schematic of sintering runs employed to generate Mg-0.6Ca specimens with varying degrees of porosity. B) Calculated Mg rich side of the Mg-Ca equilibrium phase diagram [37] indicating the sintering temperature regimes used in present study and their isothermal interaction with liquid forming Mg-10Ca master alloy powders.
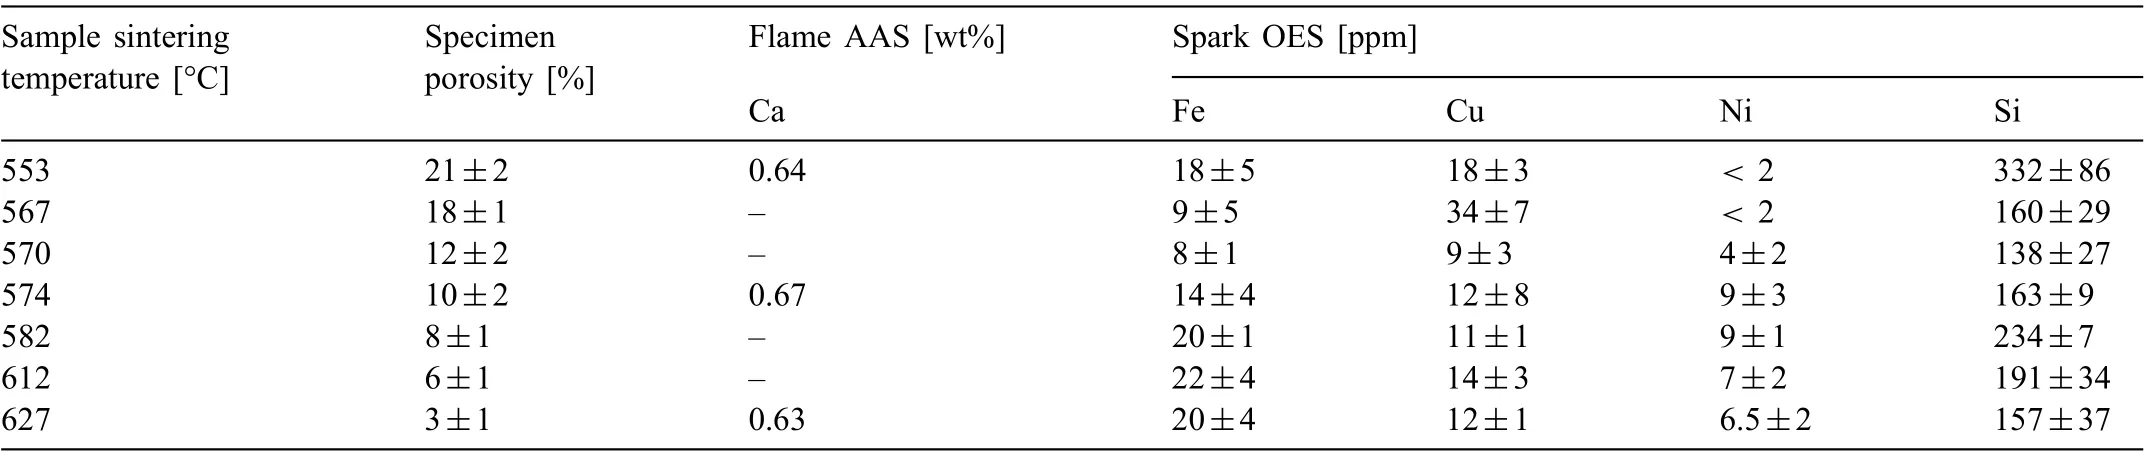
Table 2 Measured porosity (n=14) and impurity analysis (n=5) and Ca analysis (n=3) of sintered Mg-0.6Ca specimens with varying porosity prior to immersion degradation test.
All elements in the raw powders (except Si concentrations) listed in Table 1, Ca concentrations in Mg-0.6Ca powder mix and in subsequent sintered specimens (shown in Table 2) were detected by flam atomic absorption spectrometer (flam AAS) (240 FS AA, Agilent technologies Deutschland GmbH, Waldbronn, Germany). The percentage error in all Ca measurements by AAS was less than 1.5%. Si concentrations in Table 1 and Fe, Cu, Ni, Si concentrations in Table 2 were determined by Spark atomic emission spectrometry(spark AES) (SpectroLAB, SPECTRO Analytical Instruments GmbH, Kleve, Germany).
For flam AAS, samples (powder or bulk form) and calibration standards were prepared by dissolving the constituents in 8mL Nitric acid (37vol%) for every 100ml of required sample solution and were normalized for the same Mg matrix using MgCl2·6H2O salt solution. Sample solutions were aspirated at a sample feed in rate of 4.8mL/min in an airacetylene flam with a fl w ratio 6.75:1. For spark OES,sintered cylindrical specimens of diameter 10mm and height 5mm were machined. High temperature plasma generated by pure Ar gas was used to ionize the elements in the sample.The calibration of the device was performed using two pure Mg standards (with trace elements of Zn, Fe, Ni, Si, Sn, Zr and Y), ZE464, AZ442 and Sr1.8 standards. Al concentrations from spark AES were not recorded due to the specimen holder ring made of AlN across the direction of spark travel.
2.5. Microstructure and tomography
Electron microscopy was performed to reveal different features in the polished sintered specimens. Cylindrical specimens of diameter 10mm and height 10mm were cold embedded in an epoxy resin (Demotec 30Demotec Demel e.K,Nidderau,Germany).Automatic grinding was performed from 500 grit to 2400 grit SiC sandpapers. Automatic polishing procedure was performed using water free SiO2(OPSTMCloeren Technology GmbH, Wegberg, Germany) and diamond particle suspension (both 0.25μm in size) supplemented with water free lubricant (ethylene glycol to ethanol in parts of 10:7). Etching has been omitted to avoid negative effects on precipitate features. Phase identificatio has been performed using Energy dispersive X-ray analysis (EDX).
For tomography analysis, porous specimens of height 10mm and cross section of 1mm×1mm were machined and surface was prepared using a 4000 SiC sandpaper. Samples were imaged using a Phoenix Nanotom benchtop μCT (GE inspection and sensing technologies, Wunstorf, Germany) at an operating voltage of 100kV at 70 μA current discharge. In total, 2300 projections were obtained with an exposure time set to 1500ms/ projection and image averaging set to 4. The effective voxel size was 1 μm3.A representative slice through the image volume of a specimen with 12% porosity is shown in Fig. 3A. After the data reconstruction, image analysis software Fiji [38] and Avizo9.3.0 (FEI, Thermo ScientifiTM,France) were used for 3D characterization of pores. Of the total reconstructed volume, three volumes each of 700μm ×700μm × 500μm were chosen for specimens of each porosity level to reduce computational time.

Fig. 3. A) Representative μCT slice pertaining to Mg-0.6Ca specimens with 12% porosity after reconstruction, B) After 3D median filterin and C) After thresholding where the pores are shown in white.
Image processing started by applying a 3D median filte of size 2×2×2 for a chosen tomographic volume in Fiji.The size of the filte was chosen based on reduction in background noise but no blurring of the image as shown in Fig.3B [39]. Thresholding segmentation based on an iterative algorithm IsoData or k-means clustering was performed. The algorithm calculates the segmentation threshold as mid value of average background and the foreground object pixels [40].As an example, the pores after thresholding for specimens with 12% porosity are shown in Fig. 3C. After segmentation of the chosen volumes, the number of pores and pore volumes were detected by a two stage connectivity analysis using 3D objects counter plugin in Fiji [41]. Objects lower than 27 voxels (27 μm3) were excluded from the pore characterization analysis. For calculating the closed pore fraction,the pore volumes touching the boundaries(i.e.surfaces)of the investigated μCT volume were excluded from the total investigated pore volumes. The segmented 8-bit data was loaded in Avizo9.3.0 to assess their curvature and generate 3D images. The surface morphology of the segmented pores was assessed from their combined mean and Gaussian curvature distributions [42,43]. Based on a triangulation approximation,the voxel-based surface of the segmented pores is generated and the local radii values for the curves pertaining to the surfaces were computed and averaged up to the fift neighbor. The reciprocal values of these respective local radii yield curvature values, which were later transformed into a matrix of mean and Gaussian curvatures and contour plotted. Since huge surfaces generate huge data, the number of curvature data points was limited to one million which were selected randomly by a Python script. For the sake of clarity during visual demonstration, the lower frequency limit in the contour plots was manually raised so as to obtain a white background.Pore diameters were determined for the maximum inscribed sphere corresponding to each segmented pore volume.
Pore interconnectivity in Mg-0.6Ca specimens sintered at different temperatures was calculated using the formula [42]:
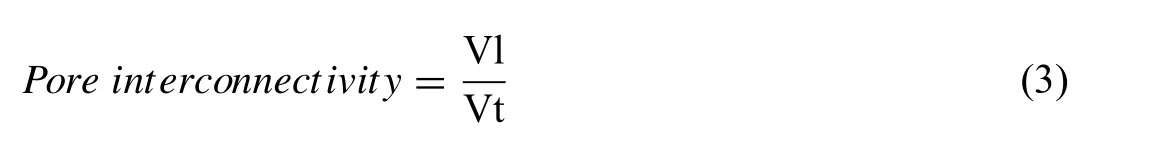
where Vl and Vt are the largest pore volume and total pore volume of the sample respectively.
2.6. Immersion test
The degradation test was performed via a modifie ASTM G31-12a approach for immersion testing under physiological conditions [44]. In brief, the immersion test for porous Mg-0.6Ca specimens was carried out for 16 days with 2 samples per time point for specimens of each porosity level. Initially,sample surfaces were ground to 4000 SiC sandpaper. Sample dimensions were of diameter 10mm and height 2mm approximately. Cleaning process prior to immersion testing includes ultrasonic treatment of the samples with reagents cyclohexane and acetone for 20min each. Ethanol (70%) was used for sample sterilization. In order to promote near physiological conditions, DMEM+Glutamax ((+) 4.5g/L D-Glucose, (+)Pyruvate, Life Technologies, Darmstadt, Germany) supplemented with 10% FBS (Fetal Bovine Serum, PAA Laboratories,Linz,Austria)and 1%Penicillin Streptomycin were used as cell culture medium chosen after [45,46]. Fresh medium was introduced to the samples every alternate day followed by simultaneous pH and osmolality measurements of the old medium. During incubation time, the samples were placed in an incubator with internal environment of 37°C, 5% CO2,20% O2, 95% relative humidity.
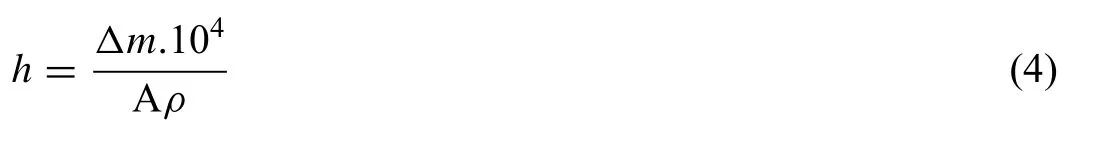
Mean degradation depth (MDD) h (in μm) of the samples was calculated using the following equation:where Δm is the mass loss difference before and after degradation (g), A is the total surface area of the specimen (cm2),ρ is the density of the material under investigation (g/cm3).According to the present approach, the mean degradation rate(MDR) (μm/d) is obtained as the slope value from the linear regression line fitte to the experimental data. For the sake of comparison to the existing literature,the MDR values are presented in mm/year. Linear regression was fitte using Origin 2017 software. The mass of the formed degradation layer was measured as the difference in sample mass with the degradation layer and after subsequent chromic acid treatment.
To remove the degradation products after immersion test,samples were treated with chromic acid for 20min (180g/L in distilled water, VWR International, Darmstadt, Germany)followed by cleaning with ethanol and distilled water. After this treatment, dry chromic acid remained on the surfaces of specimens with porosities 18% and 21%, leading to a certain increase in the weights of these specimens.This was corrected by recording the increase in weights of these porous specimens when they were directly exposed (i.e. without degradation layer) to chromic acid for 20min at a different instance.It should be noted that either a slight overestimation or an underestimation in the measured mass loss values in specimens with 18% and 21% porosities could be expected by this correction. This is because the degree of pore penetration by the acid due to capillarity is different in different degrading specimens due to varying degradation layer morphology on the surface and in the interconnected pores. This effect due to the layer, however, can be ignored in the specimens used for weight correction. On the other hand, the worn out and rugged degraded surfaces may deposit higher dry acid content compared to that of its initial surface condition.
2.7. Tensile test
To test the load bearing abilities of the sintered porous Mg-0.6Ca specimens, tensile tests were performed according to DIN EN ISO 6892-1:2009 on 5 samples. The elongation during the test was monitored using a laser extensometer(Fiedler Optoelektronik GmbH, Lützen, Germany) within an initial marked gauge length of 10mm and at a strain rate of 0.2mm/min (Zwick Roell Z005/ TH2A modell, Zwick Roell GmbH & Co. KG, Ulm, Germany).
3. Results and discussions
3.1. Sintering temperature and porosity in Mg–0.6Ca specimens
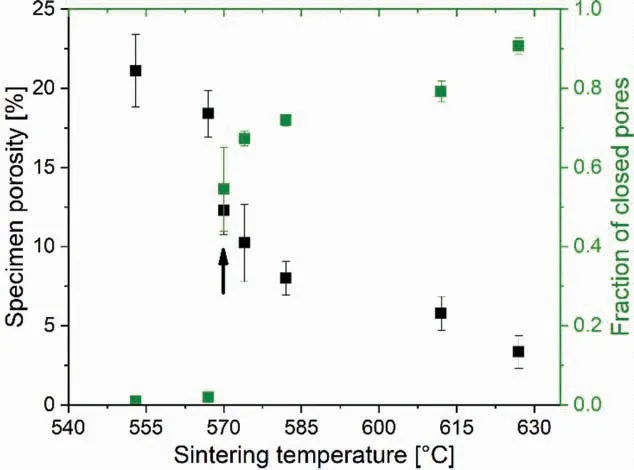
Fig.4. Variation in Mg-0.6Ca specimen porosity and fraction of closed pores formed as a function of sintering temperature. The arrow indicates the sintering temperature where a sharp increase in closed pore nature is detected with a simultaneous decrease in the specimen porosity.
The relative density of specimens after initial compaction ranged between 78 - 80% indicating a good reproducibility of the green compact density. The high green density is attributed to the use of fin Mg particle sizes (<45μm) as in Table 1. Employing Ar sintering atmospheres assisted with Ca rich liquid phase similar to [27] resulted in sinter densities close to the theoretical value for Mg-0.6Ca in the present study. As shown in Fig. 4, sinter densities close to 97% theoretical value (nearly 3% specimen porosity) were obtained when sintered at 626°C. Comparing Fig. 4 and Fig. 2B, it can be observed that the densificatio in Mg-0.6Ca specimens directly relates to the mass fraction of liquid formed by Mg-10Ca master alloy powder. It was ascertained via differential thermal analysis that Ca diffuses rapidly from the formed liquid to the surrounding Mg base material when the liquid forming master alloy is held above eutectic temperatures even for a few minutes [27]. This diffusion leads to a decrease in the Ca composition away from the eutectic composition resulting in solidificatio of the remaining melt during cooling stages after liquid phase sintering. This shows the importance of Ca rich liquid phase in densificatio during sintering. A sharp decrease in the porosity values from 18% to 12% is noticed between sintering temperatures 567°C- 570°C. The same temperature change also marks a sharp increase in the formed closed pore fraction in the specimens after sintering(indicated by the black arrow in Fig. 4). Nearly 55% of the formed closed pore fraction is detected at 570°C.Sintering temperatures lower than 570°C favored high open pore fraction. In general, Mg-0.6Ca specimen porosities decreased from 21% to 3% with increasing sintering temperatures with a subsequent increase in the fraction of closed pores. The high error bars for specimen porosities in Fig.4 arise from the measured sample dimensions after sintering. Samples after sintering exhibited resublimed Mg deposit presumably due to vacuum heating employed in the present study followed by the slow heating rate as in Fig. 2A. The extent of this Mg resublimation varied with fina sintering temperatures. In order to eliminate the influenc of this deposit on sample degradation, all samples were ground manually which resulted in error in dimensional measurement.In the present study the compaction pressure was limited to 100MPa to provide porous structures with sufficien compact handling strength due to the inherent low yield strength of Mg alloys.The porosity of nearly 23%in samples green condition obtained in the present study are similar to that reported in cold compacted Mg particles of 30μm size at 100MPa [47].
As mentioned earlier, the master alloy Mg-10Ca is the provider for Ca rich liquid phase at sintering temperatures.Within each green compact, particles of pure Mg and Mg-10Ca master alloy powders coexist at random sites. The master alloy powder enters complete liquid at 579°C as indicated by the Mg rich side of Mg-Ca equilibrium phase diagram in Fig. 2B. The sintering temperature of 570°C, where a sharp decrease in specimen porosity is witnessed in Fig. 4, is close to this complete melting temperature of Mg-10Ca master alloy powder.So,a higher liquid fraction can be expected at this temperature. From lever rule calculations, nearly 90% mass fraction of the master alloy powder contributes to liquid formation under equilibrium conditions at 570°C before entering complete liquid at 579°C [37]. Therefore, it can be ascertained that this sintering temperature has to be overcome to promote enhanced liquid phase sintering in Mg-0.6Ca specimens. In general, the sudden increase in sinter density by a small variation in sintering temperature is characteristic for liquid phase sintering [48].
3.2. Impurities and microstructures of Mg–0.6Ca specimens
The average Ca contents in Mg-0.6Ca powder mix (before sintering), which was compiled according rule of mixture, is 0.59wt% when measured by AAS. The measured Ca values in the powder mix, however, are lower than expected even with an actual Ca content of 10.214wt% in the master alloy as indicated in Table 1. The calculation yields approximately 0.626wt% Ca in the resulting Mg-0.6Ca powder mix when 10.214wt% Ca is used during powder mix compilation. However, it was measured to be 0.59wt% by flam AAS. This deviation in Ca content from the calculated to realistic values in Mg-0.6Ca powder mix indicates the possibility of powder losses during handling. It should be mentioned that this discrepancy occurred because the Ca content in the master alloy was measured at later stages of the work during which the sintering runs indicated in Table 2 were already completed.After sintering, an increase in the overall Ca content is observed as shown in Table 2 for Mg-0.6Ca specimens at specifi sintering temperatures. As indicated previously, a resublimed Mg deposit is observed on the specimen surfaces after sintering.Since the main source of Mg available at the specimen vicinity for this deposition to take place is the specimen itself,the increase in Ca content in specimens after sintering is attributed to a possible decrease in the bulk Mg concentration in the specimens. This is because the formed resublimed Mg rich layer has been removed by manual grinding of surfaces for all sintered specimens prior to any type of characterization. Between each set of porous samples analyzed, the impurity contents of Fe, Cu, and Ni vary in a random fashion as shown in Table 2. Chemical analysis also reveals the presence of Si before and after sintering. In general, the overall impurity concentrations remain low,which qualify these specimens for immersion degradation test.
In the present study, specimen sinter densities obtained at low sintering temperatures of 553°C and 567°C are only negligibly higher than their corresponding green density values.However, sintering necks are clearly visible indicating bonding between the particles as shown in Fig. 5A. Uniform pore distribution was observed in the investigated porous specimens as evident from the small deviations in the average pixel values of segmented 1900 μCT images as shown in Table 2. In Fig. 5, microstructures of Mg-0.6Ca specimens with porosity values of 21% (Fig. 5A, B), 12% (Fig. 5C, D)and 3% (Fig. 5E, F) are shown as examples. Shrinkage in pore sizes with increasing sintering temperatures is visible.Sintering necks are visible between Mg particles also in samples with 21% porosity which later transform to grain boundaries at sintering temperatures ≥570°C i.e., when specimen porosity is ≤12%.
The presence of Mg2Ca precipitates in sintered microstructures along the particle boundaries indicates that the compaction pressure of 100MPa along with longer sintering times of 63h are sufficien to facilitate both the breakdown of the powder oxide surface and allow migration of liquid phase by capillary action. The composition of this phase is identifie approximately as 17.6wt% (O), 18.6wt% (Si), 22wt%(Ca) and rest (Mg) by EDX analysis. O and Si are probably detected due to polishing medium containing Silica particles that can be embedded around the precipitate phase during polishing. However, the presence of Mg2Ca phase is not continuous along the grain boundaries. In the microstructure of Fig. 5B, certain particle boundaries are enriched with MgO precipitates. The composition of MgO phase by EDX analysis showed <2wt% (O), 0.04wt% (Si), 0.2wt% (Ca) and rest (Mg). The disparity is likely due to small MgO particle sizes and huge interaction volume of the electron beam with Mg matrix. As pure Mg and Mg-10Ca powder surfaces are oxidized in their starting condition, this observation indicates the occurrence of inter particle bonding between pure Mg particles even at low sintering temperatures despite the presence of oxides, provided clean furnace conditions exist during sintering.
Sintered microstructures consist mainly of MgO precipitates, Mg/Ca/Si phase, Mg2Ca precipitates and Mg matrix.MgO particles are very fin and are found rather continuously along the former particle boundaries along with Mg2Ca phase as indicated in the Fig. 5B, D, and F. However, oxides are occasionally found also in the grain interiors. Increase in sintering temperature did not alter the position and morphology of the phases formed significantl apart from Mg/Ca/Si phase whose size appears to increase at sintering temperatures higher than 570°C (compare Fig. 5D and E). The overall volume fraction of this phase should be small owing to Si concentrations in raw powders (Table 1). The composition of Mg/Ca/Si phase is approximately 4.1wt% (O), 28.5wt% (Si),38.4wt% (Ca) and rest (Mg). As all samples were produced from the same raw powders and no abnormalities like gas pockets, cracks or liquid bubbles are observed in as sintered specimens, it is clear that the overall sample shrinkage is a consequence of shrinkage of pores at high sintering temperatures indicating good sintering response of Mg-0.6Ca alloy specimens. High sinter densities can be attributed to the high liquid phase activity at elevated temperatures. Though Mn presence is evident in the raw powders, no visible precipitates are observed in the sintered microstructures owing to a higher solid solubility of Mn in Mg [49].
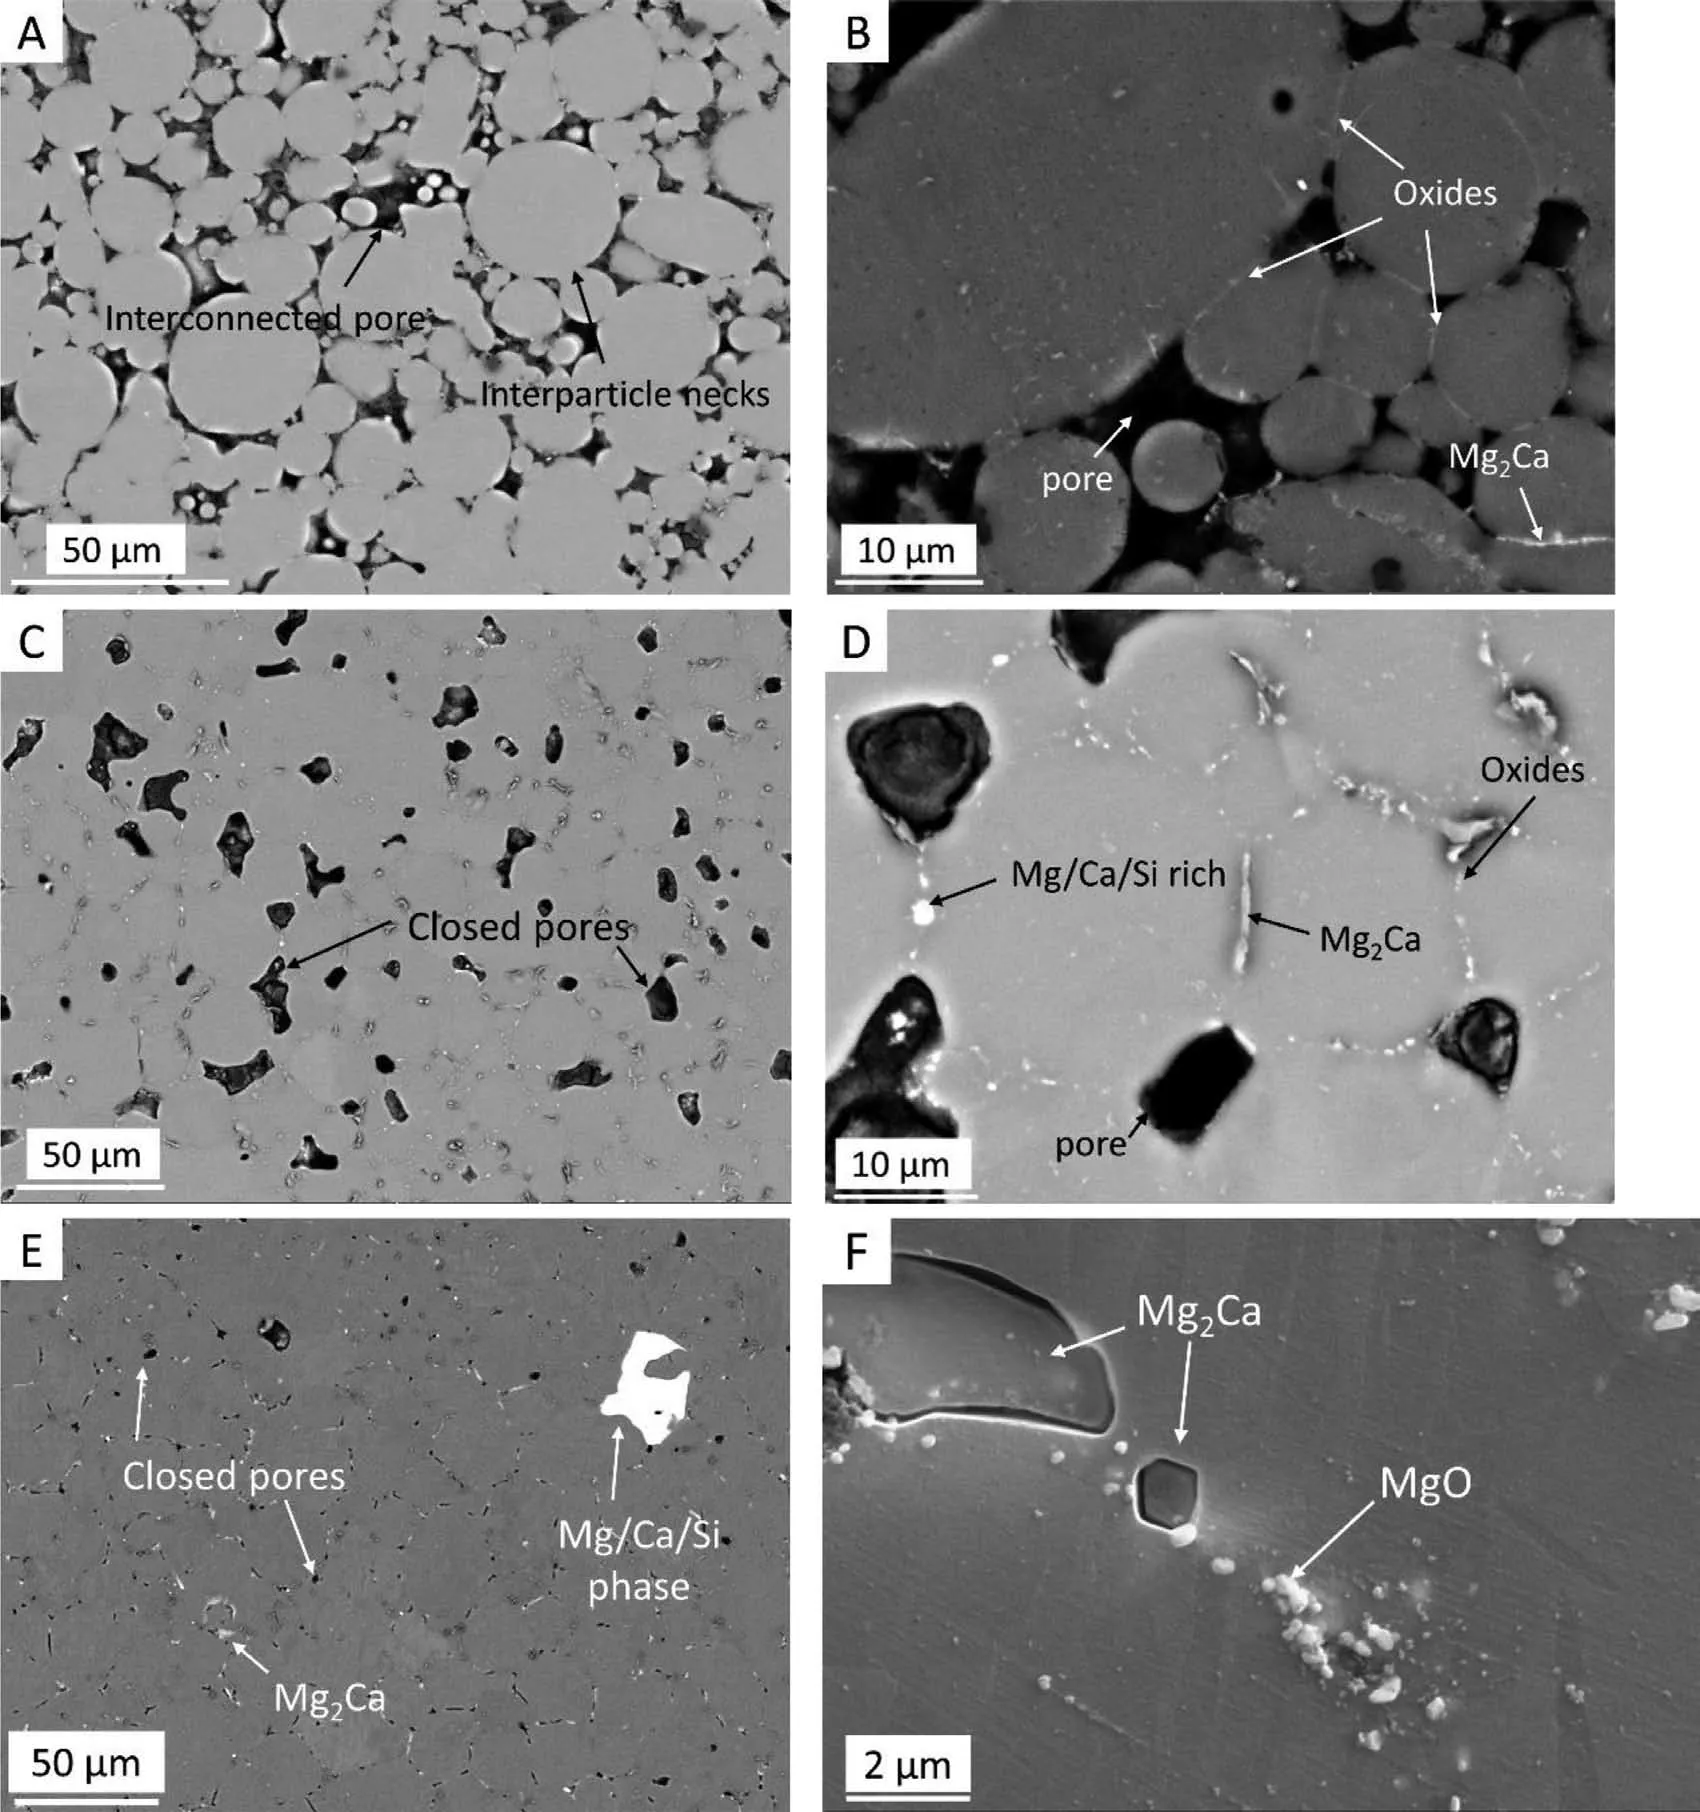
Fig. 5. Electron microscope overview images of sintered Mg-0.6Ca specimens with A) 21% C) 12% E) 3% porosity. B), D) and F) High magnificatio images revealing different phases in these respective specimens.
Despite longer sintering times at elevated temperatures close to melting, as in Fig. 5E and F, no pronounced change in grain sizes or grain growth has been observed in the sintered specimens. The average grain size after sintering remains similar to the d50value of pure Mg raw powder of 20μm. Thus, the oxides at the grain boundaries appear to hinder grain growth which is in agreement to the observations of Schaper et al. [26].
3.3. Quantitative μCT pore parameters for porous Mg–0.6Ca specimens
3.3.1. Pore interconnectivity
3D visual representation of segmented pores of porous Mg-0.6Ca specimens is given in Fig. 6. Mg-0.6Ca specimens with porosities 21%, 12%, 8% and 3% are shown as examples. In specimens with 21% and 18% porosities, a huge part of the investigated pore volume is occupied by a single large pore indicating a high pore interconnectivity (Fig. 6A and B for specimen porosity of 21%). Table 3 quantifie the pore interconnectivity higher than 95% in these specimens.Presence of small pore volumes is also detected amidst this largest pore volume indicating a small fraction of closed pores in these specimens that is reflecte in Fig. 4 at sintering temperatures of 553°C and 567°C.

Fig. 6. Rendered 3D images of segmented pore features from similar μCT volumes in Mg-0.6Ca specimens with A) 21%, C) 12%, E) 8% and G) 3% porosity values. B), D), F), and H) represent the images of the largest pore volume in Mg-0.6Ca specimens corresponding to the aforementioned porosity levels.
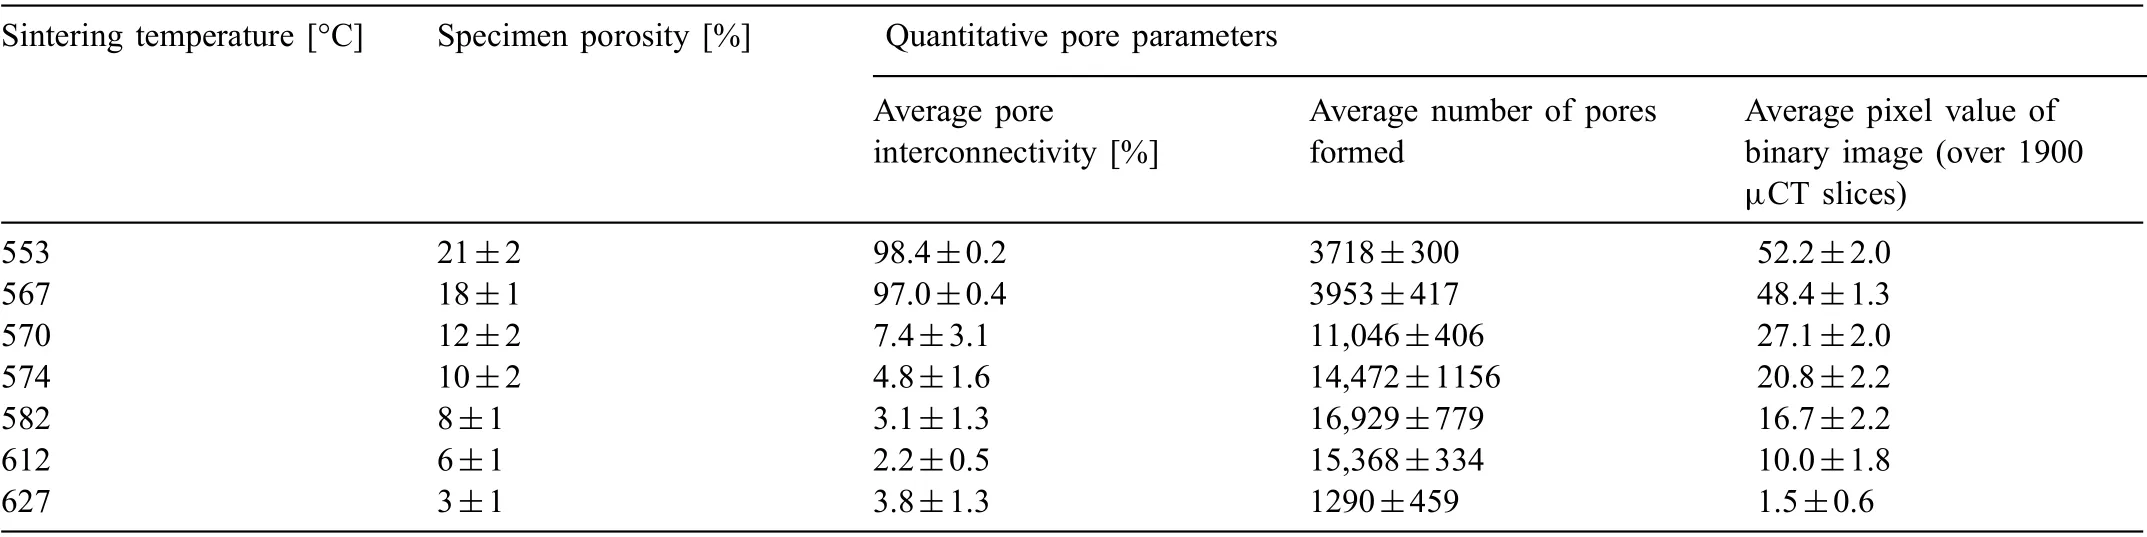
Table 3 Quantitative pore parameters obtained from three similar μCT volumes pertaining to sintered Mg-0.6Ca specimens with varying degrees of porosity.
The decrease in pore interconnectivity to <10% is observed for specimens with porosities ≤12%. Simultaneously,an increase in the total number of pores formed is witnessed as shown in Table 3. This indicates a disintegration in this largest pore volume with increasing sintering temperatures leading to an increase in the number of pores formed. This can also be visually observed in Fig. 6A-C to E. It should be noted that in Table 3, the average number of pores formed may be slightly exaggerated due to similar tomographic volumes chosen for pore characterization in these specimens despite the differences in their actual dimensional shrinkage.The number of pores formed in specimens with 3% porosity again greatly reduced. This may be attributed to a further decrease in the formed pore sizes at high sintering temperatures that are not detected due to the minimum object size of 27 μm3chosen in the present μCT analysis. In specimens with ≤12%porosities,a decrease in the volume of the largest pore can be visually observed with pore interconnectivity remaining nearly the same (Table 3). It is to be noted that the sharp decrease in pore interconnectivity (Table 3) and a sudden increase in the fraction of closed pores formed (Fig. 4)commenced at the same sintering temperature of 570°C. This indicates again the importance of Ca rich liquid phase in promoting higher fraction of closed pores at these sintering temperatures and thereby reducing pore interconnectivity.
3.3.2. Pore curvatures and pore size distributions
The contour plots of the combined mean and Gaussian curvatures of all segmented pore volumes (Fig. 7, left column:A, C, E and G) and of the respective largest pore volume(Fig. 7, right column: B, D, F and H) corresponding to Mg—0.6Ca specimens with porosities 21%, 12%, 8% and 3% are shown. In general, it is observed that the formed pores after sintering tend to obtain a spherical morphology irrespective of the sintering temperature. This is evident by the distribution slanting towards the positive-positive (mean-Gaussian curvature) in Fig. 7, left column: A, C, E and G where the representative curvatures for all segmented pores are shown.Furthermore, with decreasing specimen porosity the Gaussian curvature narrows down implying a certain pore shape change from symmetric saddle to convex cylindrical with a simultaneous increased tendency to form spherical pores.
From Fig. 7D, the curvature distribution of the largest pore volume in specimens with 12% porosity shows a shift from positive-positive (mean-Gaussian curvature) to the negativepositive (mean-Gaussian curvature). This shift in the quadrant implies that the largest pore possesses a more pronounced pit type morphology unlike the spheroidal morphology observed for all segmented pores, as in Fig. 7C, in specimens belonging to 12% porosity category. The same holds for the curvature distributions of the largest segmented pores belonging to lower porosity specimens (examples are shown for 8% and 3% specimen porosities in Fig. 7E to F and Fig. 7G to H, respectively). A symmetric distribution across the center can be visualized. This is, however, not the case for specimens with 18% and 21% porosities, where the largest pore volume alone dominates the total investigated pore volume as indicated in Table 3. For these porosity levels, the curvature distributions of all segmented pore volumes and of the respective largest pore volume remains fairly the same as shown in Fig. 7A to B.
The curvature distributions in Fig. 7 represent an average shape entity of the segmented pores. The slanting distribution in Fig. 7, left column: A, C, E and G in firs quadrant certainly indicates, on an average, the spherical nature possessed by the formed pores. However, the width of the distribution along the mean and Gaussian coordinates indicates more complex and convoluted intermediate shapes. For example, each data point in Fig. 7F represents the normalized frequency of the mean and product of principal curvatures operating on the curved surface of the largest pore shown in Fig. 6F. Though the average distribution from these principal curvatures indicates both convex and concave morphologies as in Fig. 7F,the more convoluted nature of the pore in Fig. 6F is explained by the width in mean curvature (-0.25 till 0.3) and Gaussian curvature (-0.5 till 0.5) between which a variety of intermediate pore surface shapes can exist according to shape indicators depicted in Fig.7A.This way of pore shape assessment from 3D structure information is considered superior to the conventional 2D micrographs. In fact, complex and convoluted pore structures were reported in sintered specimens when their 3D structure is analyzed [50]. Hu et al. [51] calculated 3D segment tortuosity on the pores of sintered ZrO2nanostructures and illustrated high tortuosity values at low relative sinter densities which later decreased with increase in relative sinter density. They also reported the presence of interconnected pore structures with an overall low tortuosity value in specimens with relative sinter densities nearing 95%.Though a quantitative number for pore interconnectivity was not assigned in their work, the presence of convoluted pore structures at relative sinter densities approaching 90% in the present work (as example in Fig. 6D, F and H) concurs well with their observations.
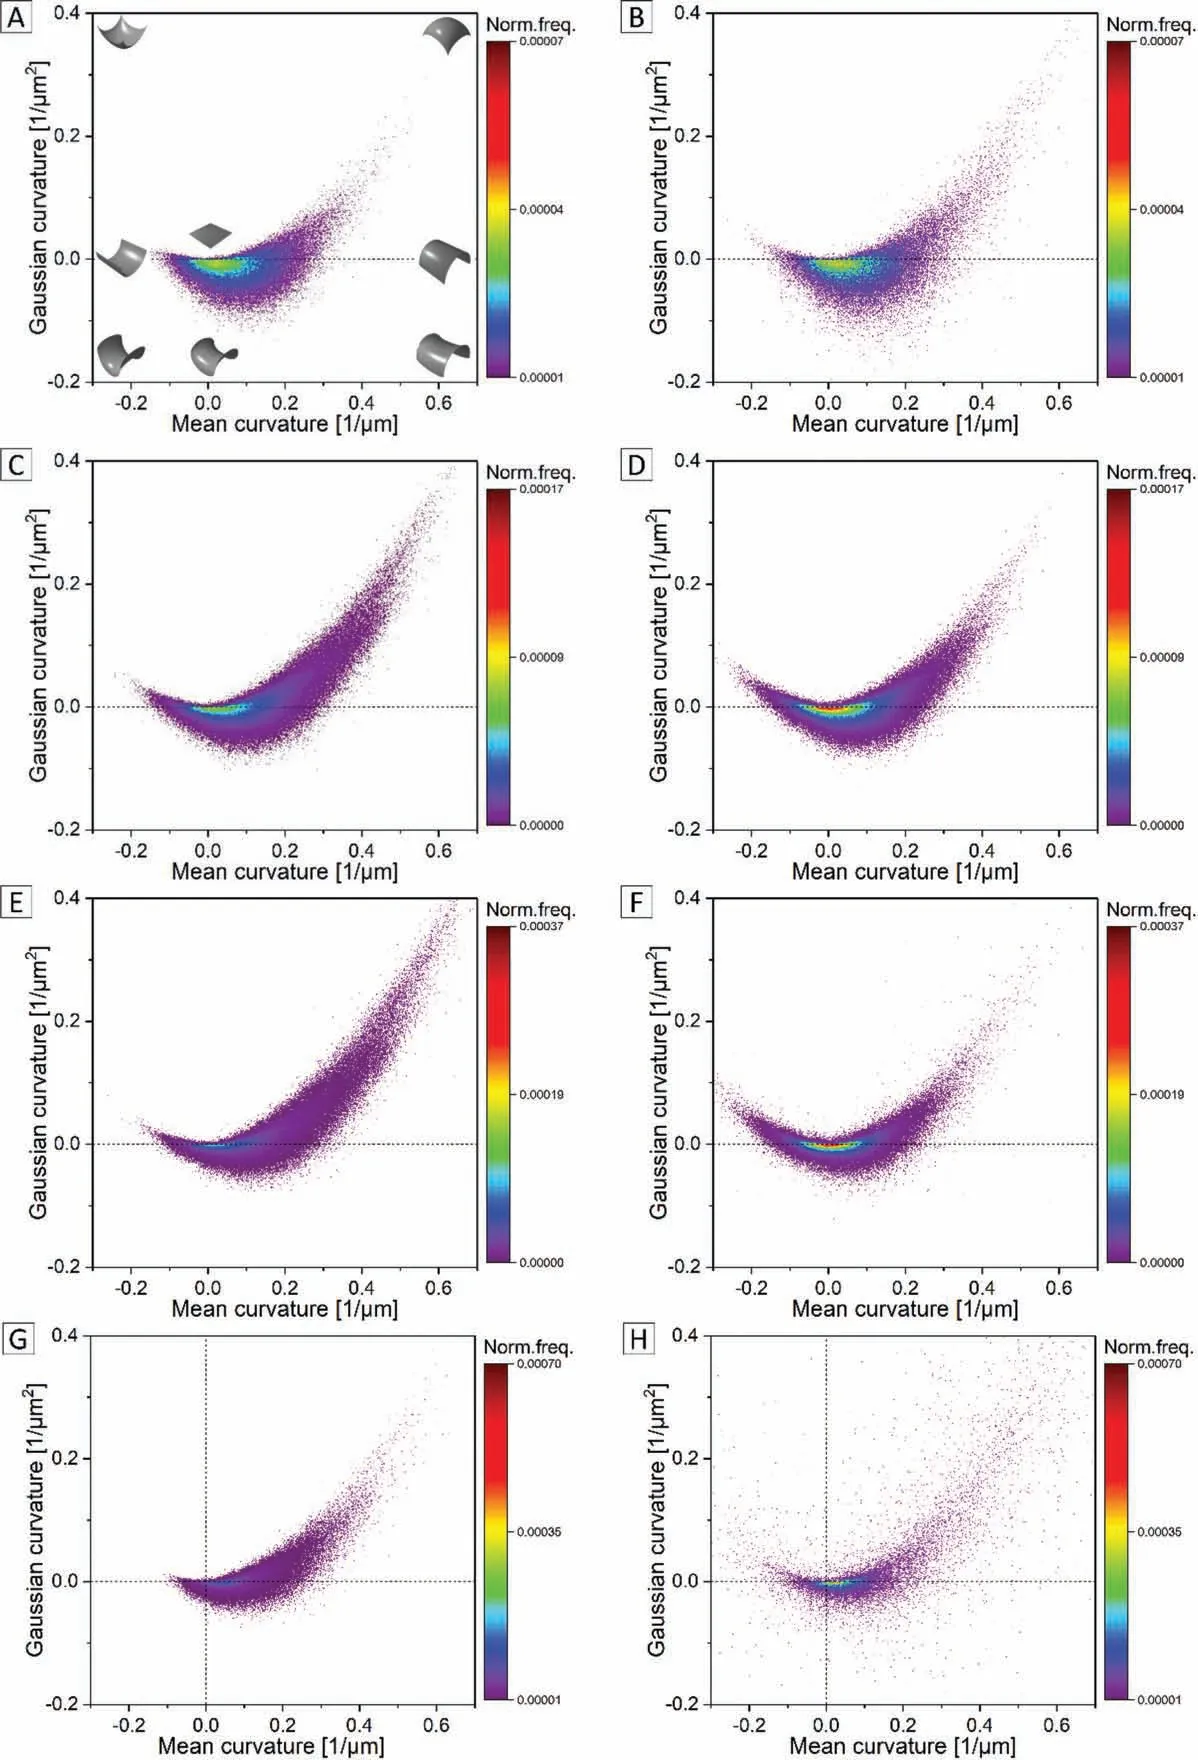
Fig. 7. Combined mean and Gaussian curvature distributions of all segmented pore features from similar μCT volumes in Mg-0.6Ca specimens with A) 21%,C) 12%, E) 8% and G) 3% porosity. B), D), F), and H) represent curvature distributions of the largest pore volume in Mg-0.6Ca specimens corresponding to the aforementioned porosity levels. The shape indicators depending on the signs of mean and Gaussian curvatures are shown in A.
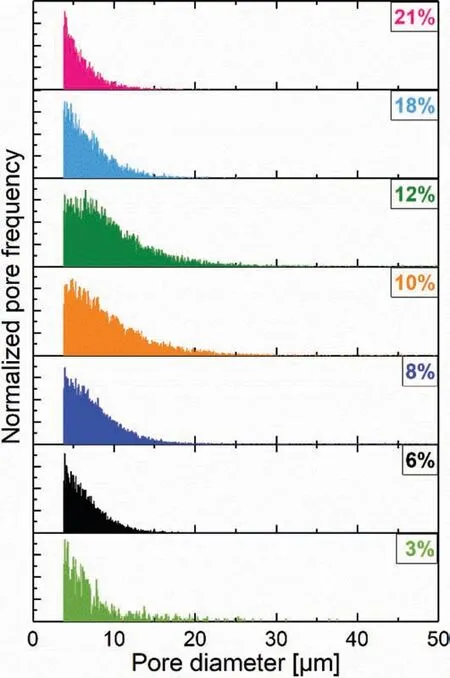
Fig. 8. Normalized pore size distributions obtained from similar μCT volumes for sintered Mg-0.6Ca specimens with varying porosities. For the sake of clarity only the pore diameters with high frequency are shown.
In present study, the reason for the difference in shapes of the largest pore to the rest of the small pores within the same specimen is presumed to be due to an enhanced rearrangement densificatio mechanism occurring at sintering temperatures >570°C, where high liquid fraction exists in the present Mg-Ca system [52]. In addition, at these temperatures, pores in sizes of 45-63μm can be formed at random sites where master alloy particles form liquids that may variably spread into the surroundings due to grain size dependent capillary forces [52,53]. Therefore, the fina shape of the large pores is dictated by the combination of primary and secondary pores formed between pure Mg particles and master alloy melting respectively, that can expectedly be convoluted and non-spherical in nature.
The pore size distributions shown in Fig. 8 indicate that in all porous Mg-0.6Ca specimens, except for specimens with 10% and 12% porosities, the distribution tails off at pore diameters nearing 15μm confirmin that majority of formed pores are small in these porosity levels. For the specimens in the transition region from open to closed pores, i.e. for 10%and 12% porosities, the distribution tails off at pore diameters greater than 20μm. Pores occasionally with diameters greater than 30μm are also visible in these porosity levels.Combining the results of curvature distributions of all segmented pore volumes in specimens with ≤12% porosities(as example in Fig. 7 left column: C, E and G) to their respective pore size distributions in Fig. 8, it can be inferred that the observed spherical pore morphology associates to the formed small pores. This, as expected, illustrates that small pores tend to possess spherical shapes.
3.3.3. Degradation profiles of porous Mg–0.6Ca specimens
In degradation profile for porous Mg-0.6Ca specimens(Fig. 9A), specimens with porosities ≤10% showed MDR values lower than 0.3mm/year. This is only three orders of magnitude higher than the reported value for bulk pure Mg specimens. Immersion test procedure on bulk pure Mg over 40 days under similar conditions as in present study resulted in a degradation rate of 0.09mm/year. In addition, the MDD values after 16 days immersion in Mg-0.6Ca specimens with porosities ≤10% are only 1.5-2 times higher than that reported for pure Mg (8.5 - 12μm compared to ~6μm, respectively) [54]. Specimens possessing porosities 18% and 21% showed MDR values near to 1mm/year. Highest degradation rate values are recorded in specimens with 12% porosity at about 1.6mm/year. The y-intercept value, which represents initial electrochemical reactions and anodic dissolution of Mg, is seen to increase with increasing specimen porosity(Fig. 9B). This is attributed to a high exposed surface area of the high porosity specimens to the physiological medium at initial immersion. Since a steady state degradation is idealized for Mg alloys, linear fittin coefficient close to 1 for the experimental data are desired. In the present study, high fittin coefficient are indeed observed in the degradation profile for specimens of all porosity levels except in specimen category with 10% porosity. In these specimens the fittin coefficien drops to 0.76 indicating a slight deviance from linear behavior during degradation. Nevertheless,the y-intercept and the overall MDD values remain below 10μm over 16 day’s immersion time resulting in a low degradation rate in these specimens.
The degradation profile in Fig. 9A of the present study revealed important finding in terms of in vitro conditions towards supporting porous Mg-0.6Ca specimens for their potential applicability in vivo. However, literature suggests that the high surface area of porous Mg scaffolds leads to a rapid degradation accompanied with subcutaneous gas bubbles in vivo [9]. A negative effect on cell viability and proliferation is reported in vitro resulting from high initial degradation of Mg scaffolds [19]. Therefore, the translation of the presented results to in vivo requires further cell experiments to elucidate their viability given this material and the employment of fl w conditions for immersion durations longer than those shown in the present study.
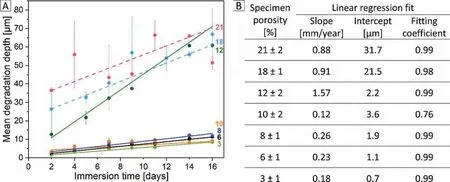
Fig. 9. A) Degradation profile of Mg-0.6Ca specimens with varying porosity obtained during 16 days immersion test. Straight lines indicate linear fi for the experimental data. B) Linear fi parameters corresponding to specimens with different porosity.
The interconnected pore channels in high porosity specimens are expected to increase the capillary action of the water based DMEM cell culture medium leading to higher degradation. Although degradation can occur from within the pore once the medium reaches the pore walls, the kinetics of degradation may differ to that of the surface [55]. Jia et al. [19] have reported for open porous Mg scaffolds that the formed degradation layer thickness in the internal pore walls remained constant even after 56 days immersion unlike the layer formed on the surface which increased in thickness with immersion time. They reported that the formation of degradation layer on the scaffold surface limited the further intake of medium to the pore. Though their immersion test conditions are similar to the present work with interconnected pore structures (as in specimens with 18% and 21% porosities), their porosity and pore sizes were many orders of magnitude higher than reported in the present work. In case of micro pores, as in the present study, variation in the local environment of the formed pit or pore i.e. depletion of cathodic reactants inside the pit favors an autocatalytic cell as long as aggressive anions are able to penetrate the degradation layer [56]. This type of cell causes a local acidic environment inside the pit that may further self-propagate pitting by reacting with metal cations.In addition, presence of secondary phases or impurities adjacent to pore walls can generate pitting in lateral direction. In the present study, degradation is observed only macroscopically and therefore multiple degradation mechanisms are expected to act at the pore sites. The evidence of huge scatter in error bars in Fig. 9A, however, indicates a non-reproducible nature of degradation between the specimens with high pore interconnectivities i.e. at 18% and 21% specimen porosities.A noticeable change in the degradation behavior is observed between specimens with 10% and 12% porosities (Fig. 9B).This is also evident by a near three-fold increase between their MDD values just after two days immersion. These specimens,in the surface open to closed pore transition regions, showed a similar pore size distribution (Fig. 8). However, from Fig. 4, the closed pore fraction increased as specimen porosity decreased from 12% to 10%. This means a higher fraction of surface open pores (nearly 55% from Fig. 4) in specimen with 12% porosity. This indicates the direct influenc of surface pores on promoting an increased initial degradation upon immersion and the degradation profil thereafter.
In a separate measurement it is observed that the overall volume contribution from the ten largest segmented pores does not exceed 15% of the total investigated pore volume(700μm × 700μm × 500μm) in specimens with porosities≤12%. From curvature measurements (Fig. 7 right column),the largest pore tend to possess a non-spherical and complex shape unlike the small sized pores that are spherical. Though it is difficul to discern the threshold pore size above which the spherical pore nature is deviated, in view of material’s degradation, the closed nature of pores is regarded more important than the actual pore shape.The surface area to volume ratio of non-spherical geometrical shapes is high, indicating that these large pores may expose a higher surface at some point during progressive material degradation. However, the overall volume fraction of these large pores is less than 15%of investigated volume as mentioned earlier. In view of these observations, it is inferred that the shape effect of these large pores on degradation may not be as significan as the degradation effect due to surface open pores that are exposed directly to the cell culture medium.
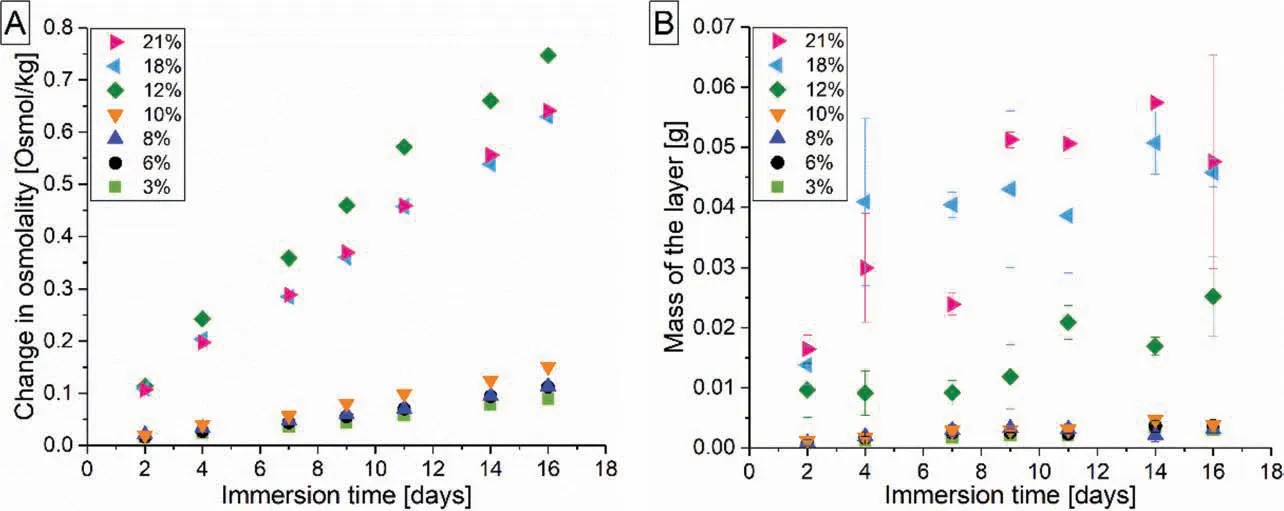
Fig. 10. A) Incremental change in the extract osmolality of degrading Mg-0.6Ca specimens with varying porosities during semi-static immersion test. B)Variation in the mass of the formed degradation products layer with immersion time.
The increment in the measured osmolality during immersion testing is regarded as direct indicator for material degradation [45]. Increase in osmolality is reported during Mg degradation even with the presence of protein complex in the employed cell culture medium [57]. Also in the present work,osmolality of the medium extract measured with progressive immersion time (Fig. 10A) correlates well with the degradation profile of porous specimens (Fig. 9A). Specimens with 12%porosity showed higher osmolality change as reflecte by their high MDR value and in specimens with ≤10%porosity,the increase in osmolality is minor. Since the layer thickness measurements were not performed in the present work, it is difficul to comment on the density of the formed degradation layer for different porous specimens. However, porosity dependent change in the nature of degradation layer can be qualitatively inferred from Fig. 10A and B. For specimen porosities ≤10%, mass of the formed layer is less with less scatter in the error bars as immersion time increased. This, in combination with the low osmolality change (Fig. 10A) and low MDR values (<0.3mm/year) in these specimens indicate a possible uniformity in the formed degradation layer.With specimen porosity ≥12%, this scatter increased and high MDR values are recorded (≥1mm/year). This indicates a non-uniformity in the layer formed due to an increase in the exposed surface area. However, the aspect of high MDR but only a moderate increase in the mass of the formed degradation layer for specimens with 12% porosity needs further investigation. It should be noted that this evaluation remains qualitative as material losses can occur during handling of specimens with degradation layer.
From Fig. 11, the degraded specimen surfaces with ≤10%porosity showed homogenous dimple like features with occasional presence of original pores. The sizes of these dimplelike features increased with immersion duration. The dimples turn to deep grooves as the specimen porosity increased to 12% as in Fig. 11D, E and F. Occasional pits are also observed after 16 days immersion in these specimens. As shown in Table 3 and Fig. 6C, the number of pores formed in specimens with 12% porosity is high indicating short distances between the pore centers. At higher porosities of 18% and 21%,the degraded surface is non-homogenous with cracks and deep grooves penetrating through the material just after two days of immersion time. Occasionally the pits penetrate nearly half of the specimen thickness with prolonged immersion times.All the images in Fig.11 represent the degraded specimen top surfaces. The degraded bottom surfaces showed pitting effect even in low porosity specimens. These pits are observed to form adjacent to non-corroded metallic surfaces indicating the possibility of medium localization leading to localized attack in these regions. Though the degradation profile shown for porous Mg-0.6Ca specimens in Fig.9A include this additional mass loss due to pitting at bottom surfaces, it is generally believed to be an artefact arising from the nature of immersion test procedure rather than the actual material degrading property. In the present work, degradation in specimens with 12%porosity is still considered reproducible due to low scatter in error bars of MDD values (Fig. 9A) though a higher average roughness of their degraded surfaces is expected than in the specimens with porosities ≤10%.
3.3.4. Tensile properties of porous Mg–0.6Ca specimens
Table 4 shows an increase in the tensile strength (UTS),elongation to fracture and yield strength with decreasing porosity in Mg-0.6Ca specimens. For specimens with porosities 3% and 6%, similar mechanical properties were recorded.On the other hand, no discernible yield strengths were obtained using similar tensile test parameters for specimens with 21% porosity. The representative tensile curves for porous Mg-0.6Ca specimens are shown in Fig. 12. Some specimens possessing 18% and 21% porosity levels prematurely fractured. This is to be expected as less material is available to carry the load. Certain specimens also exhibited negative strains at initial loading indicating the possibility of specimen slipping and rearrangement during initial stages of tensile testing.
Pores act as the plausible crack initiation sites during deformation loading [58]. The progress of deformation is then expected to follow the path of weakest resistance offered by the bulk material which is both bulk microstructure and structure thickness dependent [59]. As indicated in Table 3 and Fig. 6, with increasing sintering temperature from 563°C to 570°C, the number of pores formed increased by three times thereby decreasing pore interconnectivity. With an actual decrease in the specimen porosity after sintering, this increase in number of pores formed would mean a certain increase in the bulk strut thickness. As shown in Fig. 8, the pore sizes are further reduced for specimens with porosity <12% but with an increased number of formed pores this would mean a further increase in the bulk strut thickness. This should have been one of the major contributions for increased strength profile with decrease in porosity.
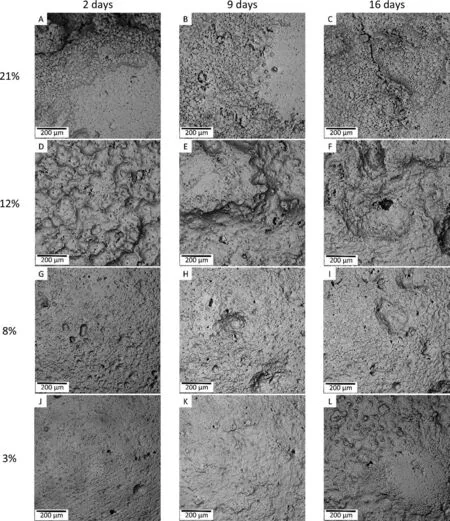
Fig. 11. Degraded surface morphologies of Mg-0.6Ca specimens with varying porosities after chromic acid treatment at different immersion durations.
Additionally, the recorded UTS and elongation to failure for specimens possessing porosity 3%and 6%are comparable to extruded Mg-0.6Ca specimens with zero porosity[60].The tensile strength of hot extruded Mg-0.54Ca is reported around 170-180MPa but with weaker elongation to failure values of around 3%. In present work, the enhanced elongation to failure values of 7-8%can be attributed to the homogenous alloy microstructure as shown in Fig. 5 with no effect from texture which is otherwise present in extruded specimens. The presence of oxides and Mg2Ca precipitates at the grain boundariesare seen at all sintering temperatures. Since the oxides are inert and brittle in nature and no grain growth is observed in the sintered specimens, this would mean a high particle pinning area per unit volume of the grain boundary. The enhanced mechanical properties can further be attributed to this particle pinning effect customary to sintered Mg alloys [26].
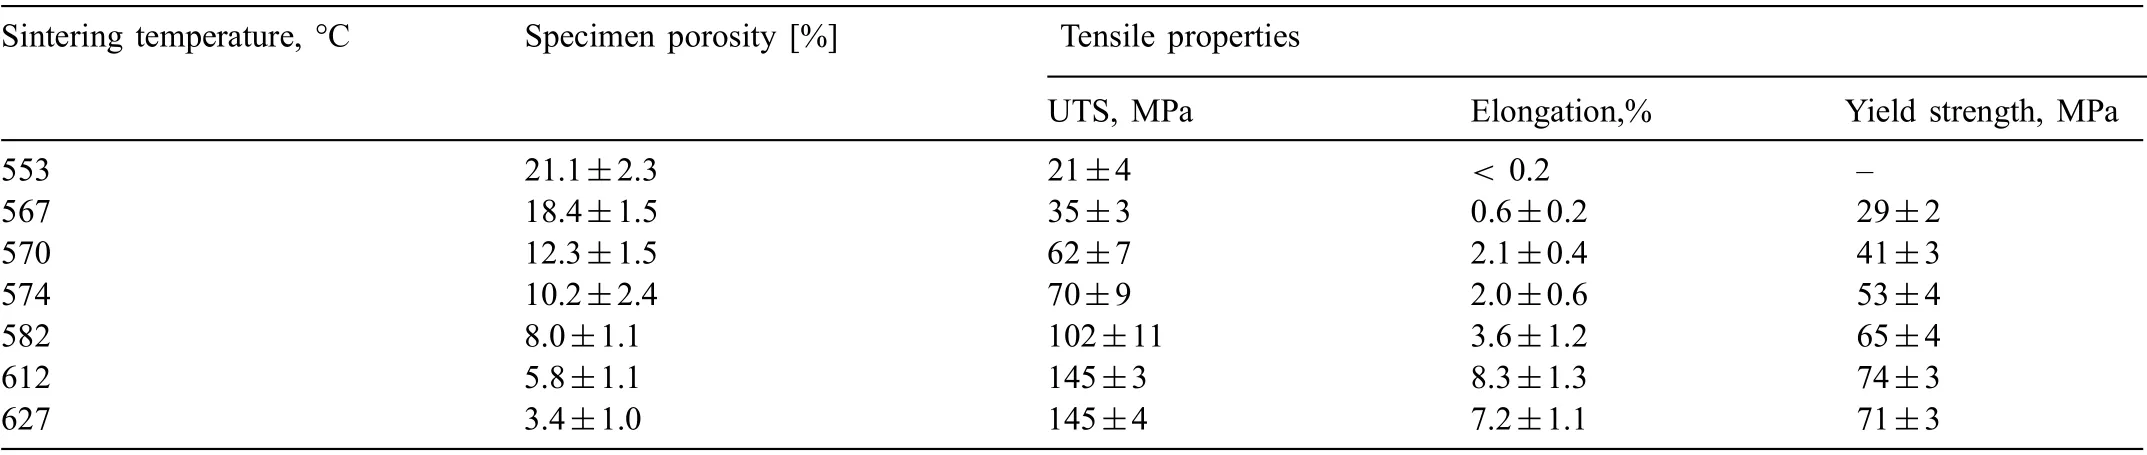
Table 4 Tensile strength and elongation to fracture values (n=5) recorded for Mg-0.6Ca specimens with varying porosities in their as sintered condition prior to immersion degradation test.
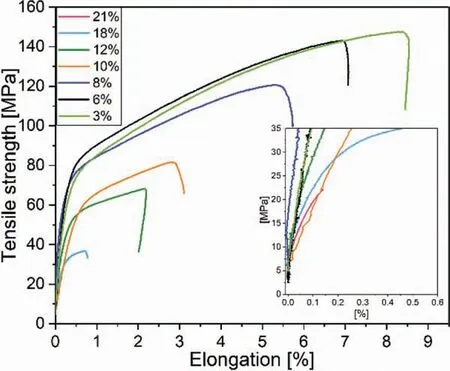
Fig. 12. Representative tensile curves for Mg-0.6Ca specimens with varying porosities.
The compressive strength of human cancellous bone is reported to be 2-80MPa with pore sizes ranging up to 300μm.Highest osteoblast proliferation was reported in collagenbased scaffolds with mean pore size of greater than 300μm[61]. The threshold pore throat size, though material dependent, suitable for tissue ingrowth is reported to be nearly 52μm in porous titanium constructs [62]. Effective bone ingrowth was reported at pore sizes of 20μm in HA based scaffolds [63]. In addition, different cell migrations and cellcell interactions might require a complex mix of pore size,cell type dependent compatibility and permeability of scaffolds [64]. Many of such literature indicate that experiments are to be designed for specifi target application with customized pore sizes and required strengths of materials. In the present work, the tensile strengths recorded for porous Mg-0.6Ca specimens are in the range of the human cancellous bone. Furthermore, the variation in mechanical properties with varying porosity implies material suitability for a broader range of applications. Mg-0.6Ca specimens with <12% porosity can be promoted for load bearing implant applications where only slight variation in degradation rates are desired. Specimens with 12% porosity showed positive traits of degradation reproducibility and optimal mechanical properties. Possessing surface open pores of about 55%, they can be further improved for use in applications where high material release is required with less demanding mechanical properties. The highly interconnected pore structures with acceptable degradation rates, though not homogenous, and amendable mechanical properties in range of cancellous bone (i.e.,specimens with 18% and 21% porosities) can be exploited further to produce altered or uniform pore sizes to test for their general applicability as scaffold materials.
4. Conclusions
In the present work, Mg-0.6Ca specimens with seven different porosities were fabricated through PM technique.Specimen porosities ranging from 3% to 21% with both open and closed pore structures were tested for their degradation behavior and mechanical properties. The results are related to the morphological pore parameters quantifie by ex situ μCT analysis. The main finding of the work are as follows:
A) As expected, increasing sintering temperature leads to a decrease in the porosity of Mg-0.6Ca specimens. Formation of numerous closed pores starts at sintering temperatures nearing 570°C. This is due to a high liquid phase fraction present during sintering, leading to 12%specimen porosity after sintering.
B) Pore interconnectivity is the important factor controlling homogenous degradation in porous Mg-0.6Ca specimens. Specimens with porosities 18% and 21% exhibited pore interconnectivities >95% and showed a nonhomogeneous degradation compared to the specimens with porosities ≤10% having pore interconnectivities<10%.
C) Pore size and curvature distributions revealed that sintering temperatures ≥570°C, i.e. specimen porosities≤12%, result in the formation of small pore sizes with spherical morphologies. It is also inferred that shape effect of the large pores on degradation is not significant as this largest volume contributes to <10% of the total investigated pore volume. In view of degradation, surface open pores are more detrimental upon direct exposure to cell culture medium.
D) Mg-0.6Ca specimens possessing porosities ≤10% exhibited homogenous degradation with mean degradation rates <0.3mm/year. In combination with mechanical properties ranging between 70 and 145MPa tensile strength and 2-8% elongation to failure, these specimens open the possibilities for applications where varied degradation rates with sufficien load bearing capabilities are demanding. The threshold porosity in view of achieving a reproducible degradation in PM Mg-0.6Ca specimens is established to be 12% due to low scatter in their mean degradation depth values over 16 days immersion test.
E) In view of scaffold material fabrication, the sintering response of Mg-0.6Ca alloy employed in present work proves fl xible in obtaining controlled pore geometries with sufficien bulk Mg strength. This may also provide opportunity to explore the degradation mechanism governing inside the pores.
Declaration of Competing Interest
None.
Acknowledgments
The authors greatly acknowledge the laboratory support offered by Ms. Monika Luczak and Ms. Anke Schuster during the course of this work. The research leading to these results has received funding from the Helmholtz Virtual Institute “In vivo studies of biodegradable magnesium based implant materials (MetBioMat)” under grant agreement no. VH-VI-523.
杂志排行

Journal of Magnesium and Alloys的其它文章
- Mechanism of Mn on inhibiting Fe-caused magnesium corrosion
- Investigating TiO2-HA-PCL hybrid coating as an efficien corrosion resistant barrier of ZM21 Mg alloy✩
- Effect of yttrium modificatio on the corrosion behavior of AZ63 magnesium alloy in sodium chloride solution
- Effect of lithium content on the mechanical and corrosion behaviors of HCP binary Mg-Li alloys
- Poly caprolactone/titanium dioxide nanofibe coating on AM50 alloy for biomedical application
- New design principles for the bath towards chromate- and crack-free conversion coatings on magnesium alloys