Mechanism of Mn on inhibiting Fe-caused magnesium corrosion
2021-05-21LiYngShouzhnChoYngXiorongZhouXiopngLuYuningHung
Li Yng, Shouzhn H, Cho Yng, Xiorong Zhou, Xiopng Lu, Yuning Hung,
Gaowu Qinb, Erlin Zhanga,**
a Key Laboratory for Anisotropy and Texture of Materials, Education Ministry of China, School of Materials Science and Engineering, Northeastern University, Shenyang 110819, China
b State Key Laboratory of Rolling and Automation, Northeastern University, Shenyang 110819, China
c Corrosion and Protection Centre, School of Materials, The University of Manchester, Manchester M13 9PL, England, UK
d Shenyang National Laboratory for Materials Science, Northeastern University, 3-11 Wenhua Road, Shenyang 110819, China
e Institute of Materials Research, Helmholtz Zentrum Geesthacht, Max-Planck-Str. 1, D-21502 Geesthacht, Germany
Received 16 April 2020; received in revised form 14 September 2020; accepted 25 September 2020
Available online 16 November 2020
Abstract
Keywords: Magnesium alloy; Impurity Fe; Mn phase; Corrosion; Cathodic activation.
1. Introduction
Magnesium is attractive for applications as structural materials due to the high specifi strength. Mg also received extensive attention for its application as bio-resorbable implant materials due to the good biocompatibility and relatively high strength to polymers [1-3]. However, the poor corrosion resistance of a common Mg in aqueous environment is a key issue, which has received much attention [1,4-11].
The corrosion of commercial Mg and Mg alloys is mainly affected by micro-galvanic corrosion in aqueous condition.The cathodic reaction is mainly hydrogen evolution reaction(HER) which dominates the oxygen reduction since the equilibrium potential of Mg oxidation is significantl more negative than the equilibrium potential for hydrogen evolution. Although the reactivity of Mg is high, Mg inherently is a poor cathode with low exchange current density for HER compared to other metals.The corrosion rate is comparatively low for ultra-high purity Mg [12-14]. However, the corrosion rate increases significantl when Mg contains certain amount of critical impurities, such as Fe, Ni, Cu or Co [15-18].This is because corrosion potentials of these impurities are much higher than that of Mg and the high exchange current density for hydrogen redox reactions on these impurities [15].Fe, a common impurity in Mg, is generally present in Mgingot [19]. Fe can also be introduced into Mg alloys during production processes using steel melting pots and tools [20].Thus, it is very difficul to avoid the contamination of Fe in Mg during an industrial production. In commercial pure Mg, a small amount of Fe (about 10-100ppm) is always contained in, which can significantl accelerate corrosion of Mg [13,21-25]. Thus, it is important to reduce the deleterious effect of Fe on the corrosion property of Mg.

Table 1 Composition of magnesium alloys studied in the present work (wt.%).
Surface treatment can improve corrosion resistance of magnesium alloys [26-29]. However, to improve the corrosion resistance of base alloy, alloying is a promising way.Alloying with Mn is reported to be an effective way to reduce the deleterious role of Fe on Mg corrosion property[30-33] by either forming Mn-Fe intermetallic compound phase [33] or forming an encapsulating layer around Fe-rich particles [34]. The Mn-Fe compound is proposed to be have less micro-galvanic corrosion with magnesium than Fe-rich particles, leading to the improvement of corrosion resistance of Mg [33,34]. However, it is not yet clear what is the detailed electrochemical behaviour of Mn-Fe phase and How does the compositional and structural change of Mn-Fe phase during corrosion. The further understanding of the mechanism could be benefi for exploring the better way in controlling the effect of Fe on Mg corrosion.
Therefore, the present work investigates role of Mn-Fe compound in the corrosion of a Mg-6Mn alloy by characterizing the electrochemical behaviour and the morphological,compositional and structural change of Mn-Fe phase during corrosion in 0.6M NaCl, in order to further understand the mechanism that Mn inhibits the deleterious effect of Fe on Mg corrosion.
2. Experimental procedures
2.1. Materials and microstructure characterization
Mg-6Mn alloy was selected in the present study since it has relatively large Mn-rich phase which can be helpful for the study. Mg-6Mn alloy ingot was supplied by Hunan Institute of Rare Earth Research. Ingot of pure Mg was sourced from Magnesium Elektron,UK.The materials studied were all in as-cast condition. The composition was measured with optical emission spectroscopy (Spectrolab M9 Kleve),as listed in Table 1. Pure Mn (99.9%) was also used as an electrode. Specimens were prepared by mechanical grinding and polishing for microstructural investigation.Microstructure was characterized using scanning electron microscopy (SEM)on a JSM-6510A instrument equipped with energy dispersive X-ray spectroscopy (EDS).
2.2. Weight loss test
The dimensions of specimens for weight loss test are 10mm×10mm×10mm. They were prepared by grinding each side to emery paper of 2000 grit. The specimens were immersed in 0.6M NaCl solution for 48 h at room temperature. Then corrosion products on specimens were cleaned by immersion of the corroded specimens into chromic acid(100g/l) for about 20-30min at room temperature. The following equation was used for calculating corrosion rate(mm/year) [33]:

In Eq. (1), Δg is loss of weight (g), A is area of surface(cm2), t is time of immersion (h) and ρ is material density(g·cm-3). Three specimens for each material were measured.
2.3. Electrochemical tests
Specimens used in electrochemical tests were prepared by mounting in resin with copper wire connected and then mechanically grinding to 2000 grit SiC papers. A classical three electrode cell,with a Mg specimen as the working electrode,a saturated calomel electrode(SCE)as reference and a platinum plate as counter electrode.A Versa STAT V3-400 potentiostat(Ametek, USA) was used. The 0.6M NaCl solution was used as corrosion electrolyte.In-situ optical images of surface morphology of specimens were taken with a camera controlled by computer. Linear polarization resistance was measured by polarizing from -10mV to+10mV vs. Ecorrat a scan rate of 0.5mV/s. The scan rate was 1mV/s for potentiodynamic polarization test.
2.4. Corroded surface characterization
The corroded surface of Mg-6Mn alloy was characterized using SEM (JSM-6510A) with EDS. The cross section of the corroded surface was prepared using focus ion beam (Helios G4, USA) and was investigated using a transmission electron microscope (JEM-2100F) equipped with EDS, operated at 200kV.
3. Results
3.1. Distribution of second phase particles
Fig. 1 shows the SEM images of second phase particles in pure Mg and Mg-6Mn alloy. The size of particles in pure Mg is always below 350nm [22]. In the Mg-6Mn alloy, the size of the particles is in the range of 3-30μm, while most of them are approximately 10μm. The particles in the Mg-6Mn alloy are Mn-rich particles with very small amount of Fe and Si, as revealed by EDS analysis (Table 2). Sometimes, the Fe or Si can not be detected in the Mn-rich particles as their content could be below the detection limit of EDS. The Mn and Fe distribute homogeneously in the Mn (Fe) particles, as shown by the EDS map (Fig. 1d and e).

Fig. 1. SEM images of second phase particles in pure Mg and Mg-6Mn alloy: (a) Fe-rich particles in pure Mg [13]; (b) Mg-6Mn alloy showing the size and distribution of Mn-rich particles; (c) a typical Mn (Fe) particle in Mg-6Mn alloy and the corresponding EDS elemental map of Mn (d) and Fe (e).

Table 2 Compositions of second phase particles in the studied Mg alloys as indicated in Fig. 1, analysed by EDS (wt.%). The “ -“ means not detected.

Table 3 Average corrosion rate of pure Mg and Mg-6Mn alloy in 0.6M NaCl solution at room temperature, measured by weight loss.
3.2. Corrosion behaviour
The average corrosion rate of pure Mg and Mg-6Mn alloy in 0.6M NaCl solution at room temperature was measured by weight loss after immersion for 48h, as listed in Table 3.The corrosion rate of Mg-6Mn alloy (0.73mm/year) is significantly lower than that of pure Mg (1.98mm/year), although the Fe content is Mg-6Mn alloy is about 10 times higher than that in the pure Mg studied. This clearly indicates the role of Mn in inhibiting Fe-caused corrosion in Mg.
To fin out the link between open circuit potential and instantaneous corrosion resistance, linear polarization resistance was measured every hour during the measurement of open corrosion potential, as shown in Fig. 2. Both of the open circuit potential and polarization resistance of pure Mg increase with increased immersion time up to 7h, then, decrease sharply and stabilizes at about -1.65 VSCEand about 500 ohms cm2, respectively(Fig. 2). The open circuit potential of Mg-6Mn alloy increases initially and decreases with increased immersion time up to 4 h and,then,stabilizes at about-1.75 VSCE. The polarization resistance of Mg-6Mn alloy generally increases with increased immersion time (Fig. 2).
The in-situ optical images of the corroded surface is recorded during the open circuit potential and linear polarization resistance measurement, as displayed in Fig. 3. The initiation of localized corrosion on pure Mg was observed after immersion for about 7h (as indicated by the red arrow), which coincides with the drop of corrosion resistance and open circuit potential as reported before [13] (Figs. 2 and 3). Corrosion developed significantl then after. For Mg-6Mn alloy, hydrogen bubbles and some black spots were observed clearly on the surface. It should be stated that the black spots are Mn particles with the coverage of corrosion products, which will be revealed by SEM in the next section.However, there is no evidence of localized corrosion or localized hydrogen stream,indicating that no breakdown of surface fil occurs on Mg-6Mn alloys even after immersion for 48 h(Fig. 3). This is also consistent with the electrochemical behaviour that shows no obvious drop of open circuit potential or corrosion resistance (Fig. 2).

Fig. 2. Open circuit potential (a) and polarization resistance (b) of pure Mg and Mg-6Mn alloy as a function of immersion time in 0.6M NaCl solution. The open circuit potential of pure Mg is cited from reference [13].
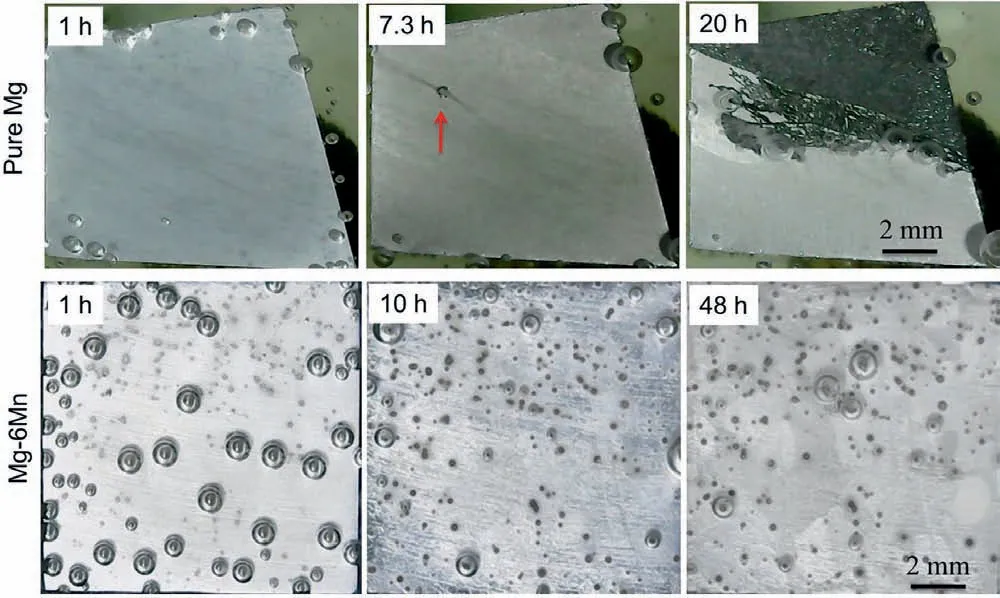
Fig. 3. In-situ optical images showing macro corrosion morphology of the pure Mg [13] and Mg-6Mn alloy during the OCP measurement shown in Fig. 2.
In order to study the effect of corrosion process on the cathodic and anodic activity of the alloys, potentiodynamic polarization were conducted on specimens after immersion in 0.6M NaCl for different time duration (Fig. 4). Cathodic and anodic polarization were carried out separately. The cathodic current density at the same applied potential is different for the specimens with different immersion time, indicating changing of cathodic activity. The cathodic activity enhances significantl with increased immersion time for pure Mg(Fig. 4a), while it decreases with increased immersion time from 10min to 180min and then remain unchanged for Mg-6Mn (Fig. 4b). The cathodic activity of pure Mg and Mg-6Mn after immersion for the same time is compared.The cathodic activity of pure Mg is much lower than that of Mg-6Mn alloy after immersion for 10min(Fig.4c).However,the cathodic activity of pure Mg becomes much higher than that of Mg-6Mn after immersion for 1200min (Fig. 4d). The anodic activity decreases with increased immersion time for both pure Mg and Mg-6Mn before the occurence of localized corrosion (Fig. 3). Generally, the anodic activity of Mg-6Mn alloy is only slightly lower than that of pure Mg. Therefore,the open circuit potential and corrosion rate are mainly controlled by the cathodic activity for pure Mg and Mg-6Mn.
3.3. Hydrogen reduction
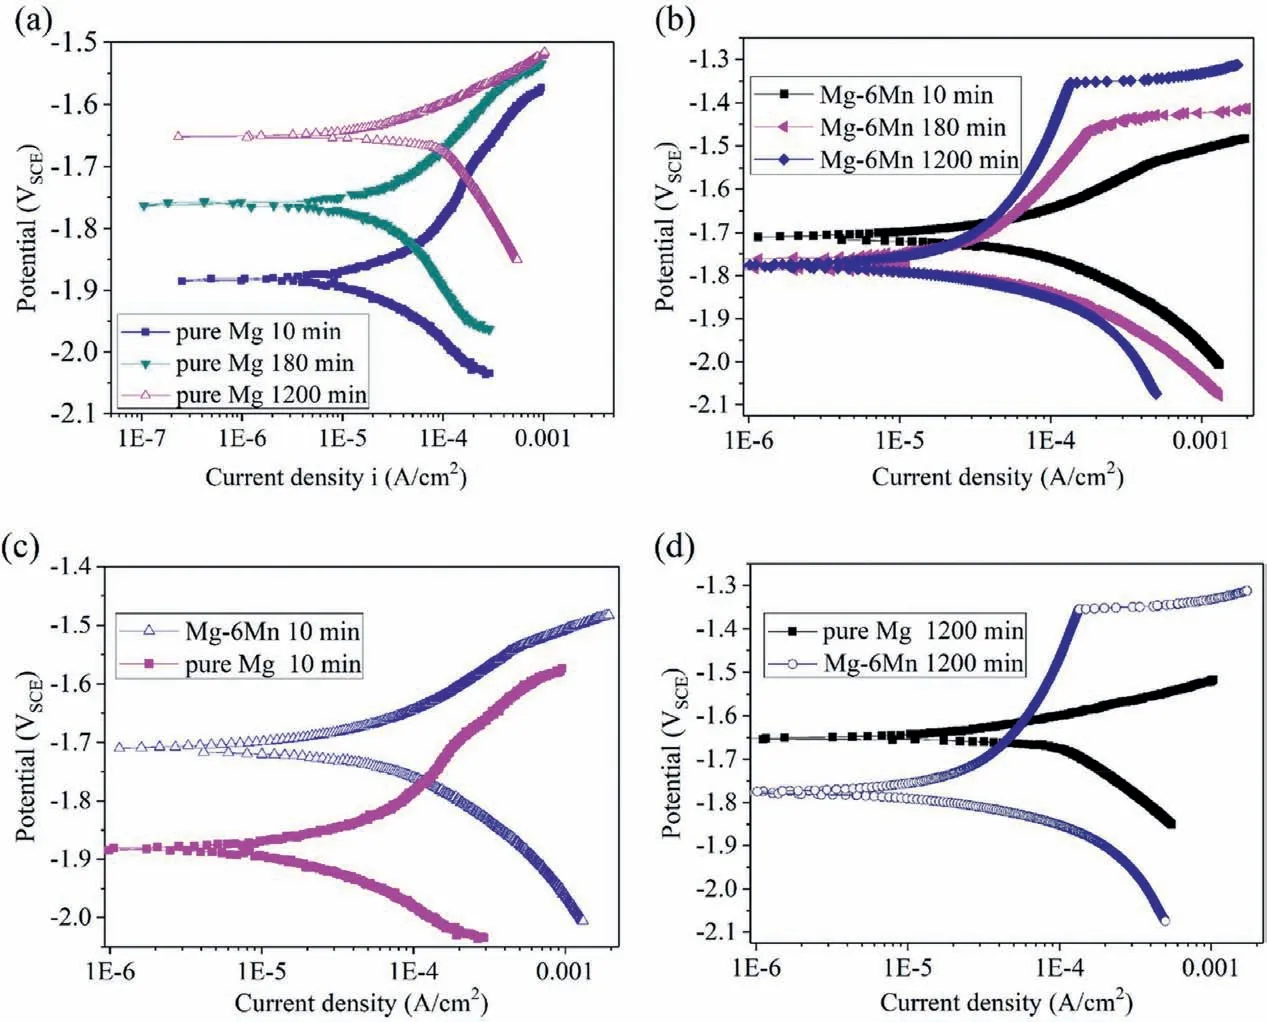
Fig. 4. Potentialdynamic polarization curves of pure Mg and Mg-6Mn alloy after immersion in 0.6M NaCl solution for different time, showing the change of cathodic and anodic activity with increased immersion time: (a) pure Mg after immersion for 10min, 180min and 1200min [13]; (b) Mg-Mn after immersion for 10min, 180min and 1200min; (c) comparision between pure Mg and Mg-6Mn after immersion for 10min; (d) comparision between pure Mg and Mg-6Mn after immersion for 1200min.
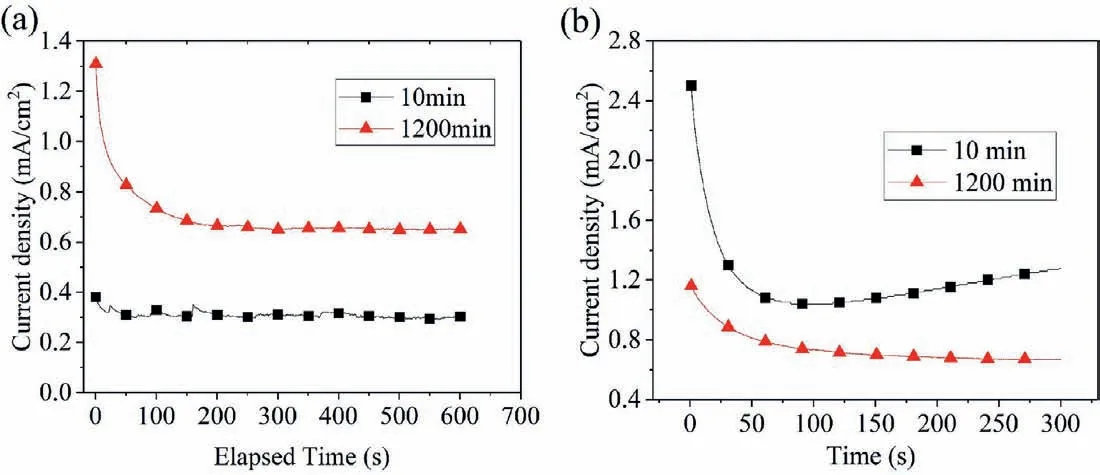
Fig. 5. Cathodic current density of pure Mg (a) and Mg-6Mn alloy (b) potentiostaticly polarized at -2 VSCE after immersion in 0.6M NaCl solution for 10min and 1200min.

Fig. 6. In-situ optical images of pure Mg and Mg-6Mn alloy when potentiostaticly polarized at -2 VSCE in 0.6M NaCl solution after immersion for 10min and 1200 min: (a) pure Mg after immersion for 10min; (b) pure Mg after immersion for 1200min; (c) Mg-6Mn alloy after immersion for 10min;(d) Mg-6Mn alloy after immersion for 1200min.
In order to gain further insight into the change in the cathodic activity of pure Mg and Mg-6Mn alloy during corrosion,potentiostatic polarization at-2 VSCEwas performed on pure Mg and Mg-6Mn alloy after immersion in 0.6M NaCl for 10 and 1200min, with in-situ optical images of alloy surface being recorded (Figs. 5 and 6). The selection of -2 VSCEas the polarization potential is because the difference in hydrogen evolution between the specimens of different immersion times is sufficientl large to be clearly differentiated by in situ optical images at this potential. For pure Mg after immersion for 1200min, the cathodic current density is about 2-3 times of that after immersion for 10min, as shown in Fig. 5a, indicating that the hydrogen reduction ability of pure Mg increases with immersion time. This is consistent with the observation from the in situ optical image monitoring, as displayed in Fig. 6a and b. For the specimen with 10min immersion, strong hydrogen streams are evident at some locations where Fe-rich particles are likely to be present, as indicated by arrows (Fig. 6a); in addition, many bubbles attached to the specimen surface are also observed, which grow slowly during the polarization at -2 VSCE.For the pure Mg specimen with 1200min immersion,significantl more hydrogen streams are evident, as marked with arrows in Fig. 6b.On the contrary, for the Mg-6Mn alloy after immersion for 1200min, the cathodic current at -2 VSCEis about 30% -50% of that after immersion for 10min, as shown in Fig. 5b,indicating that the hydrogen reduction ability of Mg-6Mn alloy decreases with immersion time.The corresponding optical images are displayed in Fig. 6c and d. After immersion for 10min, the hydrogen stream is very strong at many locations(Fig. 6c), where Mn (Fe) particles are likely to be present.The strength of hydrogen stream reduces evidently after immersion for 1200min (Fig. 6d).

Fig. 7. Quasi-in-situ SEM images of Mg-6Mn alloy: (a) typical Mn (Fe) particles in as-polished Mg-6Mn alloy; (b) Mn (Fe) particles covered by corrosion products after immersion in 0.6M NaCl solution for 1h; (c and d) magnifie images of Mn (Fe) particles.

Fig. 8. (a) SEM Morphology of a Mn (Fe) particle covered by corrosion products after immersion in 0.6M NaCl solution for 20h; (b) SEM morphology of the cross section of the Mn(Fe) particle prepared by focus ion beam;(c) TEM morphology of the area indicated by arrows in (b); (d) composition of different regions analysed by EDS in at%.
In order to understand why hydrogen reduction ability of Mg-6Mn alloy decreases after immersion in 0.6M NaCl,the microstructrual evolution of Mn (Fe) particles during corrosion was characterized. The typical Mn (Fe) particles,confirme by EDS analysis, in the as-polished Mg-6Mn alloy are shown in Fig. 7a. These Mn (Fe) particles are evidently covered by corrosion products after immersion in 0.6M NaCl for 1h (Fig. 7b, c and d). The corrosion products mainly contain O, Mg and Mn elements, analysed by EDS at point A in Fig. 7d. After immersion for 20h, large amount of corrosion products can be observed on the Mn (Fe) particles,as shown in Fig. 8a. These Mn (Fe) particles with the coverage of corrosion products are the black spots observed in Fig. 3 for Mg-6Mn alloy. The cross section morphology shows the thickness of corrosion products after immersion for 20h can reach 20-30μm (Fig. 8b). The particle is confirme to be Mn(Fe) particle by EDS, containing about 97.9 wt% Mn and 2.1 wt% Fe when Mg and O are not considered. EDS analysis on the outer corrosion film as indicated by point A in Fig. 8b, was carried out. It shows the outer corrosion fil is composed of Mg and O, close to the composition of Mg(OH)2, as shown in Fig. 8d. To further examine the inner corrosion film TEM specimen is prepared and observed. TEM morphology of the area indicated by arrow in Fig. 8b is presented in Fig. 8c. The corrosion fil is relatively dense. The EDS analysis shows the inner corrosion fil is composed of O, Mg, Mn and Cl, as listed in Fig. 8d.
Further, in order to determine how the cathodic activity of the Mn(Fe)particles in Mg-6Mn alloy changes during immersion in 0.6M NaCl, pure Mn was polarized potentiostaticly at about -1.75VSCEin 0.6M NaCl (the corrosion potential of Mg-6Mn alloy), simulating the conditons at Mn (Fe) particles in Mg-6Mn alloy during immersion in 0.6M NaCl. The current density-time response was recorded, as shown in Fig. 9.The cathodic current density increases initially then decreases with increased polarization time (Fig. 9a). Although pure Mn is cathodic polarized, oxidation of Mn can still occur, resulting in brown corrosion products, as shown by the inset in Fig. 9a. Thus, it can be suggested that Mn-rich Mn (Fe)particles in Mg-6Mn alloy, even as the preferred sites for hydrogen reduction during corrosion of Mg-Mn alloys, can be oxidized to form corrosion products.
4. Discussion
4.1. Formation of Mn (Fe) phase
Based on Mg-Mn binary phase diagram [35], primary pure Mn phase can form from melt during solidificatio when Mn content is higher than 2 wt%. Mn and Fe can be incorporated to form Mn-Fe solid solution in any proportion [36]. The mixed entropy of Fe/Mn and Fe/Mg is 0 and 18, respectively[37]. As a result, when Mn phase forms from the melt, Fe is incorporated into the Mn phase as solid solute (Fig. 1e).This is consistent with most of the Mn-Fe phase reported in literatures [33,34,38]. However, if Fe content is sufficientl high to precipitate before the formation of primary pure Mn phase, a Mn-rich encapsulating layer could form around large Fe-rich particles [34].
4.2. Corrosion behaviour
The average corrosion rate of Mg-6Mn alloy is about one third of that for pure Mg after immersion in 0.6M NaCl solution for 48h. However, the corrosion rate of Mg-6Mn is even higher than that of pure Mg in the firs several hours(Fig.2b).The critical turning point for pure Mg is the breakdown of corrosion fil due to the corrosion potential increasing to the fil breakdown potential (about -1.63 VSCE), after which corrosion rate increases significantl as discussed in details in the authors’previous work[13].For Mg-6Mn alloy,the corrosion potential increases initially to about -1.7 VSCEthen decreases to and maintains at about -1.75 VSCEwhich is lower than the fil breakdown potential (about -1.63 VSCE). Thus,no fil breakdown occurs for Mg-6Mn alloy and the polarization resistance increases with increased immersion time.
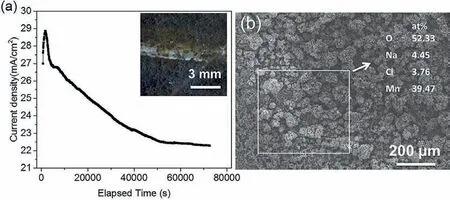
Fig. 9. (a) Potentiostatic polarization curves of pure Mn at -1.75 VSCE (the corrosion potential of Mg-6Mn alloy) in 0.6M NaCl solution, simulating the cathodic reaction behaviour of Mn (Fe) particles in Mg-Mn alloy; (b) surface morphology and composition (measured by EDS) of the pure Mn after potentiostatic polarization, showing the occurrence of corrosion of pure Mn even under cathodic polarization at examine.
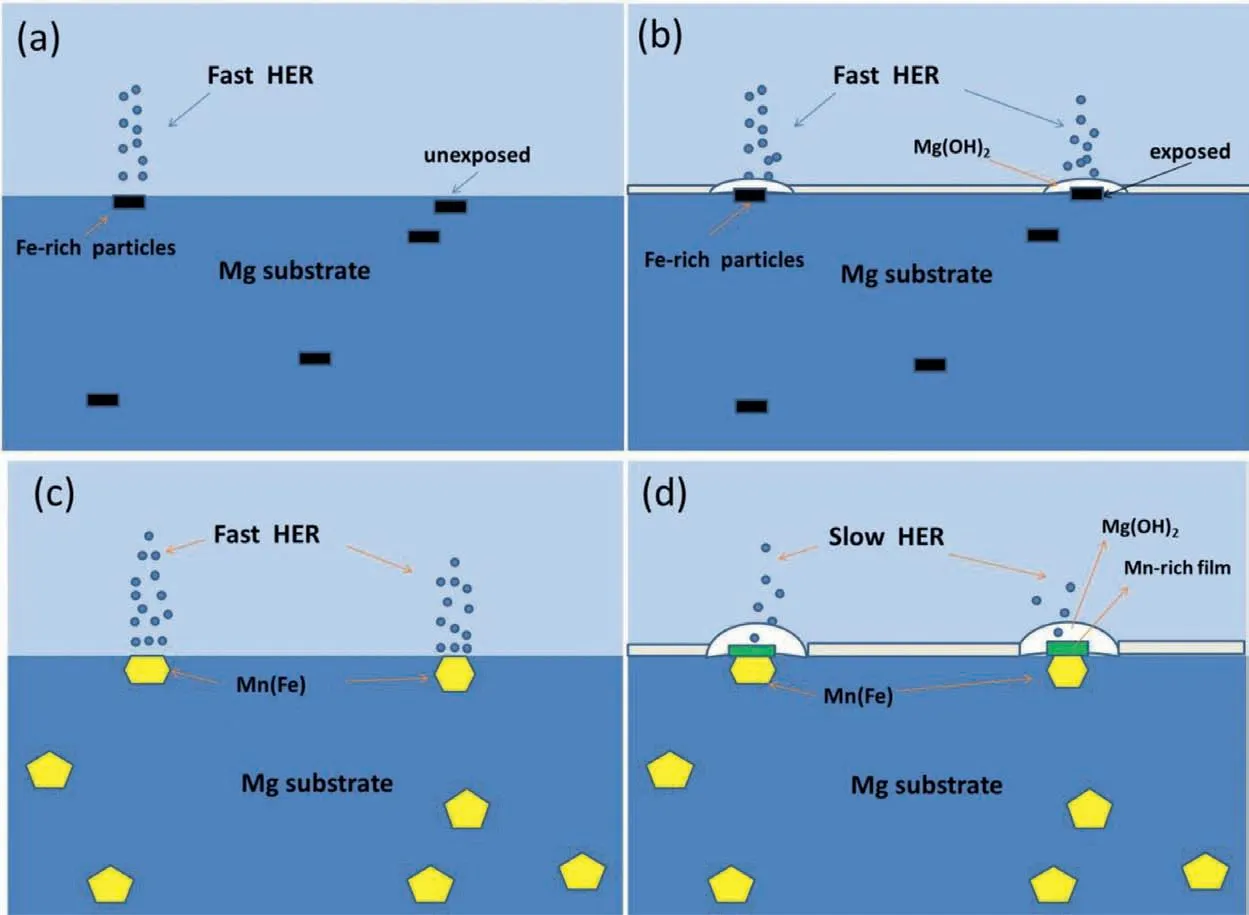
Fig. 10. Schematic diagram of the cathodic activation of pure Mg and cathodic inhibition of Mg-6Mn alloy: (a) initial corrosion of pure Mg; (b) corrosion of pure Mg after initiation for a period; (c) initial corrosion of Mg-6Mn alloy; (d) corrosion of Mg-6Mn alloy after initiation for a period.
Why does the cathodic activity increase for pure Mg with increased immersion time? The schematic diagram showing the mechanism of cathodic activity enhancement is illustrated in Fig. 10a and b. In pure Mg, Fe-rich particles are the preferred locations for HER (Fig. 10a). Based on E-pH diagram[39], Fe, acting as cathodic sites in pure Mg at a potential of about -1.65 VSCE, is immune of corrosion. The strong cathodic hydrogen reduction at the surface of Fe-rich particles leads to high alkalinity locally, which results in preferred deposition and accumulation of Mg(OH)2on top of Fe-rich particles as reported in our previous work [13] (Fig. 10b).The porous Mg(OH)2corrosion fil itself is not a good passive layer, which does not effectively inhibit HER on Fe.Salleh et al. [40] compared the cathodic hydrogen reduction behaviour of pure Fe with and without deposited Mg(OH)2.They found no difference. Further, Mg matrix dissolves with the corrosion proceeding, which leading to more Fe-rich second phase particles exposed to electrolyte (Figs. 6b and 10b). This could be one of the reasons for the enhanced cathodic activity. Additionally, it is reported that once Fe-rich particles detach from Mg substrate, they dissolves [21]. Then the dissolved Fe could redeposit on Mg to form Fe-rich layer, which enhances the cathodic activity [41-44].
Why does the cathodic activity decrease for Mg-6Mn alloy with increased immersion time? Flake like morphology of the magnesium hydroxide on corroded area of the surface can be seen in Fig. 7(c), (d) and 8(a). As we know, the magnesium hydroxide is not dense,which plays little role in inhibiting the penetration of electrolyte [3]. Thus, it cannot inhibit the cathodic activity of Mn(Fe)particles.The schematic diagram of the cathodic inhibition behaviour of Mn (Fe) phase is shown in Fig. 10c and d. In the Mg-Mn alloy, Mn (Fe) particles are the preferred locations for HER during the corrosion process of Mg-6Mn alloy in NaCl solution (Fig. 10c). The local pH at the surface of Mn (Fe) particles is high since hydrogen reduction occurs rapidly, as indicated by the high cathodic current at the OCP of Mg-6Mn alloy (Fig. 9). Based on the E-pH diagram of Mn [39], Mn can be oxidized if the pH value reaches 12-14 at -1.75 VSCE(-1.51 VSHE), i.e. OCP of Mg-6Mn alloy.This is further experimentally confirme by potentiostatic polarization of pure Mn at -1.75 VSCE(Fig. 9).Therefore, the oxidation of Mn also occurs on the surface of Mn (Fe) particles during corrosion. At mean time, the diffusion and precipitation of Mg corrosion products is occurring.As a result, a relatively dense Mn-rich corrosion fil forms on the surface of Mn (Fe) particles (Fig. 8c and d). This corrosion fil separates the Mn (Fe) particle from the electrolyte and, consequently, inhibits HER (Fig. 10d).
5. Conclusions
To further understand the mechanism of Mn on inhibiting Fe-caused Mg corrosion, the present work investigates the electrochemical behaviour, the morphological variation and structural change of Mn (Fe) phase in Mg-6Mn alloy during corrosion in 0.6M NaCl.The following conclusions are made.
1. Fe is incorporated into Mn phase particles in Mg-6Mn alloy, forming Mn (Fe) particles with small amount of Fe in solid solution.
2. The initial galvanic corrosion cannot be reduced through converting Fe-rich phase to Mn (Fe) phase, since Mn (Fe)phase also has relatively strong cathodic activity and has much larger volume fraction than Fe-rich phase.
3. The cathodic activation behaviour of pure Mg is inhibited in Mg-Mn alloy via forming Mn (Fe) phase, which is possibly due to that the Mn (Fe) phase inhibit the redeposition of Fe to magnesium surface. Moreover, the cathodic activity even decreases for Mg-6Mn alloy with increased exposure time, due to the reduced cathodic HER at the Mn(Fe) particles.
4. Mn can be oxidized at the OCP of Mg-6Mn alloy, resulting in relatively dense Mn-rich corrosion fil on particle surface, which separates the particle from the electrolyte and, consequently, inhibits HER.
5. The reduced cathodic activity lowers the OCP of Mg-6Mn alloy to values below the breakdown potential of corrosion film Consequently, the corrosion rate of Mg-6Mn alloy is low due to the relatively low cathodic activity and the intact surface fil on Mg matrix.
Data availability statement
The authors confir that all the research data that supports this article can be found within this article.
Declaration of Competing Interest
The authors declare that they have no known competing financia interests or personal relationships that could have appeared to influenc the work reported in this paper.
Acknowledgments
The authors acknowledge the financia support by the National Nature Science Foundation of China (No. 51601036 and U1737102), the Fundamental Research Funds for the Central Universities (N170204010 and N162410002-2-4)and Young Elite Scientists Sponsorship Program by CAST(2017QNRC001). Technical help from Guangkun Liu is appreciated.
杂志排行
Journal of Magnesium and Alloys的其它文章
- Investigating TiO2-HA-PCL hybrid coating as an efficien corrosion resistant barrier of ZM21 Mg alloy✩
- Effect of yttrium modificatio on the corrosion behavior of AZ63 magnesium alloy in sodium chloride solution
- Effect of lithium content on the mechanical and corrosion behaviors of HCP binary Mg-Li alloys
- Poly caprolactone/titanium dioxide nanofibe coating on AM50 alloy for biomedical application
- New design principles for the bath towards chromate- and crack-free conversion coatings on magnesium alloys
- Pore characterization of PM Mg-0.6Ca alloy and its degradation behavior under physiological conditions
