Effect of yttrium modificatio on the corrosion behavior of AZ63 magnesium alloy in sodium chloride solution
2021-05-21JiarunLiZhuoyuanChenJiangpingJingJianHou
Jiarun Li, Zhuoyuan Chen, Jiangping Jing, Jian Hou
a Key Laboratory of Marine Environmental Corrosion and Bio-fouling, Institute of Oceanology, Chinese Academy of Sciences, 7 Nanhai Road, Qingdao 266071, China
b State Key Laboratory for Marine Corrosion and Protection, Luoyang Ship Material Research Institute, Wenhai Road, Qingdao 266237, China
c Center for Ocean Mega-Science, Chinese Academy of Sciences, 7 Nanhai Road, Qingdao 266071, China
d Open Studio for Marine Corrosion and Protection, Pilot National Laboratory for Marine Science and Technology (Qingdao), No. 1 Wenhai Road, Qingdao 266237, China
Received 18 October 2019; received in revised form 13 February 2020; accepted 15 February 2020
Available online 5 October 2020
Abstract
Keywords: Magnesium; Yttrium alloying; Corrosion; Intermetallic phase; Oxide layer.
1. Introduction
Pure magnesium is great in lightness and abundance in nature, but its extensive adoption as structural materials at room temperature is quite limited due to its poor mechanical properties and corrosion resistance [1-3]. To date, the greatest benefit are achieved with the uses of magnesium alloys in as-cast, rolled and extruded states because some magnesium alloys perform desirable mechanical properties at higher temperature [4-6]. It is generally accepted that the formation of compact oxide film on metal surface requires a Pilling-Bedworth’s ratio (PBR) variation between 1.0 and 2.0[7], whereas the magnesium oxide as the main oxide formed on the surface of magnesium alloy with the PBR value of 0.81 [8], is insufficien to provide protectiveness to Mg matrix against corrosion. Consequently, the corrosion hampers the magnesium from being widely adopted in industrial field comparing with aluminum alloys due to its essence of electrochemical activity [9].
To promote the corrosion resistance of magnesium, alloying is one of the most popular approaches because low amounts of alloying elements bring the increases of some specifi properties without increasing substantially the total price of the material from a perspective of commercialization[10]. Of these magnesium alloys available, the most popular and commercial alloys used in automotive and structural field are Mg-Al-Zn alloys [9,11], viz. the AZ series magnesium alloys due to their good castability and high strength to weight ratio [12,13]. According to the investigation of Song et al. [14], an increase of aluminum content would effectively decrease the anodic dissolution rate as well as cathodic hydrogen evolution of Mg. Simple zinc alloying to magnesium was believed to deteriorate the corrosion resistance because it could arouse the increasing micro-galvanic corrosion by the formation of MgxZnyintermetallic phases [15]; whereas the zinc alloying to Mg-Al alloys had a dual-effect on the corrosion of magnesium alloy, viz. grain refinin and uniform dissolution [16].
A minor amount of Mn was always added into AZ series magnesium alloy aiming at decreasing the deleterious effect of impurity (e.g. Fe) on self-corrosion. Besides, the addition of element Mn to Mg matrix can also improve the mechanical properties due to the refinemen of α-Mg dendrites[17,18]. Unfortunately, traditional AZ series magnesium alloy cannot satisfy the increasing requirement of higher corrosion resistance especially for structural aspect in vehicle fiel [19].
It is well known that doping magnesium with rare earth(RE) elements can efficientl improve its mechanical properties. As a consequence, the corrosion behaviors of REcontaining magnesium alloys were investigated extensively[20]. Arrabal et al. [21] found that alloying Nd to cast AZ91 could reduce the corrosion rate in atmosphere by ~95% due to the suppressed galvanic corrosion between α-Mg and secondary phases associated with increased proportion of carbonates in the outer surface layer. Similar results were demonstrated in AZ91D and AM50 alloys with Nd and Gd additions [22]. Liu et al. [23] separately added 0.82wt.% Ce or 0.59wt.% La to AM60 magnesium alloys, the decreased corrosion rate was attributed to the new formed γ phase that can alleviated the micro-galvanic corrosion. In addition, the protectiveness of corrosion product layer was enhanced due to the enrichment of Re and Al containing oxide and hydroxide.
Yttrium has a particularly standard electrochemical potential of-2.372V,which is approximately equal to that of magnesium [24-26]. But the investigation concerning Y alloying on the corrosion behavior of AZ series magnesium alloys is quite limit. Liu et al. [25] claimed that increasing Y alloying can promote the corrosion of Mg due to the increasing amount of Y2O3in matrix. Baek et al. [27] alloyed Mg-Al-Ca with 0.25wt.% Y and concluded that Y alloying could greatly increase the corrosion resistance of Mg alloy owing to the change of Al-containing intermetallic particles, resulting in the formation of less noble Al8Mn4Y or Al2Y phases associated with a reduction in the H2evolution rate during the corrosion process. Li and Nam [28] claimed that Y alloying can improve the pitting corrosion potential of AZ61 magnesium alloy due to the increased concentration of Al in the film
A typical widely used alloy among AZ series alloys is AZ63 because of its favorable mechanical and electrochemicalproperties [29,30]. It is of great significanc to comprehensively understand the corrosion mechanism of AZ63 with Y alloying since AZ series magnesium alloy doping with Y can be actually implemented in the structural and auto-industry fields Nonetheless, the amount of Y alloying should not be too high (no more than 1.0wt.%) because some investigations had suggested that excessive Y alloying may arouse the deterioration of some mechanical properties.

Table 1 Actual chemical compositions (wt.%) of the as-received AZ63 and asprepared AZY alloys.
It is worth noting that the abovementioned works analyzed the corrosion promotion or alleviation mechanism by Y alloying, whereas the consecutive corrosion propagation especially at the initial stage of corrosion is absent or insufficient Consequently,the present work investigates the influenc of minor Y addition on the microstructure and corrosion behavior of AZ63 alloy, aiming to clarify the effect of Y alloying on the initiation and propagation of corrosion of AZ63 alloy, which is believed to provide some tentative explorations on the design of corrosion resistive magnesium alloys.
2. Material and methods
2.1. Sample preparation
The as-received AZ63 magnesium alloy was adopted as a reference alloy (purchased from Hongtai Magnesium Alloy Co. Ltd. in China). The AZ63 alloy was melted in graphite crucible in a resistance furnace at 720°C,in which the molten metal was covered with sulfur powder to prevent further oxidation in air. The yttrium element was added in the form of the Mg-30wt.%Y master alloy, which was pre-weighted and wrapped up with pure Mg foil. The molten melt was stirred intensively for 5min as soon as the Y-containing master alloy was added into. After that, a 20-min standing was carried out to ensure the bubbles in the melt had completely separated out. The chemical compositions of these Y-containing AZ63 alloys were determined using inductively coupled plasma mass spectrometry (ICP-MS, Agilent, California, CA, USA),by which the actual concentration (wt.%) of these alloys were tested and listed in Table 1. In this work, these Y-containing AZ63 alloys were donated as AZY alloys for simplicity and as such, these four kinds of Y-containing alloys were subsequently named as AZY0.25, AZY0.5, AZY0.75 and AZY1.0,respectively.
To ensure the homogeneity of the microstructure, the midsections of the as-cast billets were adopt for materials characterization and electrochemical tests.
2.2. Materials characterization
For metallographic observation, samples were ground to 2000 grits successively under water atmosphere,polished with 1μm diamond grinding paste and etched with 4% nital solution (nitric acid in ethanol) for 3s to reveal the intermetallic phases and grain boundaries.
The microstructures and corroded surfaces were detected via scanning electron microscopy (SEM; JSF-6700F)equipped with energy dispersive X-ray spectroscopy (EDS;INCA, Oxford Instruments); an X-ray photoelectron spectroscopy system (XPS; ThermoScientic ESCALAB 250Xi)and X-ray diffraction (XRD, D/Max 2550, Rigaku) with Cu Kα X-ray source were adopted to investigate the phases and compositions of matrix, corrosion products and oxide layer.
2.3. Corrosion tests
The weight loss and hydrogen evolution measurements were carried out simultaneously on the same sample for intercalibration in a baker containing 2L 3.5wt.% NaCl solution.Prior to the immersion test, a pure Mg plate (50×50mm)was immersed in the baker over 48h to make the NaCl solution saturated with H2. The specimens for immersion tests are of 50×10×3mm in size. One side (50×10mm) was successively polished to 2000 grits and ultrasonically cleaned in alcohol for 5min, then weighted and sealed with insulating tape, leaving an abraded surface exposed (5 cm2). The corrosion products generated during the immersion were removed with 200g L-1CrO3solution, ultrasonically cleaned and reweighted as soon as the immersion test was over. For hydrogen collection, an inverted funnel was placed over the electrode for leading all the gas bubbles from the specimen into a fulfille burette, which was vertically mounted over the funnel and fulfille with 3.5wt.% NaCl solution. To obtain exact results of hydrogen volume, the burette is flippe slightly in advance of every time of reading to get rid of the bubbles adhered on the inner wall. The immersion tests lasted for 48h and the hydrogen volumes were recorded once per hour.
The in situ observation of the corrosion propagation at the outset of 5h immersion of AZ63 and AZY1.0 alloys were carried out. The etched samples were pasted on the bottom of a culture dish fille with 3.5wt.% NaCl, keeping a 5mm thickness of electrolyte fil on sample surface. Before taking the photograph, the accumulated hydrogen bubbles on sample surface were blown away slightly, leaving typically corroded surface for metallographic shooting.
2.4. Electrochemical measurements
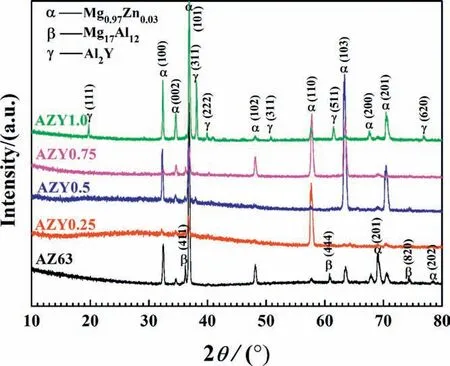
Fig. 1. XRD patterns of AZ63 and AZY (0.25, 0.5, 0.75 and 1.0) alloys obtained at a scanning rate of 4˚min-1 from 10˚to 80˚.
A conventional three-electrode cell comprising a working electrode (10mm×10mm exposed), a saturated calomel reference electrode (SCE) and a Pt plate counter electrode(20mm×20mm×1mm)were adopted to commit to the electrochemical measurements. The potentiodynamic polarization tests were carried out by sweeping the potential from the free corrosion potential of a specifi specimen toward ± 500mV orientations, respectively. The sweepings at a scanning rate of 1mV s-1were respectively conducted after 0min and 300min immersion. The Mott-Schottky is employed to determine the electronic properties of corrosion product layer in this work,where the electronic property refers to the potential dependence of the space charge capacity of a semiconductor layer under a depletion condition [31,32]. The space charge capacitance of an n-type semiconductor is given as follows,
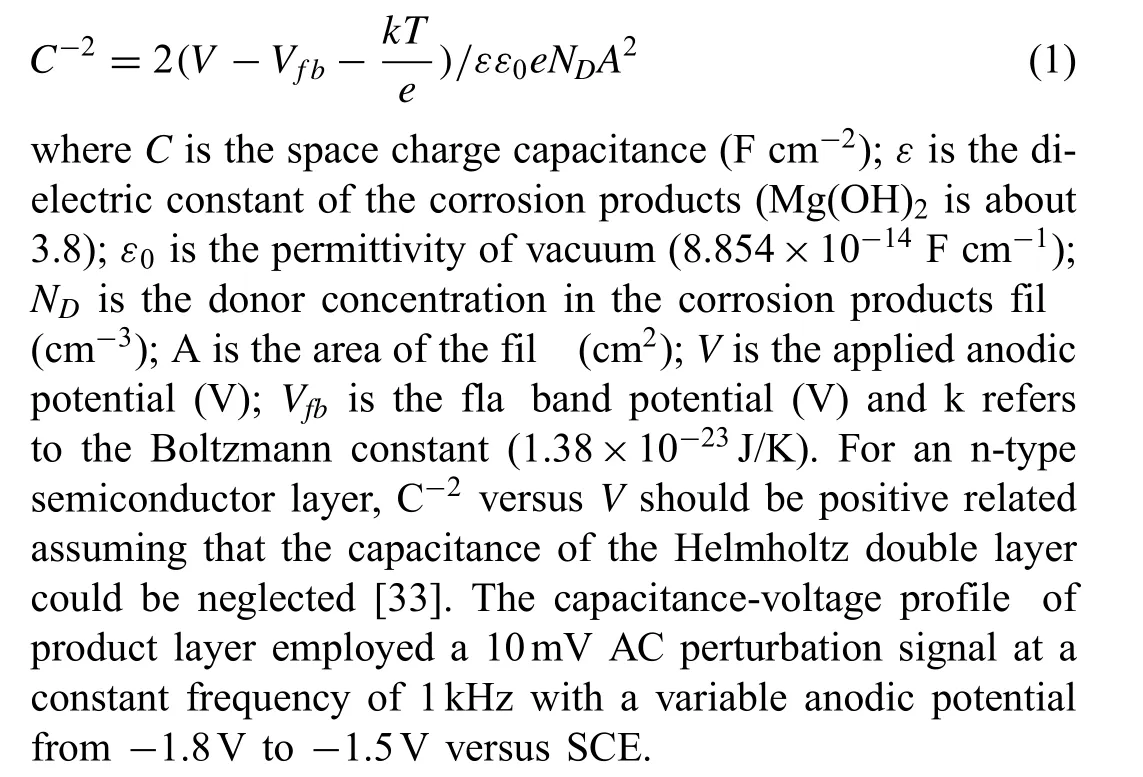
If not specified all measurements were conducted at ambient temperature in this work. The reagents used were of analytical purity class, and the electrolyte was prepared with deionized water. All the electrochemical measurements were executed 3 to 6 times depending on the reproducibility.
3. Results and discussion
3.1. Materials characterization
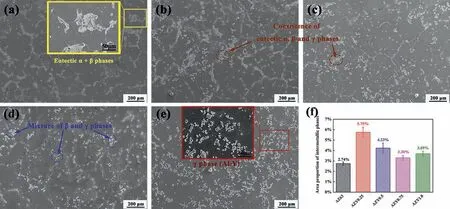
Fig. 2. SEM images of AZ63 (a); AZY0.25 (b); AZY0.5 (c); AZY0.75 (d); AZY1.0 (e) and (f) the area proportions of intermetallic phases of these alloys distributed in Fig. 2(a)~(e).
Fig. 1 presents the XRD patterns of AZ63 and AZY alloys, among which Mg0.97Zn0.03is the major phase of these magnesium alloys investigated. The AZ63 alloy comprises Mg0.97Zn0.03and β-Mg17Al12phases [34], while the intensities of the β-Mg17Al12diffraction peaks of AZY alloys descend gradually with increasing Y concentration. Some weak diffraction peaks representing γ-Al2Y phase appear when the concentration of Y increases to 0.5wt.%, whereas the intensities of γ-Al2Y peaks increase strikingly as soon as the content of Y increases to 1.0wt.%; this result is different from that of Feng’s work, in which the γ-Al2Y was not detected by XRD but speculated via atomic ratio according to the result of EPMA [35].
According to the diffraction patterns of AZY1.0, the peak intensities of β-Mg17Al12decrease remarkably by comparing with that of AZ63, indicating that the amount of β-Mg17Al12phase in Mg matrix has descended to a certain degree by Y alloying [36]. In view of the binary phase diagrams of Mg-Y [37] and Al-Y [38], element Y is absolutely immiscible in Mg. The Al2Y compound would separate out from the melt during the cooling process, leading to the presence and increase of Al2Y peaks in XRD patterns with increasing the Y concentration. In addition, it is reported that Al and Y are more apt to form composite than Mg and Y because the binding energy of Al2Y is lower than that of Mg24Y5[39,40].Based on the mass fraction of Mg, Al and Y in matrix are about 90%, 6% and 1%, respectively, the leaving Al content in Mg substrate is estimated to have dissolved in Mg in solid solution state by considering the Mg-Al binary diagram [41].
Fig. 2 shows the microstructures of AZ63 and AZY alloys.Most of intermetallic phases of AZ63 and AZY(0.25~0.75)alloys distribute along with the grain boundaries [42]. While,the intermetallic phases of AZY1.0 alloy distribute homogeneously regardless of in Mg0.97Zn0.03grains (denoted as α-Mg) or along grain boundaries [43]. Our previous work has demonstrated that the eutectic α phases always act as the corrosion initiation sites at the outset of AZ63 corrosion[34]. The amount of eutectic α phase keeps decreasing with the increase of Y concentration in Mg substrate, especial in AZY1.0 where the eutectic α phase is in the absence, indicating that the initial micro-galvanic corrosion of magnesium alloy is alleviated to some extent via Y alloying.
In Fig. 2a, the β-Mg17Al12phases are surrounded with eutectic α phases in most cases.After Y alloying,the amount of intermetallic phases notably increases by comparing Fig. 2b-2e with Fig.2a,suggesting that Y could promotes the segregation of intermetallic phases in α-Mg grains. The morphology of AZY1.0 in Fig. 2e is quite different from that of AZ63 in Fig. 2a, in which the intermetallic phases are in the form of tiny and discrete state. These results are consistent with Li’s work, in which the Y alloying resulted in the distribution of intermetallic phases from continuous network state to discrete form [27]. In addition, the presence state of Al2Y in Fig. 2e, i.e. the bright block-like Al2Y phases usually locate inside the grains accompanied with some smaller Al2Y particles on grain boundaries, which is consistent with the work of Qiu and coworkers [44]; they claimed that Al2Y is an effective grain refine from the perspective of crystallography of heterogeneous nucleation.
The area proportions of intermetallic phases of these alloys are counted using commercial software Image Pro-Plus and the results are illustrated in Fig. 2f. The fractions of intermetallic phases of Y-containing alloys are evidently higher than that in AZ63 alloy. The addition of Y can incorporate with the Al to generate Al2Y in the time of crystallization because Al2Y is very stable at high temperature even in Mg melt [40]. As such, the sustained increase of Y loading in AZY0.5, AZY0.75 and AZY1.0 keep combining with Al in its own right and consequently hampering the generation of the eutectic α and β-Mg17Al12phases.
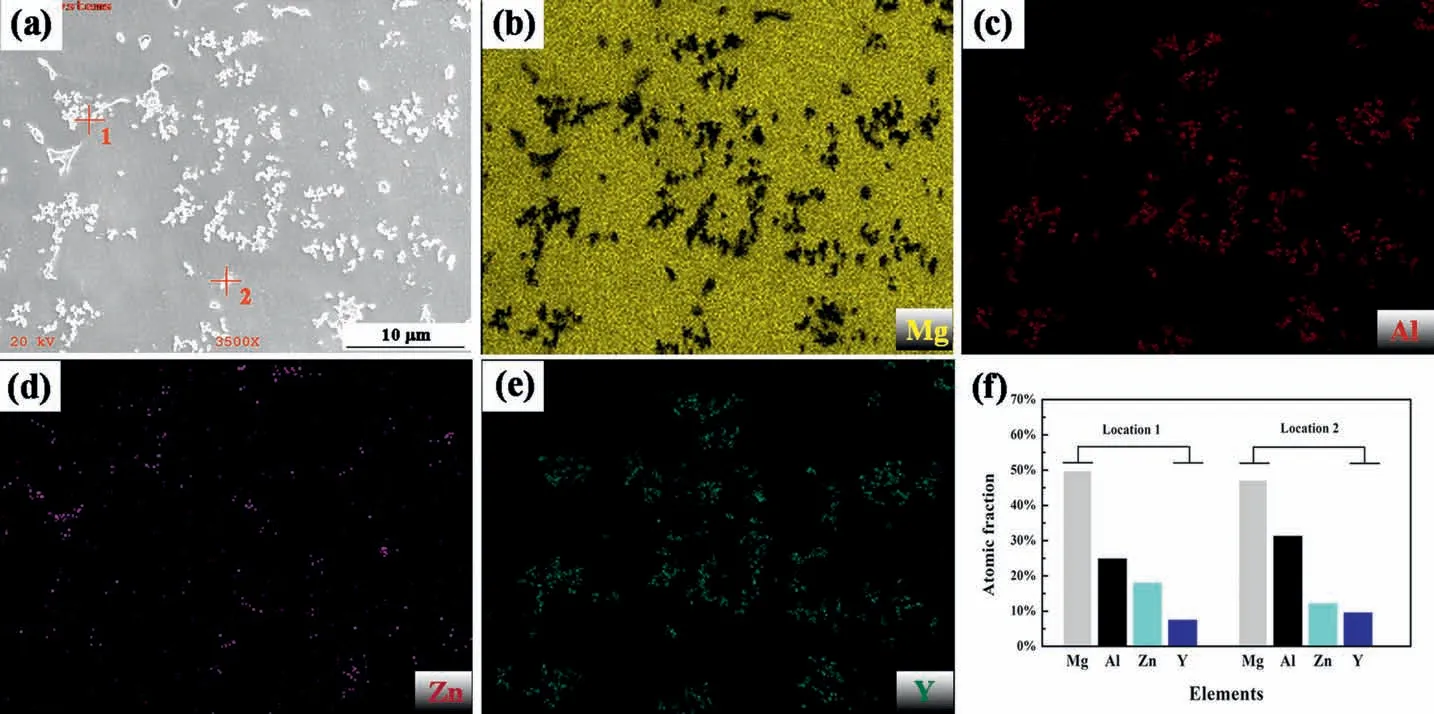
Fig. 3. SEM of AZY1.0 (a) and the corresponding elemental distributions of Mg (b), Al (c), Zn (d) and Y (e); (f) is the atomic fraction of intermetallic phases marked in (a) via EDS spot analyzing.
Fig. 3 presents the SEM image of AZY1.0 alloy and its corresponding elemental distributions. Similar to Al depicted in Fig. 3c, Y shown in Fig 3e tends to concentrate in intermetallic phases which is opposite to that of Mg in Fig. 3b.Besides, Zn depicted in Fig. 3d shows a trend of accumulating in intermetallic phases which is not consistent with the result in AZ63 alloy, in which Zn disperses homogeneously despite of α-Mg grains, grain boundaries or intermetallic phases[34].
The atomic fractions of intermetallic phases at locations 1 and 2 marked in Fig. 3a are illustrated in Fig. 3f, the concentrations of Al, Zn and Y are remarkably higher than their nominal compositions in AZY1.0 alloy(Al~5.6 at.%,Zn~1.1 at.% and Y~0.28 at.%). This result is also evidenced by the elemental distribution maps in Fig. 3b-3e. Furthermore, the atomic ratio of Al and Y in Fig. 3f is strikingly higher than 2:1, suggesting that the presence of Y in AZ63 must be in the form of Al2Y compound.
3.2. Corrosion behaviors of AZ63 and AZY alloys
Fig. 4a illustrates the hydrogen evolution volumes against immersion times of these magnesium alloys investigated in 3.5wt.% NaCl solution over 48h at 25±1°C. The hydrogen volumes of all these alloys increase with increasing immersion time and can be ranked in decreasing series as: AZ63 >AZY0.25 >AZY 0.5 >AZY 0.75 >AZY1.0. This result indicates that the increasing Y alloying can effectively decrease the corrosion rate of AZ63 alloy. The inset in Fig. 4a presents the variations of hydrogen volumes of these magnesium alloys within the firs 5h immersion. The hydrogen volume of AZ63 keeps a linear increase implying its highest corrosion rate among these alloys investigated.
The mass loss measurement for corrosion rate determination is undertaken on the very sample for hydrogen evolution.As shown in Fig. 4b, the obtained mass loss results of these alloys have similar variation trend to that of hydrogen collection, viz. AZ63 >AZY0.25 >AZY 0.5 >AZY 0.75 >AZY1.0. This result suggests that the Y alloying could effi ciently increase the corrosion resistance of AZ63 magnesium alloy despite the error on the corrosion evaluation of weight loss method [45].
The morphologies of corrosion products on these alloys over 48h immersion are presented in Fig. 5. AZ63 (Fig. 5a),AZY0.25 (Fig. 5b) and AZY0.5 (Fig. 5c) exhibit similar morphologies,i.e.,the corrosion products tend to floc together to form some island shape lumps. Whereas the corrosion products on AZY1.0 (Fig. 5e) distribute in continuous and compact way, on which some cracks are ascribed to the moisture evaporation in the course of vacuum treatment before SEM observation. It is believed that the corrosion product layer on magnesium alloys presenting in continuous and compact way is more adhesive and protective because this kind of morphology can effectively prevent the electrolyte from penetrating into and consequently isolate the substrate from contacting with aggressive chloride ions [34]. Consequently, the corrosion products morphology in Fig. 5e also elucidates higher corrosion resistance of AZY1.0 alloy.
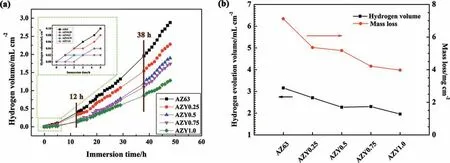
Fig. 4. Hydrogen evolution volume as a function of immersion time (a), and the comparison between hydrogen evolution volume and mass loss of AZ63 and AZY alloys over 48h immersion in 3.5wt.% NaCl solution (b).
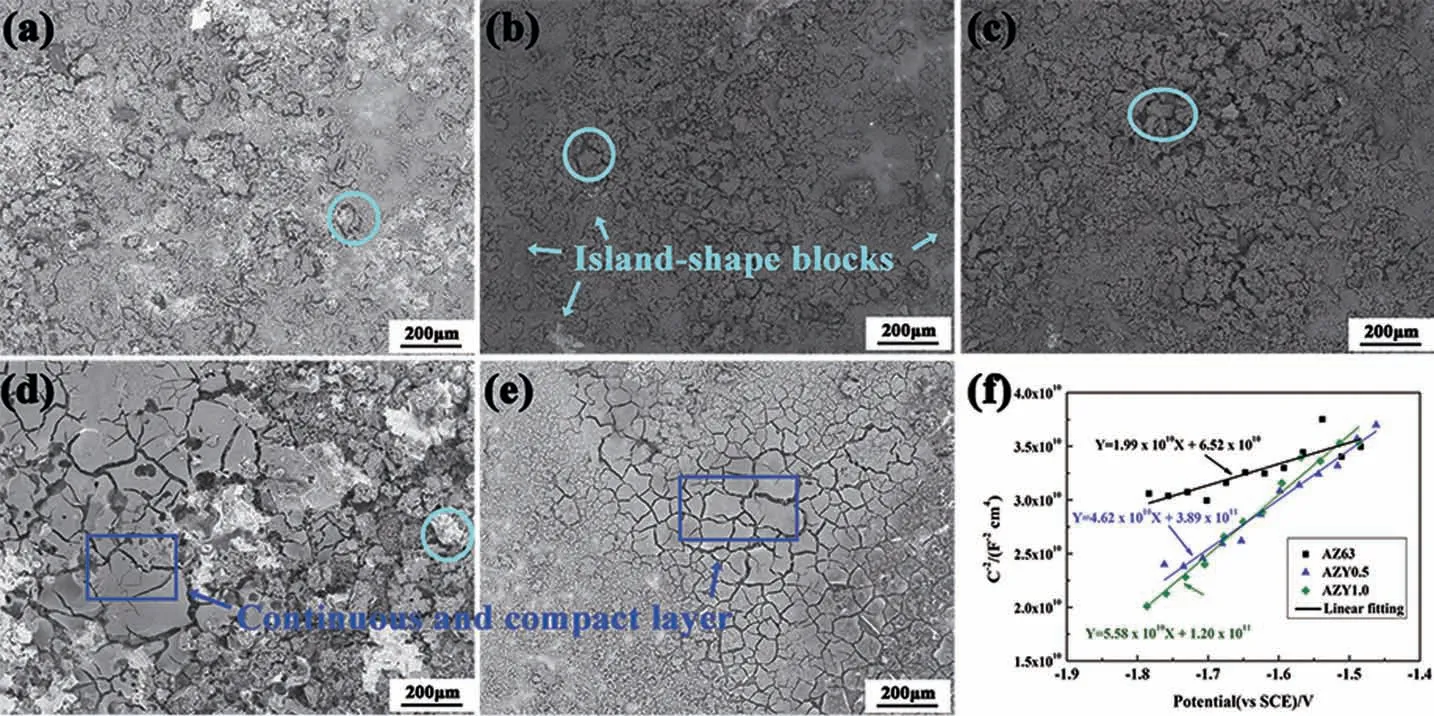
Fig. 5. Corrosion morphologies of AZ63 (a); AZY0.25 (b); AZY0.5 (c); AZY0.75 (d) and AZY1.0 (e) alloys with corrosion products over 48h immersion in 3.5wt.% NaCl at 25±1°C; (f) presents the Mott-Schottky plots and linear fittin results of the corrosion product layers on AZ63, AZY0.5 and AZY1.0 surfaces.
Fig. 5f displays the Mott-Schottky plots and corresponding linear fittin results of the corrosion product layers on AZ63, AZY0.5 and AZY1.0 surfaces, respectively. The positive slopes of these samples throughout the entire scanning potential range (-1.8 ~-1.5V vs. SCE) suggest that their product layers have n-type semiconductor properties. The Mg ions are deemed to be the donor in products layer based on the dissolution mechanism of Mg [46]. In Fig. 5f, the slopes of these alloys can be ranked as:AZY1.0 >AZY0.5 >AZ63, implying that the donor concentrations in product layers of these alloys decrease with increasing Y concentration.Comparative low donor concentrations in the product layer of Y-containing alloys correspond to low corrosion rate, implying a superior protectiveness of the product layer. This result can also be confirme by products morphologies in Fig. 5e,in which the product layer is continuous and compact.
Fig. 6 presents the XRD and XPS patterns of the corrosion products fallen off from AZ63 and AZY surfaces during the 48h immersion in 3.5wt.% NaCl solution. In Fig. 6a, the corrosion products of AZ63 magnesium alloy are mainly composed of Mg(OH)2(JCPDS Card No. 44-1482),Mg0.97Zn0.03(JCPDS Card No. 65-4596), NaCl (JCPDS Card No. 05-0628), Mg17Al12(JCPDS Card No. 01-1128)and MgCl2·4H2O (JCPDS Card No. 53-0258), whereas the diffraction intensities of Mg0.97Zn0.03and Mg17Al12phases descend strikingly in AZY patterns (Fig. 6b). It is worth noting that the MgCl2·4H2O phase disappears associated with Y alloying, manifesting the pitting corrosion of AZY alloys are alleviated because the presence of MgCl2would rupture the protective layer formation and give rise to the pitting corrosion.
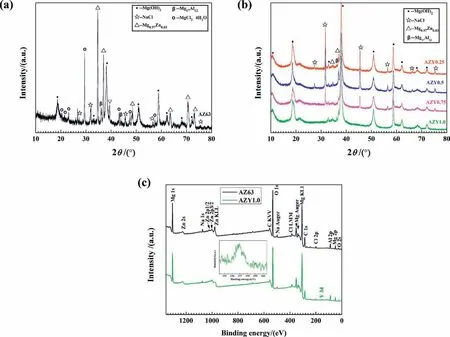
Fig. 6. XRD (a), (b) and XPS (c) patterns of corrosion products fallen off from corroded AZ63 and AZY alloys during the 48h immersion in 3.5wt.% NaCl at 25±1°C.
Comparing these diffraction peaks representing Mg0.97Zn0.03phase in AZ63, the remarkable decreasing intensities in AZY patterns substantiate that the falling off of α-Mg grains during the immersion is alleviated via Y alloying. The desorption of α-Mg grains of AZ63 magnesium alloy stems from the galvanic corrosion at the sites adjacent to α-Mg and intermetallic phases, on which the eutectic α phase would be corroded preferentially [34]. The subsequent corrosion of the eutectic α phase can give rise to the fallen off of α-Mg grains and accordingly lead to a higher corrosion rate. As presented in Fig. 2e, the discrete distribution of Al2Y phases cannot arouse the falling off of the bulky α-Mg particles in the case of galvanic corrosion between Al2Y and α-Mg phases.
The β-Mg17Al12phase is comparatively stable throughout the corrosion process [9]. The diffraction peaks representing β-Mg17Al12detected in Fig. 6a are obviously, which is owing to the desorption of intermetallic phase during the immersion.Unlike that in Fig. 6a, the diffraction peaks of β-Mg17Al12in Fig. 6b are almost imperceptible, suggesting that Y alloying can promote the transformation of intermetallic phases from Mg17Al12to Al2Y in the process of crystallization. Nonetheless, the Al2Y phase is not detected in XRD patterns, which is probably due to its tiny amount that under the detection limit of XRD equipment.
The presence of sodium chloride in corrosion products is ascribed to the electrolyte penetration. The corrosion products with porous microstructure would facilitate the sodium chloride to penetrate into. Among those of diffraction patterns,striking sodium chloride peaks are observed in AZY patterns except for that in AZY1.0, indicating the superior compactness of corrosion products of AZY1.0. This deduction can be verifie by the morphologies of product layer in Fig. 5e,the layer crust performs compact and strong adhering characteristics, by which the products layer is valid to hamper the electrolyte from contact with Mg substrate.
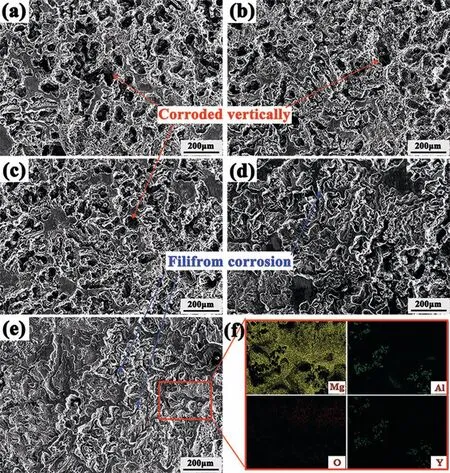
Fig. 7. Corroded surfaces of AZ63 (a); AZY0.25 (b); AZY0.5 (c); AZY0.75 (d) and AZY1.0 (e) alloys after the removal of corrosion products over 48h immersion in 3.5wt.% NaCl at 25±1°C. (f) is the elemental distribution maps of Mg, Al, O and Y of the marked area in (e).
Fig. 6c reveals the XPS survey spectra of the corrosion products of AZ63 and AZY1.0 alloys. Corresponding to the XRD results, peaks representing Mg1s, Na1s, ZnKLL, MgKL1, Cl2p, O1s, Na1S, and Al2p, are detected appearing at 1305eV, 1073eV, 979eV, 532eV, 307eV, 199eV and 78eV,respectively. In addition, yttrium peak is detected in the XPS spectrum of AZY1.0 despite its trace amount in corrosion products. The inset in Fig. 6c is the high-resolution spectrum of Y3dThe presence of Y peak in the XPS spectra of AZY1.0 corrosion products may be ascribed to the fallen off of Al2Y intermetallic phase in matrix during the corrosion process. Unfortunately, we could only attribute the peak in high-resolution spectrum to the presence of Al2Y approximately due to the absence of Al2Y information in Handbook of X-ray Photoelectron Spectroscopy and relevant research literatures available.
Fig. 7 presents the corroded AZ63 and AZY surfaces after the removal of corrosion products over 48h immersion in 3.5wt.% NaCl at 25±1°C. As red arrows marked in Fig. 7a,7b and 7c, the honeycomb corrosion morphology of AZ63 alloy suggests a pitting corrosion characteristic (viz. corrosion propagates vertically against surface) [47], leaving bulky phases linked end to end especially in Fig. 7a. It is believed that the remaining phases on corroded surface always act as cathode versus α-Mg grains during the immersion due to their noble potentials. Song et al. proposed that the β phase in AZ series magnesium alloys had dual effect on corrosion [9], viz.galvanic effect for corrosion promotion as well as barrier effect for corrosion inhibition. Based on the XRD pattern of corrosion products of AZ63 in Fig. 6a, the presence of β-Mg17Al12elucidates that the intermetallic phase in AZ63 is not high enough to form continuous net structure for corrosion inhibition.
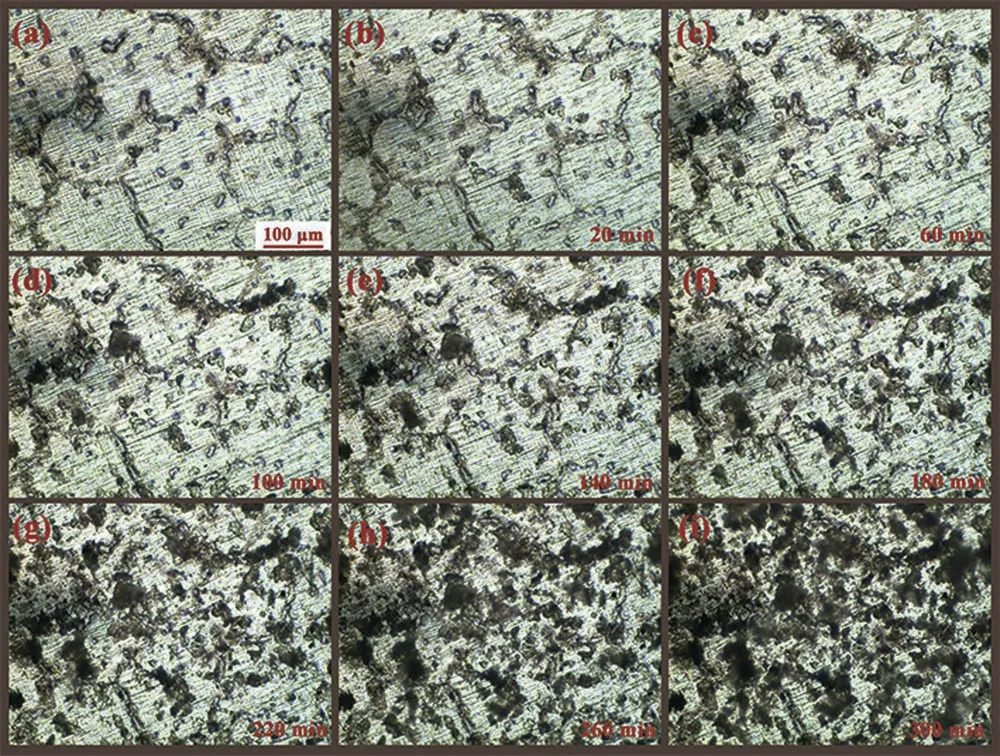
Fig. 8. Corrosion propagation of AZ63 magnesium alloy at the outset of 5h immersion in 3.5wt.% NaCl at 25±1°C.
Corroded morphologies identifie by some filament on the surfaces of AZY0.75 and AZY1.0 alloys (blue arrows marked in Fig. 7d and 7e) perform different characteristics compared with AZ63. Corrosion propagations on AZY0.75 and AZY1.0 become shallow and widespread with increasing Y content,which suggest a filifor corrosion characteristics as marked in Fig. 7d and 7e [24,48]. Besides, some un-corroded areas are also observed. The corrosion of AZY alloys tend to propagate laterally with increasing Y alloying, leading to the corrosion become more and more uniform.
Typical filifor corrosion always take place under the protective coatings, which is derived from the difference of oxygen concentrations between the head and tail areas.The difference of oxygen concentrations determines the advancing direction of filifor corrosion [49]. Nonetheless, filifor corrosion can also be observed on some uncoated pure magnesium and its alloys [15,50], where the mechanism is different. Mg and its alloys are quite active in nature, an oxide/hydroxide fil would generate spontaneously once exposed to atmosphere. The filifor corrosion could propagate under the oxide layer once the sample is exposed to aggressive solution.On the other hand, the cathodic process of Mg corrosion is mainly of hydrogen evolution,whereupon the oxygen concentration has limited effect on Mg corrosion. The Y containing magnesium alloys perform increasingly filifor corrosion characteristics, suggesting that the oxide/hydroxide fil on AZY alloys are getting more and more protective capability.This result is in agreement with the inset of hydrogen evolution volume depicted in Fig. 4a, where the Y containing alloys perform retarded hydrogen evolution at the outset of 5h immersion.
Fig. 7f presents the elemental distribution maps of Mg, Al,Y and O of the framed area in Fig. 7e, respectively. The Mg scanty areas appear at the serious corroded sites as well as some intermetallic phases similar to that in Fig. 2e. On the contrary, these Mg scanty areas are comparatively rich in Al and Y, indicating that the intermetallic phase is more stable than α-Mg phase. The α-Mg adjacent to intermetallic phase would act as anode and dissolve preferentially. Furthermore,the distribution of O in Fig. 7f is similar to Mg, implying that the oxide/hydroxide layer on AZY1.0 substrate keeps providing protectiveness against corrosion.
3.3. Corrosion propagation at the outset of immersion
To clarify the effect of Y alloying on the initial corrosion of AZ63 magnesium alloy, the short-term corrosion behaviors of AZ63 and AZY1.0 alloys are monitored in situ via metallographic microscope. Fig. 8 presents the corrosion propagation of AZ63 magnesium alloy over the 5h immersion. Fig. 8a is the metallographic morphology shot in air. There is no obvious variation after the initial 20min immersion as depicted in Fig. 8b. As time elapse, the hydrogen bubbles are generated gently at the intermetallic phases as presented in Fig. 2c~2i,meaning that the corrosion has taken place at the borders of these intermetallic phases due to the micro-galvanic effect.At the end of the observation presented in Fig. 8i, the corrosion has propagated all over the whole sample surface, except for these un-corroded areas quite far from the intermetallic phases. As reported in [27,51], the intermetallic phases are mainly of the β-Mg17Al12with noble potential compared with α-Mg grains, whereupon the corrosion would occur at these α-Mg sites adjacent to intermetallic phases preferentially. As the corrosion proceeds, the intermetallic phases in α-Mg grains would fall off once their adjacent α-Mg are exhausted. Nonetheless, some of intermetallic phases on grain boundaries would remain on Mg surface due to their continuous net microstructures. This kind of intermetallic phase can persistently act as cathode versus α-Mg, leading to the localized corrosion of AZ63 as presented in Fig.7a.Consequently,the initial corrosion of AZ63 is dominated by micro-galvanic localized corrosion.
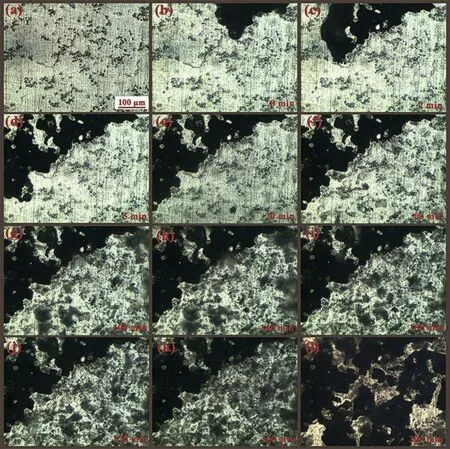
Fig. 9. Corrosion propagation of AZY1.0 at the outset of 5h immersion in 3.5wt.% NaCl at 25±1°C.
Fig. 9 presents the corrosion propagation of AZY1.0 magnesium alloy over the 5h immersion. Fig. 9a is the metallographic morphology shot in air, which is similar to that in Fig. 2e. On immersion in NaCl solution, corrosion initiates immediately at some discrete intermetallic sites and expends fast to adjacent areas as shown in Fig. 9b. It is reasonable to speculate that filifor corrosion has occurred on AZY 1.0 surface at the outset of immersion. The corrosion propagates rapidly in the firs 5min immersion as depicted in Fig. 9c and 9d, after that about one third of the visual fiel is corroded within this period. Nonetheless, the corrosion propagation seems to cease after 5min because there is no obvious variation observed on the surface of electrode. Actually, the filifor corrosion does not cease after 5min immersion but extends to other areas that beyond the view of metallographic microscope.
With the increase of immersion time, some subtle bubbles are gradually separating out like gray haze from some discrete intermetallic phases as shown in Fig. 9e~9k. This kind of behavior should be ascribed to the micro-galvanic corrosion.Comparing the morphology shot at 300min immersion in Fig. 9l with that at 260min immersion in Fig. 9k, another one third of visual file is corroded within 40min, manifesting that the corrosion has spread back to our visual file once again at a rapid propagation rate. Hereby, the characteristics of initial corrosion of AZY1.0 is a combination of filifor corrosion and micro-galvanic corrosion. This result can interpret the corroded morphology of AZY1.0 in Fig. 7e.
As discussed above, filifor corrosion often takes place under the corrosion resistant layer. In this work, AZ63 alloy performs localized corrosion characteristic at the outset of immersion, indicating that the oxide layer generated on AZ63 is not very protective. Whereupon, the filifor corrosion taking place on AZY1.0 suggests that Y alloying must have some effect on improving the protectiveness of the oxide film
The XPS analysis is adopted to further identify the chemical composition and phases of the oxide film [52]. Fig. 10a and b respectively present the typical XPS survey spectra of the oxide film on AZ63 and AZY1.0 surfaces. The survey spectra reveal various elements on the surface of AZ63 and AZY1.0 alloys, including Mg, O, C and Al. The absence of Y in oxide layers of AZY1.0 suggest that Y element cannot participate in the formation of oxide film This result is also consistent with the work of Yu who added 4.2wt.% Al into Mg-2.5wt.%Y, without findin the presence of Y in oxide layer [40].
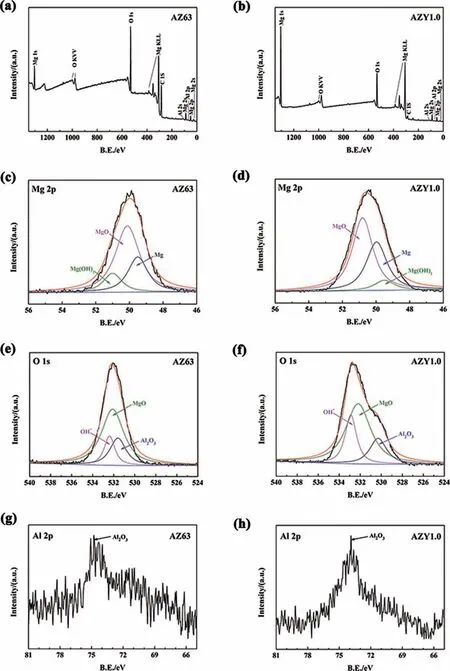
Fig. 10. XPS spectra of the oxide layers of AZ63 and AZY1.0 alloys: wide XPS spectrum of AZ63 (a) and AZY1.0 (b), Mg 2p of AZ63 (c) and AZY1.0(d), O 1s of AZ63 (e) and AZY1.0 (f), Al 2p of AZ63 (g) and AZY1.0 (h).
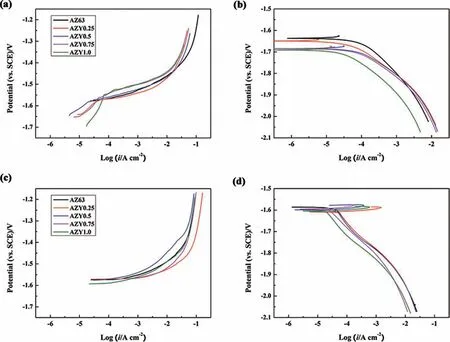
Fig. 11. Potentiodynamic polarization behaviors of AZ63 and AZY alloys: (a) and (b) are anodic and cathodic polarization curves tested immediately after OCPs get stable in 3.5wt.% NaCl at 25±1°C, respectively; (c) and (d) are anodic and cathodic polarization curves tested after 300min immersion in 3.5wt.%NaCl at 25±1°C, respectively.
Fig. 10c, e and g depict the corresponding high-resolution spectra for Mg2p,O1sand Al2pregions of the oxide layer on AZ63 alloy, respectively. In Fig. 10c, three different binding energies at 49.95eV, 51eV and 49.5eV are respectively associated with Mg, MgO and Mg(OH)2, suggesting that the Mg 2ppeak is composed of three components [53,54]. Fig. 10e presents decomposition-fitte curves of O1sspectra. The corresponding O1sspectra contain a lower binding energy(BE) peak at 531.6eV of Al2O3, an intermediate BE peak at 532.4eV of MgO and a higher BE peak at 532.6eV of OH-[55-57]. The binding energy at 74.7eV in Fig. 10g merely corresponds to Al2O3[58]. As a consequence, the oxide fil on AZ63 alloy is composed of Al2O3, MgO and Mg(OH)2.According to the decomposition-fitte curves in Fig. 10d, f and h, the composition of oxide fil on AZY1.0 alloy issimilar to that of AZ63, where the 50.8eV corresponds to MgO in Fig. 10d [59], 530.5eV corresponds to Al2O3in Fig. 10f [60] and 74.0eV corresponds to Al2O3in Fig. 10h[61]. The binding energies of the rest species are identical to those of AZ63.

Table 2 Quantitative element analyses of the oxide layers on AZ63 and AZY1.0 alloys.
The atomic ratios of the oxide film on AZ63 and AZY1.0 alloys are presented in Table 2. As discussed above, both AZ63 and AZY1.0 alloys are covered with oxide film consisted of MgO, Mg(OH)2and Al2O3. Mg(OH)2is of porousmicrostructure that cannot provide efficien protectiveness.The PBR ratio of Al2O3falls in between 1 and 2 [62] which is higher than that of MgO (0.81), whereupon the formation of Al2O3on the surface can also act as a barrier and enhance the corrosion resistance of magnesium alloy [63]. According to Table 2, the atomic ratio of Al in AZY1.0 is higher than that in AZ63, suggesting that the oxide fil on AZY is more compact and protective. This result signifie that Y alloying to AZ63 can promote the corrosion resistance not only by altering the present state of intermetallic phases, but also by increasing the concentration of Al2O3in the oxide layer.

Table 3 Corrosion parameters of AZ63 and AZY alloys derived from polarization curves.
3.4. Potentiodynamic polarization behavior
Fig. 11 displays the potentiodynamic polarization behaviors of AZ63 and AZY alloys in 3.5wt.% NaCl at 25±1 °C.To avoid surface modification the anodic and cathodic sweepings are respectively carried out from free corrosion potential for on parallel samples [64].
Fig. 11a shows the anodic polarization behaviors of AZ63 and AZY alloys tested once their OCPs got stable. The anodic branches of AZY alloys perform passivation behaviors at the very beginning of anodic polarization, whereas the anodic current of AZ63 increases strikingly with increasing potential. The passivation of AZY alloys in the case of anodic dissolution can be ascribed to the presence of a protective oxide layer on AZY alloys. The potential range of passivation increases with increasing Y concentration, viz. AZY0.25 <AZY0.5 <AZY0.75 <AZY1.0,validating that the protective capability of the oxide layer increases with Y content. This findin can also be interpreted by the XPS results in Fig. 10 and Table 2. The absence of the passivation region of AZY alloys in Fig. 11c is owing to the oxide layer has been almost run out in the case of immersion over 300min, which is proved by the in situ observation of AZY1.0 in Fig. 9l, the corrosion has propagated all over the surface.
The cathodic branches of AZ63 and AZY alloys perform similar polarization behaviors in both two cases of immersion. This result implies that the Y alloying cannot vary the essence of cathodic process of Mg, while the cathodic current densities are descended via Y alloying as presented in Fig. 11b and d.
The corrosion current density of a specifi alloy is obtained by extrapolating the strong polarization range of cathodic branch to free corrosion potential based on Tafel law,corresponding results are listed in Table 3. The corrosion current densities (icorr) of AZ63 are higher than AZY alloys in both cases, manifesting that Y alloying can effectively improve the corrosion resistance of AZ63 regardless of immersion time.The decreasing icorrwith increasing Y concentration at the outset of immersion is owing to the increase of Al2O3in oxide layer as discussed above. In the case of 300min immersion, the decreasing icorrcan be attributed to two factors: one is the transformation of intermetallic phases from Mg17Al12to Al2Y, by which the micro-galvanic corrosion is alleviated; the other is the increasing compactness of products layer as shown in Fig. 5, which can provide protective effect on Mg substrate against corrosion.
4. Conclusions
In summary, the corrosion behavior of Mg-Al-Zn and Mg-Al-Zn-Y alloys are investigated in 3.5wt.% NaCl solution at 25±1 °C. The tentative conclusions are summarized as follows:
(1) Y alloying to AZ63 magnesium alloy can promote the corrosion resistance throughout the corrosion process but in different mechanisms.
(2) The corrosion alleviation at the outset of immersion is attributed to enhanced oxide layer on magnesium alloy.Y element cannot participate in the formation of oxide layer, whereas it can improve the content of Al2O3in oxide layer and consequently give rise to the increase of protectiveness of oxide layer.
(3) Y alloying facilitates the intermetallic phases transformation from continuous Mg17Al12to discrete Al2Y phase. This transformation efficientl alleviates the micro-galvanic corrosion between intermetallic phases and α-Mg grains. Besides, the corrosion product layers on Y-containing alloys are comparatively continuous and compact, which can provide a barrier to keep the electrolyte from penetrating into.
Declaration of Competing Interest
None
Acknowledgements
The authors wish to acknowledge the financia support of the Natural Science Foundation of ShanDong Province of China (Grant No. ZR2018BD025); National Natural Science Foundation of China (Grant No. 41576114); Qingdao Innovative Leading Talent Foundation (Grant No. 15-10-3-15-(39)-zch); Qingdao Science and Technology Achievement Transformation Guidance Plan (Applied Basic Research, Grant No.14-2-4-4-jch). And this work was also financiall supported by State Key Laboratory for Marine Corrosion and Protection,Luoyang Ship Material Research Institute, China (Project No.KF190404).
杂志排行
Journal of Magnesium and Alloys的其它文章
- Mechanism of Mn on inhibiting Fe-caused magnesium corrosion
- Investigating TiO2-HA-PCL hybrid coating as an efficien corrosion resistant barrier of ZM21 Mg alloy✩
- Effect of lithium content on the mechanical and corrosion behaviors of HCP binary Mg-Li alloys
- Poly caprolactone/titanium dioxide nanofibe coating on AM50 alloy for biomedical application
- New design principles for the bath towards chromate- and crack-free conversion coatings on magnesium alloys
- Pore characterization of PM Mg-0.6Ca alloy and its degradation behavior under physiological conditions
