Corrosion behaviour and cytocompatibility of selected binary magnesium-rare earth alloys
2021-05-21HiAzzeddineAdelkderHnnAhourDkhouherengreLuthringerFeyerend
Hi Azzeddine, Adelkder Hnn, Ahour Dkhouhe, Bérengère Luthringer-Feyerend
a Department of Physics, Faculty of Sciences, University of Mohamed Boudiaf, M’sila, Algeria
b Inorganic Materials Laboratory, Department of Chemistry, Faculty of Sciences, University of Mohamed Boudiaf, M’sila, Algeria
c Metallic Biomaterials, Institute of Material Research, Helmholtz-Zentrum Geesthacht, 21502 Geesthacht, Germany
Received 3 June 2020; received in revised form 26 August 2020; accepted 6 September 2020
Available online 24 September 2020
Abstract
Keywords: Corrosion; Cytotoxicity; Magnesium alloys; Rare earth element; Weight loss test.
1. Introduction
Recently, Magnesium (Mg) based alloys have received much attention as biodegradable metals due to their similar characteristic to human bone such as density (1.74-2.0g cm-3) and elastic modulus (41-45GPa) which ensure the compatibility between the bone and the implant[1,2].In addition, Mg is a nontoxic element, largely present in the human body and necessary to many human metabolic activities [2].Various investigations show that a large variety of Mg-based alloys like AZ31, AZ91, LAE442, AM50 and WE43 could be used as temporary implants [3,4]. However, Mg-based alloys can still suffer from too rapid degradation rate and inherent release of hydrogen gas in physiological environments, leading to a rapid loss of mechanical stability before tissue healing[1,3,5].
Rare-Earth (RE) as an alloying addition to Mg matrix has proven their astonishing effect on increasing the formability and the corrosion resistance of Mg-based alloys [6-9]. This resistance is related to the effect of the RE element to form intermetallic compounds with the impurities, hence purifying the melt [10]. In addition, RE elements can decrease the occurrence the micro-galvanic corrosion by grain refinemen and reduce the fraction of second phases [11].
In fact, the corrosion resistance depends strongly on the specifi RE alloying element. Previously, it was demonstrated that the corrosion resistance of the Mg-RE alloys in 3.5%NaCl (wt%) solution increases in the following order: Mg-1.43La <Mg-1.44Nd <Mg-0.3Ce <Mg-0.63Gd <Mg-0.41Dy (wt%) [12]. The results showed that the formation of Dy2O3phases prevented Mg-0.41Dy alloy from pitting corrosion [12]. However, the high volume fraction of the dendritic Mg12La phase was responsible for the severe corrosion of Mg-1.43La alloy [12]. A Similar tendency was reported in Mg-Ce, Mg-Nd and Mg-La alloys in 0.6% NaCl (wt%)solution and was explained by the effect of the specifi RE element present in the second phase[13].Moreover,it is known that the Mg-Zn-Gd-Zr alloy could contain different phases like lamellar X-Mg12GdZn, net-like W-Mg3Gd2Zn3and strip-like I-Mg3Zn6Gd phases [14]. Each of the later phases acts differently during the corrosion process of Mg-Zn-Gd-Zr alloy [14]. It was found that W-Mg3Gd2Zn3phase accelerates the micro-galvanic corrosion, I-Mg3Zn6Gd phase led to more uniform corrosion and X-Mg12GdZn phase increases the corrosion resistance of the alloy [14]. In addition, the effect of the second phase on the corrosion behaviour was found different as a function of the immersed solution [15]. Indeed,the presence of precipitation in Mg-Dy alloy was reported to increase the corrosion rate in NaCl solution, while the corrosion rate was not affected by cell culture medium solutions[15].
The corrosion behaviour is also influence by changing the concentration of RE element in Mg matrix [16-18]. For example, the optimal concentration for the best corrosion resistance being 2wt% for Y, 10wt% for Dy, and 15wt% for Gd [16-18].
Despite the beneficia effects of RE elements, some of them such as La and Ce elements were found toxic and should be used cautiously [19,20]. Also, the biocompatibility and cytotoxicity of Mg-RE alloys are related to the concentration of RE elements [21].
Even if several studies focussed on RE, many works still need to be done to fully understand the effect of RE elements on the corrosion and biocompatibility behaviour of Mg-RE based alloys and thereby insuring the design of new Mg-RE alloys more suitable for biomedical applications.
The aim of the present study is to give more detailed information on the behaviour of different Mg alloys containing low levels of RE in a physiological environment. Therefore, the degradation behaviour of binary Mg-0.3Ce,Mg-1.44Nd,Mg-0.63Gd and Mg-0.41Dy (wt%) were investigated in DMEM+10% FBS solution using electrochemical test and weight loss. Furthermore, cytotoxicity of the Mg-RE alloys was also evaluated.
2. Material and methods
2.1. Materials
The Mg-0.3Ce, Mg-1.44Nd, Mg-0.63Gd and Mg-0.41Dy(wt%) alloys were provided from the Institute of Physical Metallurgy and Materials Physics, RWTH Aachen University,Aachen, Germany in as-cast state. More details on the alloys producing can be found in reference [12]. Discs with Ø 15mm×25mm dimensions were machined from the ascast blocs. The microstructures of the Mg-RE alloys were relatively similar containing large grains with the presence of second phases (MgxCey, Mg12Nd, Mg41Nd5, Mg12Gd and Mg24Dy5phases) reflectin the typical as-cast microstructure[12].
2.2. Electrochemical tests
Electrochemical tests were performed using a standard three-electrode cell on AUTOLAB PGSTAT302N electrochemical work station (Metrohm Autolab B.V., Utrecht, the Netherlands). In this system, the sample is the working electrode while a platinum plate and a calomel electrode are the counter and the reference electrodes, respectively. A 0.5 cm2of the surface of each sample was immersed in 125ml of Dulbecco’s modifie Eagle medium (DMEM) at room temperature (RT). The open-circuit potential was measured at RT for at least 2h for each sample. After that the polarization curves and the impedance measurements were recorded. ZView software (Scribner Associates Inc, Southern Pines, North Carolina, USA; version 2.3d) was used to fi the experimental curves. More details on the experimental procedure can be found in reference [12].
2.3. Weight loss
Disks with 100mm of diameter and 3mm of thickness were immersed in 2mL of DMEM(Life Technologies GmbH,Darmstadt, Germany) supplemented with 10% foetal bovine serum(FBS;Biochrom GmbH,Berlin,Germany)solution under cell culture conditions (37°C, 95% rH, 5% CO2, 20%O2) for 3 days. Before immersion, the weights of the samples were measured after being cleaning(n-Hexane for 20min in the ultrasonic bath/acetone for 20min in the ultrasonic bath/ethanol 100% 3min in the ultrasonic bath; all chemicals purchased from Sigma-Aldrich Chemie GmbH, Munich, Germany) and sterilized ultrasonically for 20min in 70% ethanol.After immersion, the corrosion product on the sample surfaces were removed using chromate solution (200g/L CrO3with 10g/L AgNO3;Sigma-Aldrich Chemie GmbH, Munich,Germany) for 5-10min and then the weight of the samples were recorded again. The corrosion rate (RC) in (mm/year)was calculated using the following equation [22]:

where Δg is the weight difference, A is the surface area, t is the immersion time and ρ is the sample density.
At least four immersed samples were taken for each alloy.The fina results were taken as the average value of the four measurements. The pH and osmolalities were also determined during the immersion test.
2.4. Microstructure characterization
The corrosion morphology after immersion test was inspected using scanning electron microscopy Phenom ProX Desktop SEM (Thermo Fisher Scientific Bremen, Germany)equipped with energy dispersive spectrometry (EDS) system in backscattering (BSE) mode operated at 15kV.
2.5. Cytotoxicity test
Human umbilical cord perivascular (HUCPV) cell isolations were approved by the ethics committee of the Hamburg medical association (PV4058) and performed as previously described [23]. Isolated HUCPV cells were expanded in α-minimum essential medium (α-MEM; Invitrogen, Fisher Scientifi GmbH, Schwerte, Germany), containing 15% (v/v)foetal bovine serum for human mesenchymal stem cell (Biological Industries, Beit-Haemek, Israel) and 1% (v/v) penicillin/streptomycin (P/S; Life Sciences, Karlsruhe, Germany)under physiological conditions (5% CO2, 20% O2, 95% relative humidity, 37°C). The medium was changed every 2-3 days and cells were cultured until approximately 80% conflu ence. HUCPV cells of the 5-8th passages were used for the biological tests.
After overnight preincubation in cell culture medium (to allow the formation of a protective degradation layer), samples (3 per alloys) were placed in agarose coated 24 well plates. 5000 cells were seeded on the material surface and let adhere for 30min. Afterwards, 2mL fresh medium was added to each well. After 3 and 7 days, cytocompatibility was monitored via live and dead staining, using calcein AM(Life Technologies GmbH,Darmstadt,Germany)as a stain for live cells (green) and ethidium homodimer-1 (Sigma-Aldrich Chemie GmbH, Munich, Germany) for dead cells (red). For the staining, cells were washed with serum-free α-MEM and incubated with the staining solution(calcein AM and ethidium homodimer-1 were diluted in α-MEM (serum-free) at 1μM and 2μM, respectively) for 20min under physiological conditions. Stained samples were evaluated using a Nikon Eclipse Ni fluorescenc microscope (Nikon GmbH, Düsseldorf, Germany).
3. Results
3.1. Electrochemical tests
Fig. 1(a) present the potentiodynamic polarization curves after 2h of immersion in DMEM solution for the investigated Mg-RE alloys. The anodic part coincided for all alloys, however,the Mg-0.63Gd and Mg-0.41Dy alloys showed a similar break-down potential (Eb) at -1.36 VSCEwhich indicates the breakdown of the protective oxides fil and the formation of pitting corrosion. The current density in the cathodic part increased with RE element as follow:Mg-0.3Ce <Mg-1.44Nd<Mg-0.41Dy <Mg-0.63Gd (as shown by arrow).
For all the Mg-RE alloys, the dissolution of Mg metal(anodic part) and the hydrogen evolution (cathodic part) were not symmetrical.Therefore,the corrosion potential(Ecorr)and the corrosion current density(Icorr)values were found by Tafel extrapolating the cathodic region [24-26] .
The results values are listed in Table 1. The Mg-0.3Ce and Mg-1.44Nd alloys had the higher Ecorrvalue (-1.94V).While, the Ecorrof Mg-0.63Gd and Mg-0.41Dy alloys(~-1.70V) were more shifted towards positive value showing that both alloys are nobler than Mg-0.63Ce and Mg-1.44Nd alloys.However,the Icorrvalues seemed to decrease in the following order Mg-1.44Nd <Mg-0.3Ce <Mg-0.63Gd<Mg-0.41Dy.
The corrosion rate (CRp) can be estimated based on Icorrvalues as followed [27]:


Fig. 1. (a) Potentiodynamic polarization curves, (b) Nyquist, (c) phase and(d) bode plots for Mg-0.3Ce, Mg-1.44Nd, Mg-0.63Gd and Mg-0.41Dy alloys in DMEM solution and (e) the equivalent circuit used to fi the experimental data.
The corrosion rate value of the investigated alloys presented in Table 1 increased as followed: Mg-0.41Dy<Mg-0.63Gd <Mg-0.3Ce <Mg-1.44Nd.
Fig. 1(b)-(d) shows the Nyquist plot, Bode plot and Phase angle diagram of the investigated alloys. The Nyquist plots exhibit three different shapes as a function of the RE alloying elements indicating a different corrosion mechanism for each Mg-RE alloys.
The Nyquist plots of Mg-0.3Ce and Mg-0.63Gd alloys show two capacitive loops: one capacitive loop at the medium-frequency region and the second one at lowfrequency region. Besides the presence of two capacitive loops, the Mg-0.41Dy alloy exhibited also an inductive loop in the low-frequency region. In contrast, the Nyquist plot of Mg-1.44Nd alloy seems to show the presence of only one capacitive loop at high-frequency region followed by an inductive loop in the low-frequency region. In fact, the shape of the capacitive loop at high-frequency is not perfectly a half loop so it could be a result of a mixture between two capacitive loops.
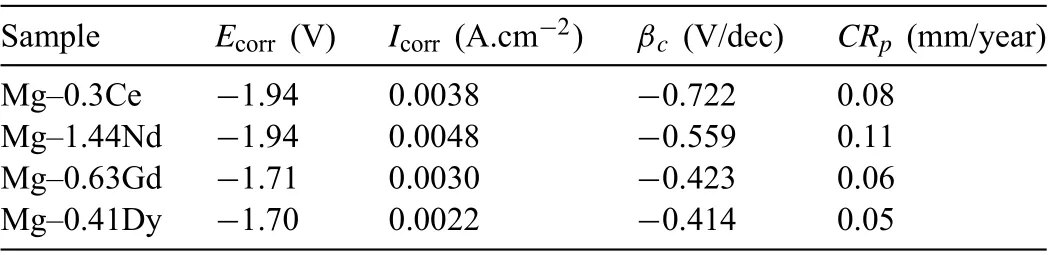
Table 1 Corrosion potential and current density fitte from the potentiodynamic polarization curves of Mg-RE alloys in DMEM solution.

Fig. 2. Photographs of the investigated Mg-RE alloy before immersion, after immersion and after chromic acid treatment, respectively. The arrows show some regions still not corroded in the Mg-0.63Gd alloy.
It is interesting to note that the phase plots, shown in Fig. 1(c), indicate the presence of third capacitive loop at the high-frequency region in all Mg-RE alloys (see arrow).This capacitive loop is very small and could not be distinguished in the Nyquist plots. Frequently, the Mg-based alloys show the presence of only two capacitive loops[11].However,some reported demonstrated the presence of the third capacitive loop especially in coated Mg-based alloys [25,28,29] or after different immersion time [30-34]. Fig. 2(d) shows that the evolution of the impedance as a function of frequency(bode plots) is very similar for all Mg-RE alloys in which the impedance decreases with increasing the frequency.
Fig. 1(b) demonstrated that the corrosion resistance of Mg-0.63Gd and Mg-0.41Dy alloys are better than for Mg-1.44Ndand Mg-0.3Ce alloys as indicated by the high dimensions of both capacitive loops in Mg-0.63Gd and Mg-0.41Dy alloys.
An electrochemical equivalent circuit is used to further elucidate the corrosion mechanism of the investigated Mg-RE alloys as presented in Fig. 1(e). The corresponding fittin data are listed in Table 2. Rsreflec the solution resistance between the working electrode and the reference electrode.Rd/CPEdfi the capacitive loop at the high-frequency region and refer to the resistance and the capacitance of deposited product [34]. Some reports attributed this capacitive loop to the adsorption process and the formation of Mg+2ions during the corrosion process [31,32]. Rf/CPEffi the capacitive loop at the medium-frequency region and refers to the resistance of fil developed from the alloy matrix and its corresponding capacitance [34]. Rdl/CPEdlcorresponds to the capacitive loop at the low-frequency region and refers to the charge transfer resistance and the formation of the double layer at the interface between the sample and the solution [35]. It is known that the CPE is define by two values, Y and n and usually employed instead of the capacitance in case of the non-homogeneity of the sample surface [36]. CPE will transform into a capacitor when n=1. L presents the inductance and usually, it indicates the occurrence of pitting corrosion[37].
The Rsvalues are relatively similar for the all Mg-RE alloy, except for Mg-0.3Ce alloy (39.3 Ω.cm2) indicating that the RE alloying elements exhibit similar behaviour in thecontact with the DMEM solution. The capacitive loops corresponding to the corrosion product formed on the sample surface (CPEdand CPEf) are not well define since their ndand nfvalues were far way form unity. The CPEdof Mg-1.44Nd alloy shows the lower value compared to the other Mg-RE alloys indicating a poor corrosion resistance of the Mg-1.44Nd alloy. The CPEdlvalues are in range of typical metal/solution system (10-100 μF cm-2) [38]. Generally, the high value of Rctand Rfindicates a low corrosion rate. As can be seen from Table 2, the Mg-0.63Gd and Mg-0.41Dy alloys have a good corrosion resistance compared to the Mg-0.3Ce and Mg-1.44Nd alloy. Also, it is obvious that the inductance of Mg-0.4Dy alloy is much higher (10,195 H cm-2) than found for the Mg-1.44Nd alloy (2412 H cm-2)demonstrating a relative uniform corrosion [11].
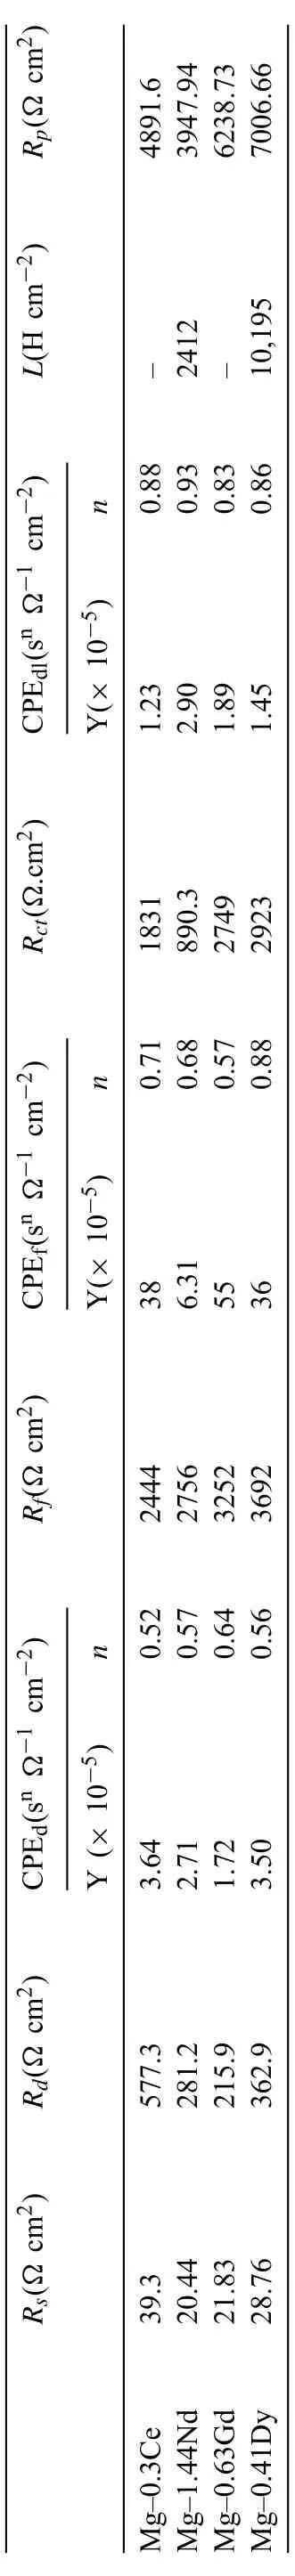
Table 2 Electrochemical parameters obtained from the fit of the experimental EIS data of Mg-RE alloys in DMEM solution.
The polarization resistance can be calculated using the different resistances present in the equivalent circuit [39]:

The values of Rpare summarized in Table 2. As can be seen the Rpincreases in the following order Mg-0.41Dy <Mg-0.63Gd <Mg-0.3Ce <Mg-1.44Nd which is in good agreement with the result of the polarization curves.
3.2. Immersion tests
Fig. 2 presents the surface photographs of the investigated Mg-RE samples before immersion, after immersion for 3 days in DMEM+10% FBS and after removing the corrosion product by chromic acid treatment. After immersion, the corrosion layer appeared grey. It can be mentioned that at a macroscopic level, this layer appeared homogeneous for Mg-0.63Gd and Mg-0.42Dy alloys and not for Mg-0.3Ce and Mg-1.44Nd alloys. Indeed, after chromic acid treatment,the surface of Mg-1.44Nd alloy indicated a severe corrosion process. The microstructure of coarse grains can be easily seen on the surface of the Mg-0.41Dy alloy. The Mg-0.63Gd alloy demonstrated the best surface and even there are some regions were not corroded as marked by the arrows.
The corrosion rate for the investigated Mg-RE alloys was calculated by weight loss and the results are shown in Fig. 3(a). The Mg-1.44Nd alloy exhibited the highest corrosion rate (1.91±0.31mm/year), followed by Mg-0.3Ce(1.81±0.06mm/year), Mg-0.41Dy (1.75±0. 1mm/year) and the Mg-0.63Gd alloy the lower one (1.53±0.23mm/year).
Fig. 3(b) and (c) shows the evolution of pH and osmolality of the investigated Mg-RE alloys after 3 days of immersion in DMEM +10% FBS solution. It is obvious that the pH of all Mg-RE alloys increased with increasing immersion time indicating the alkalization of the solution. Similar evolution is observed of the osmolality due to the increase of the solute particles - degradation products in the solution. The evolution of pH value was similar for Mg-1.44Nd,Mg-0.63Gd and Mg-0.41Dy alloys (~8.23), while, the Mg-0.3Ce alloy presented the lowest pH value (8.13±0.02).Thus, the Mg-0.3Ce alloy exhibited also the lower osmolality value (0.45±0.0029 Osmoles/kg) and the Mg-0.63Gd alloy the higher one (0.53±0.025 Osmoles/kg).
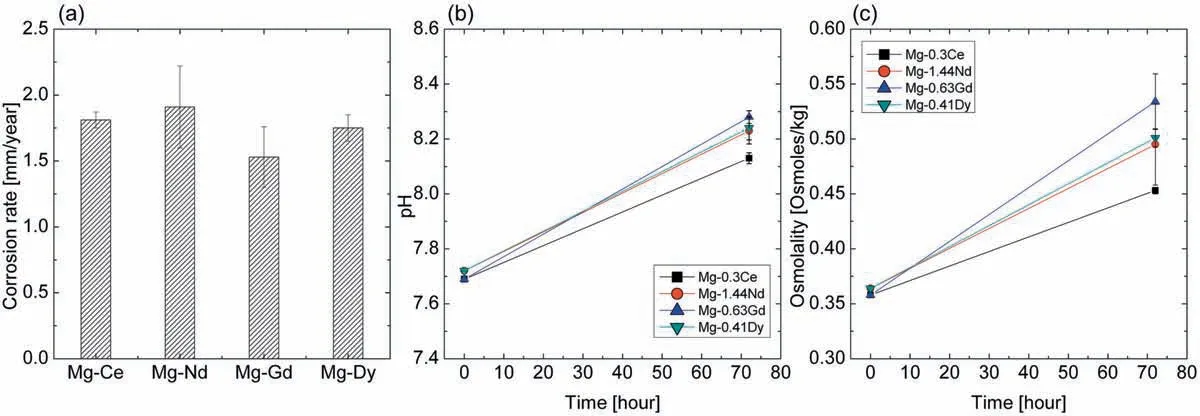
Fig. 3. (a) Corrosion rates, (b) evolution of pH and (c) osmolality in Mg-0.3Ce, Mg-1.44Nd, Mg-0.63Gd and Mg-0.41Dy alloys as function of immersion time in DMEM +10% FBS solution.
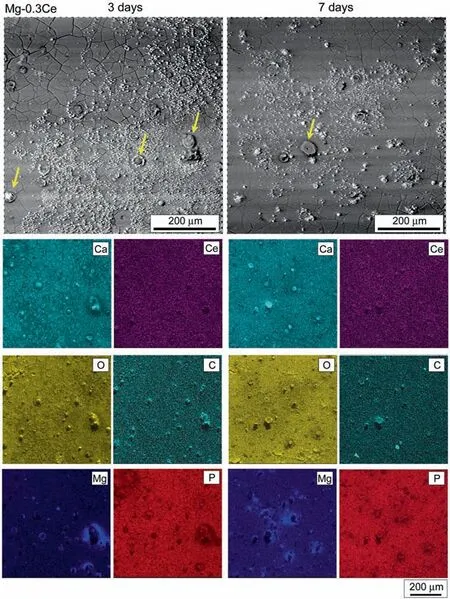
Fig.4. SEM micrograph showing the corrosion morphology with corresponding EDS maps for elements of Ca, Ce, O, C, Mg, P of Mg-0.3Ce alloy after 3 and 7 days of immersion in DMEM +10% FBS solution, respectively.
3.3. Corrosion morphology
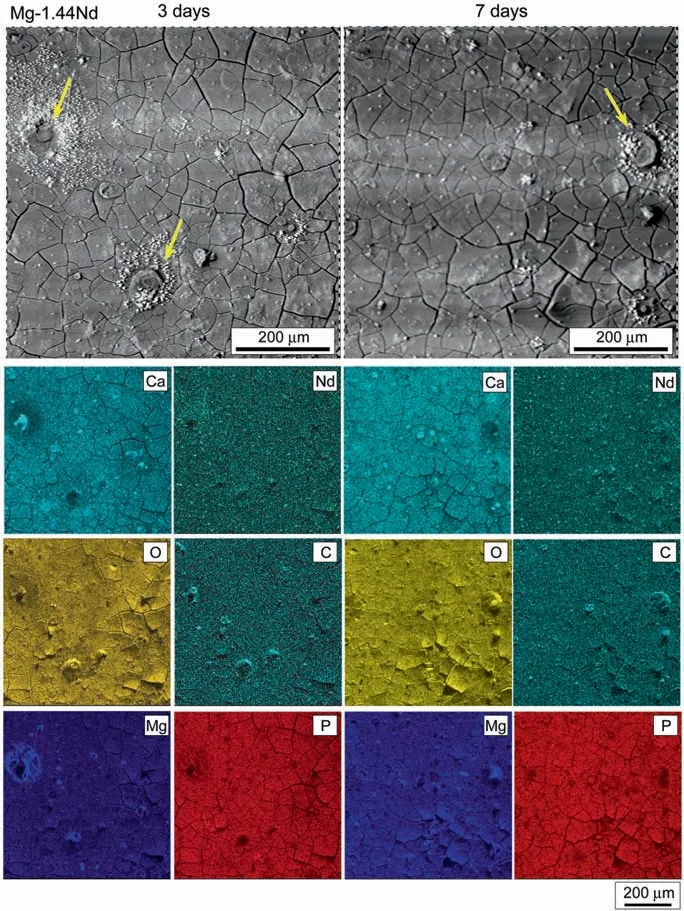
Fig.5. SEM micrograph showing the corrosion morphology with corresponding EDS maps for elements of Ca, Nd, O, C, Mg, P of Mg-1.44Nd alloy after 3 and 7 days of immersion in DMEM+10%FBS solution,respectively.
Figs.4-7 and Table 3 show the corrosion morphology with corresponding EDS maps of Mg-0.3Ce, Mg-1.44Nd, Mg-0.63Gd and Mg-0.41Dy alloys after 3 and 7 days of immersion in DMEM+10% FBS solution, respectively. After 3 days of immersion, the Mg-RE alloys presented similar morphology with the presence of cracks on the whole surfaces possibly due to the dehydration. Also, some white corrosion product was visible on the top of the surfaces. Table 3 revealed that the corrosion products were mainly composed of O, C, Ca, and Mg elements. Besides, small concentrations of RE elements were detected on the Mg-RE alloys surfaces.The corrosion morphology seemed to be uniform, except for Mg-0.3Ce and Mg-1.44Nd alloys where some pitting corrosion could be noticed as indicated by the arrows. The elemental maps demonstrated that the Mg accumulated around the pits due to the dissolution of Mg matrix while, the pits were rich of O, C and small amount of Ca element. Contrary to the Mg-0.63Gd and Mg-0.41Dy alloys the S element was absent in both surfaces of Mg-0.3Ce and Mg-1.44Nd alloys.It can be speculated that the presence of S could improve the corrosion resistance of Mg-RE alloys. The corrosion morphology remained similar on the Mg-RE alloys surfaces after immersion of 7 days, except for the Mg-0.63Gd alloy where a completely different morphology could be noticed in Fig. 6. Table 3 indicated that the amount P and Gd elements decreased significantl after 7 days of immersion. It is obvious from the high magnificatio morphology (Fig. 6) that the corrosion product had needle-like morphology with ~1.2μm of length and seemed to interweave each other. Similar corrosion morphology was mainly reported in Mg-based alloys and it was assumed that the corrosion product was more protective when the needles particles are smaller and denser [12].

Fig.6. SEM micrograph showing the corrosion morphology with corresponding EDS maps for elements of Ca, Gd, O, C, Mg, P and S of Mg-0.63Gd alloy after 3 and 7 days of immersion in DMEM +10% FBS solution, respectively.

Table 3 Results of EDS analysis for the investigated Mg-RE alloys.

Fig.7. SEM micrograph showing the corrosion morphology with corresponding EDS maps for elements of Ca, Dy, O, C, Mg, P and S of Mg-0.41Dy alloy after 3 and 7 days of immersion in DMEM +10% FBS solution, respectively.
3.4. Cytotoxicity test
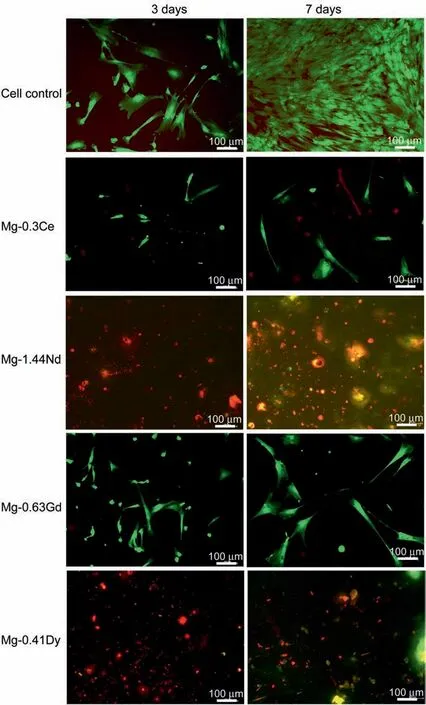
Fig. 8. Fluorescence images of live/dead staining for cell after incubation for 3 and 7 days on the investigated Mg-RE alloys. Green and red colours represent alive and dead cells, respectively.
Fig. 8 presents representative fluorescenc images of live/dead staining after 3 and 7 days on the investigated Mg-RE alloys, respectively. Green and red colours represent alive and dead cells,respectively.As can be seen,several green and few red cells could be seen on the surface of Mg-0.63Gd and Mg-0.3Ce alloys after 3 and 7 days. Although, hardly no cell can be found on the surfaces of Mg-1.44Nd and Mg-0.41Dy alloys indicating the toxicity of both alloys. As it can be seen on Fig. 9, both alloys were still reactive (gas bubble formation).
4. Discussion
4.1. Corrosion process
The corrosion process of Mg-based alloy in aqueous solution occurs following the reactions [40]:
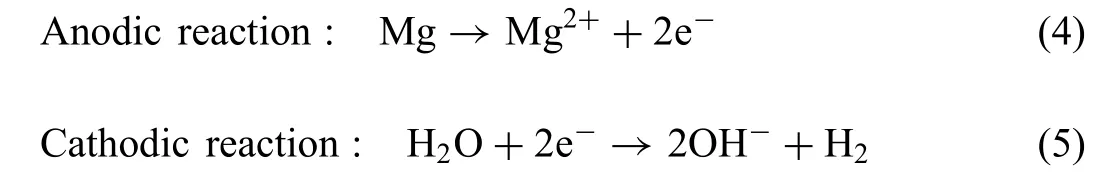
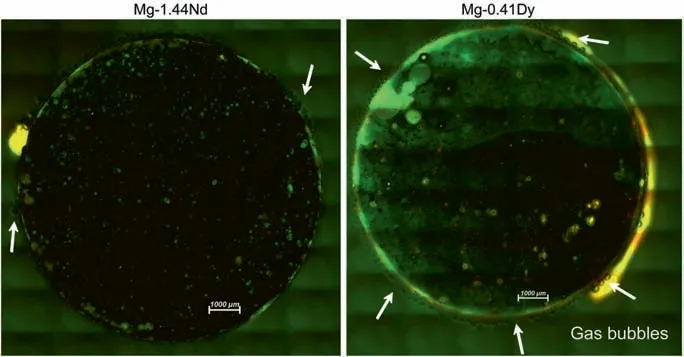
Fig. 9. Release of Gas bubbles from the Mg-1.44Nd and Mg-0.41Dy alloys after 7 days of incubation.

According to these reactions, it is expected that Nyquist plots contain two capacitive loop, one for the formation of corrosion product Mg(OH2) Eq. (6)) and the second one for the formation of double layer on the sample surface (Eqs. (4)and (5). However, in the present study the Nyquist plot for all investigated Mg-RE alloy exhibits three capacitive loops(Fig. 1). The formation of the third capacitive loop was attributed to the formation for different corrosion product layer on the sample alloy. It was shown that the precipitation of Ca3Mg3(PO4)4phase could occur when the Mg-based alloys are immersed in solution contain already Ca and P ions following the reaction [41]:

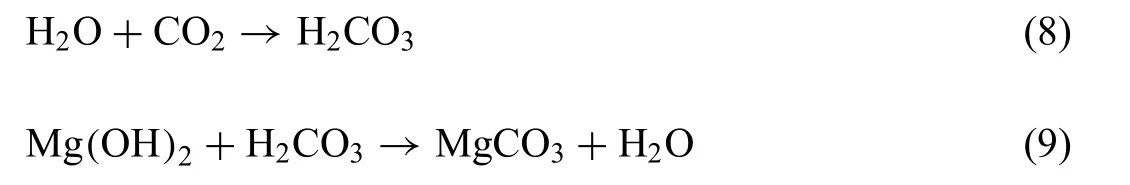
This is in good agreement with the results of the corrosion morphology in which a high P and Ca contents were found on the surface of Mg-RE alloys (Figs. 4-7 and Table 3). Moreover,the corrosion morphology indicated the presence of high contain of C and O element reflectin the possible formation of MgCO3component. The presence of MgCO3component was reported on Mg-based alloys and it was shown that its thickness increases with increasing immersion time [42,43].The formation of MgCO3component is due to the presence of CO2following the reactions [43]:
However, the amount of C and O seemed to be stable(Table 3)and unchanged with increasing immersion time from 3 to 7 days, except for Mg-0.63Gd alloy in which the concentration of C increased from 12.86 to 28.15%. The results of the corrosion morphology indicated that RE elements also contributed to the formation of corrosion products. However,the evolution of electrochemical test and weight loss indicate that Mg-RE alloy reacted differently.The corrosion resistance obtained from the Tafel and Nyquist curves increased in the following order: Mg-0.41Dy <Mg-0.63Gd <Mg-0.3Ce <Mg-1.44Nd. The sample photographs (Fig. 2) confirme the proper surface quality of Mg-0.63Gd and Mg-0.41Dy alloys after removing the corrosion products. In addition, the evolution of corrosion morphologies after immersion for 3 days showed a homogenous distribution of the different elements on the surface of Mg-0.63Gd and Mg-0.41Dy alloys contrary to the Mg-0.3 Ce and Mg-1.44Nd alloys’ surfaces where some pitting corrosion was noticed (Fig. 4-7). The occurrence of pitting corrosion in the Mg-1.44Nd alloy could be attributed to the presence of relatively high amount of two different second particles (Mg12Nd and Mg24Nd5) as previously reported [12]. In addition, the large size of their particles may have also influence the alloy’s corrosion mechanism. It was found that the corrosion resistance of Mg-Y alloy decreases with increasing amount of Mg24Y5phase [44]. It was demonstrated that particles containing Ce have less negative effect on the corrosion than particles with Nd [13]. The as-cast microstructure of the Mg-0.3Ce alloy exhibits much grain than the other Mg-RE alloys and thus more grains boundaries[12].In this case, the grains boundaries seemed to be responsible for the pitting corrosion in the Mg-0.3Ce alloy. It is known that grain boundaries are more corrosion active than the bulk[45]. Owing to the high solubility of Gd and Dy elements in the Mg matrix, it was previously reported that the metastable nature of Mg12Gd and Mg24Dy5phases in the present Mg-0.63Gd and Mg-0.41Dy alloys will have less effect against corrosion than the stable one like formed in the Mg-1.44Nd alloy [12]. The increase of pH value would modify Mg solubility, causing a more stable protective corrosion layer and thus decrease of the corrosion rate [46]. This statement is in good agreement with our results where the Mg-0.63Gd alloy exhibits the highest pH value as shown in Fig. 3(b).
The weight loss rate results seem to be in good agreement with the electrochemical tests, except for Mg-0.63Gd alloy was found lower than the Mg-0.41Dy alloy. It was observed that the corrosion resistance of Mg-light RE alloys(Ce, Nd) in Hank’s solution was generally better than Mgheavy RE alloys(Gd and Dy)[47].In contrast,the present results show a reversed behaviour where the heavy RE elements have better corrosion resistance in DMEM solution. Similar tendency was reported for the same as-cast Mg-RE alloys(Mg-0.41Dy <Mg-0.63Gd <Mg-0.3Ce <Mg-1.44Nd) in 3.5% NaCl solution [12]. Several researches are f on Dy and Gd as alloying elements to Mg matrix for biomedical application [15,18,42,48-51].
However, the corrosion rates of the investigated Mg-RE alloys were higher than pure Mg (~1mm/year) in similar condition i.e. immersed for 3 days in DMEM+10% FBS solution [42]. Apparently, the corrosion rate of the present Mg-0.41Dy and Mg-0.63Gd alloys is higher from Mg-10Dy(~0.56mm/year) [42] and Mg-10Gd (~0.36mm/year) alloy [52] with higher contain of RE elements. In contrast,the corrosion rate of Mg-1.44Nd alloy (1.91mm/year) was found similar to the Mg-1Nd alloy in DMEM solution(~1.8mm/year) [52]. It was reported that the corrosion rate of Mg-1Ce alloy was about 3.12mm/year in DMEM solution much higher than found in the present Mg-0.3Ce alloy(~1.8mm/year) [52]. In fact, the presence of FBS in the solution decreased the corrosion rate in various Mg based alloys due to the presence of protein which lead to the formation of more protective fil [53,54]. The high corrosion rate of Mg-0.63Gd and Mg-0.41Dy alloys compared to the literature was most probably due to the as-cast state of the present alloys and the presence of second phases. Generally, it was reported that the presence of second phases or precipitation decreases the corrosion resistance by acting as galvanic couple with the Mg matrix (pitting corrosion) and consequently increases the corrosion rate in the Mg-RE alloys [15]. Furthermore, the excellent corrosion resistances for the Mg-RE alloys were mostly reported after heat treatments which usually result to the dissolution of second phases [15,18,42].However, it is worth mentioning that the presence of second particles in all investigated Mg-RE alloy do not shows a severe galvanic corrosion effect as demonstrated by the electrochemical tests and the corrosion morphology. This is in good agreement with the speculation that the galvanic corrosion due to the precipitation is more pronounce in solutions with high concentration of chloride(Cl)such as NaCl solution compared to the DMEM solution [15].
4.2. Cytotoxicity
The results of dead/live straining demonstrated that the Mg-0.3Ce and Mg-0.63Gd alloys were rather cytocompatible unlike Mg-1.44Nd and Mg-0.41Dy alloys. However, Ce was reported to be highly cytotoxic compared to Nd [20,55].Also, the Mg-Dy alloys presented excellent cytocompatibility [42]. Besides, light RE elements (such as Ce and Nd)were reported to have cytotoxic effects already at lower concentrations than heavy (such as Gd and Dy) RE elements[20]. Apparently, this is not totally true in the case of the present study where the Mg-0.41Dy and Mg-1.44Nd alloys were found more toxic than Mg-0.3Ce alloy.
It should be taken into account that it is impossible to directly compare the reported results obtained for the same alloys due to the difference in the compositions of Mg-RE alloys, the elaboration processing and the experimental conditions as well as the evaluation methods.
However, based on the present results the difference could be most probably attributed to the as-cast condition of the Mg-RE alloys and the nature of corrosion products formed on the Mg-RE surfaces (Figs. 4-7). Only the Mg-0.63Gd alloy showed a drastic change on the corrosion morphology and composition as demonstrated in Fig. 6 and Table 3.
The increase of pH and osmolality during immersion test can affect also the cytotoxicity behaviour of the investigated Mg-RE alloys [19]. As can be seen in Fig. 3 the Mg-0.63Gd alloy shows the highest value for pH and osmolality as well. Nevertheless, the alloy exhibits the best cytocompatibility compared to the other investigated Mg-RE alloys. It is well known that increasing the pH value helps the corrosion product to be more protective. In fact, it was reported that variation pH is more critical than osmolality since only 10%of cell viability was reduced when the osmolality increased from 0.3 to 0.5 Osmol/kg [56]. Otherwise, the effect of pH on the viability of the cell depends strongly on the selected cell types [56]. For example, the alkaline environment (pH>8.5) causes the death of osteoblasts cells, while MC3T3-E1cells can grow in the same alkaline environment [56]. The choice of the applied cells is crucial for the in vitro analysis of cellular reactions [20].
In other hand, the electrochemical measurements (Fig. 1 and Table 2) showed that Mg-1.44Nd and Mg-0.41Dy alloys exhibit both an induction loop resulting from the increase of the dissolution of Mg metal and the release of Mg2+ions in the solution [57]:

It is interesting to note that the reactivity of RE element against the corrosion may not affect the cytotoxicity behaviour of the Mg-RE alloys since the present results demonstrated that the Mg-0.41Dy alloy was toxic even if its corrosion rate was about the same for the Mg-0.3Ce alloy.Nevertheless,further experiments(e.g.,heat treatment to lower the degradation rate followed by cytotoxicity assays) should be performed to confir this statement.
5. Conclusion
·The corrosion and degradation behaviour of binary Mg-0.3Ce, Mg-1.44Nd, Mg-0.63Gd and Mg-0.41Dy (wt%)were investigated. Also, the cytotoxicity effect of Mg-RE alloy was evaluated.
·The electrochemical and weight loss tests revealed that the alloys with heavy RE elements (Gd and Dy) exhibited the lowest corrosion rate compared to the alloys with light RE elements (Ce and Nd).
·The results showed that Mg-0.63Gd alloy was rather well tolerated by the cells despite its rather high degradation rate, followed by Mg-0.3Ce alloy. However, Mg-1.44Nd and Mg-0.41Dy alloys exhibit the most severe cytotoxicity.
Data availability
The raw/processed data required to reproduce these find ings cannot be shared at this time as the data also forms part of an ongoing study.
Declaration of Competing Interest
The authors declare that they have no conflic of interest.
Acknowledgments
The authors gratefully acknowledge Dr. Talal Al-Samman;Institute für Metallkunde und Metallphysik (IMM-RWTH),Aachen, Germany, for supplying the Mg-RE alloys. This work was supported by the PRFU national project under Grant Agreement No. B00L02UN280120180005.
杂志排行

Journal of Magnesium and Alloys的其它文章
- Mechanism of Mn on inhibiting Fe-caused magnesium corrosion
- Investigating TiO2-HA-PCL hybrid coating as an efficien corrosion resistant barrier of ZM21 Mg alloy✩
- Effect of yttrium modificatio on the corrosion behavior of AZ63 magnesium alloy in sodium chloride solution
- Effect of lithium content on the mechanical and corrosion behaviors of HCP binary Mg-Li alloys
- Poly caprolactone/titanium dioxide nanofibe coating on AM50 alloy for biomedical application
- New design principles for the bath towards chromate- and crack-free conversion coatings on magnesium alloys