Evaluation of the use of sublevel open stoping in the mining of moderately dipping medium-thick orebodies
2021-04-08ShuiXuRuiyuLingFidelisSuorineniYunhuiLi
Shui Xu,Ruiyu Ling,Fidelis T.Suorineni,Yunhui Li
a Key Laboratory of Ministry of Education on Safe Mining of Deep Metal Mines,Northeastern University,Shenyang 110819,China
b School of Mining and Geosciences,Nazarbayev University,Astana 010000,Kazakhstan
c School of Natural Resources and Civil Engineering,Northeastern University,Shenyang 110819,China
Keywords:Moderately dipping medium-thick orebody Sublevel open stoping Fan blastholes Ore recovery Backpropagation neural network
ABSTRACT The flow of blasted ore during mining of moderately dipping medium-thick orebodies is a challenge.Selecting a suitable mining system for such ore bodies is difficult.This paper proposes a diamond layout sublevel open stoping system using fan blastholes with backfilling to mine such orebodies.To evaluate the performance of system the relationships between ore recovery and stope footwall dip angle,footwall surface roughness,drawpoint spacing and production blast ring burden were investigated.An ore recovery data set from 81 laboratory physical model experiments was established from combinations of the listed factors.Various modules in a back propagation neural network structure were compared,and an optimal network structure identified.An ore recovery backpropagation neural network (BPNN) forecast model was developed.Using the model and sensitivity analysis of the factors affecting the proposed open stope mining system,the significance of each factor on ore recovery was studied.The study results were applied to a case study at the Shandong Gold Group Jiaojia Gold Mine.The results showed that the application of a BPNN and sensitivity analysis models for ore recovery prediction in the proposed mining system and field experimental results confirm that the suggested mining method is feasible.
1.Introduction
An orebody that has a dip angle of 20°-50°and a thickness of 5-15 m is characterized as a moderately dipping medium-thick orebody [1].The dip classification and thickness classification of the orebody is shown in Tables 1 and 2,respectively.Suorineni [2]acknowledged that these classifications may differ depending on the author,nationality,and preference.For example,the orebody of dip between 20° and 45° and a thickness of 1.8-4.6 m may be classified as moderately dipping medium-thick orebody [3].The classification used in this paper depends on the University of British Columbia (UBC) mining method selection algorithm [4,5].
Moderately dipping medium-thick orebodies constitute a significant proportion of proven orebodies worldwide.According to mineral statistics,70% of phosphate ore,30% of gold ore,18% of iron ore,and 5%-9% of other non-ferrous metal orebodies may be classified as moderately dipping medium-thick orebodies [6].When the orebody dip is <50°(typical angle of sliding of the broken muck is between 35° and 45°),the blasted muck cannot flow by itself under the influence of gravity during the mining process,and an external force is required for muck movement.When the orebody dip is greater than 20°,trackless equipment,such as load-haul-dumps (LHDs),cannot enter the stope due to traction limitations.Ore transport in moderately dipping orebody mining relies mainly on the electric scraper or an auxiliary recovery method such as the construction of an inclined orepass in the footwall rock [7]or slusher methods.These methods place limitations on automation and production efficiency,and result in high workloads and cost.In addition,during the mining process of moderately dipping medium-thick orebodies,the excavated void is large with a low floor to roof height that is a hazard.Thus,moderately dipping medium-thick orebodies are globally considered difficult orebodies for safe and efficient mining.
Among the currently used methods for moderately dipping medium-thick orebody mining,the room and pillar mining method accounts for 55%of cases,whereas the inclined drawpoint in footwall method of block caving [8],and the cut and fill method,account for approximately 18%and 24%of the cases[9,10],respectively.Issues of low production capacity and relatively poor safety appear in all these methods.This is because all the methods mentioned (classified as entry mining methods) except block caving require workers to enter and conduct operational activities (e.g.drilling,blasting,mucking,and ground support installation)in the stopes and have long exposure times to hazards compared to nonentry mining methods such as open stoping where workers do not enter the stopes.In the proposed diamond layout sublevel open stoping(DLSOS)mining system,the workers drill from a supported drift outside the stope and the operation is relatively safer than that of the drift-and-fill mining system which requires workers to work inside the stope.

Table 1 Orebody dip classification [4].

Table 2 Orebody thickness classification [4].
2.Drift-and-fill mining system
The mine under study currently employs the overhand driftand-fill mining system.At this mine,the orebody is extracted from bottom-up,with cut heights of 3-4 m and drift widths of 3-4 m.Fig.1 shows a schematic of the drift-and-fill method and backfill placement practice and sequence as used in the case study mine in China.In this method,headings are driven along the hangingwall contact for access to the stopes.In Fig.1 the orebody is divided into horizontal cuts with 3 m heights and 3-4 m widths.The drifts in each horizon are mined as primary and secondary drifts labelled 1 and 2 respectively in Fig.1.After the primary drifts being mined,they are backfilled with 10% cement content to a height of 2.5 m and the top 0.5-m void is then filled with 20% cement content backfill.The secondary drifts after extraction are backfilled with uncemented tailings to heights of 2.5 m from the floor and the remaining 0.5-m void is filled with 20% cement contend backfill.The use of higher strength backfill in the primary drifts allows mining of the secondary drifts safely with less dilution from backfill damage in these stopes.
In the drift-and-fill method (see Fig.1),the volume of backfills with 20%,10%,and 0% cement content account for 16.7%,41.65%,and 41.65%of the total backfill volume,respectively.It is estimated that the total mine fill cost is about 8.93 $/m3,and from this total amount,16.5% is the fill cost with 20% cement content.

Fig.1.Schematic of the drift-and-fill method in the case study mine showing the backfill types and sequence of placement.
The 10%and 20%cement content backfill used at the mine may be considered expensive at a glance.However,5%-15%and 3%-10%cement contents backfill are respectively used at Macassa Mine and Red Lake Campbell Mine,both located in Canada[11].Considering that labour cost is relatively higher in Canada than that in China,one would agree that the cement ratios of 5%-20% backfill are not out of the ordinary in China economically.
3.The proposed adapted mining method for moderately dipping medium-thick orebodies
To address problems of low productivity,operational efficiency,and relative longer hazard exposure for workers in the drift-andfill mining,a DLSOS (Fig.2) using fan blastholes with backfilling is adapted in this paper for the mining of moderately dipping medium-thick orebodies such as in the case study mine.Fig.2 is a 3D view of the proposed method and the sectional views are shown in Fig.3.
In the proposed mining system,the orebody is divided into sublevels,and the sublevels are extracted from bottom-up.The sublevel rectangular prism blocks are divided into diamond shaped stoping blocks in a sectional view (Fig.3),which are mined in two steps.The first step involves mining and backfilling the lower stope (LS).In the second step,the upper stope (US) is then mined.
The mining involves the construction of a haulage drift in the footwall host rock from a lower sublevel.From the haulage drift(Fig.3) crosscuts are developed to the orebody diamond-shaped stoping blocks.A diagonal slot raise (Fig.3) is developed at the boundary of the two diamond-shaped stoping blocks.The slot raise serves as free space for the production blasting.The blasted muck is transported from both ends of the stope to the sublevel orepass by LHD.Following the development of the slot raise,fan layout blastholes are drilled from a production access drift.When the lower stoping block is completely mined and muck drawn,filling pipes are installed via the upper sublevel filling drift (Fig.3).The upper stope in the inter-sublevel rectangular stoping block is extracted after mining and backfilling the lower stope.
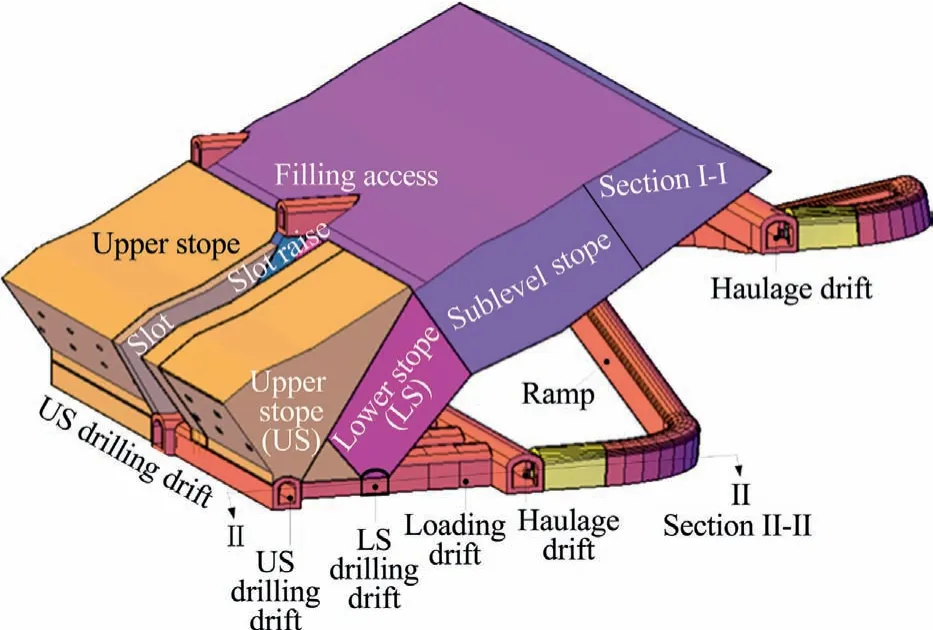
Fig.2.3D model of the DLSOS mining system.
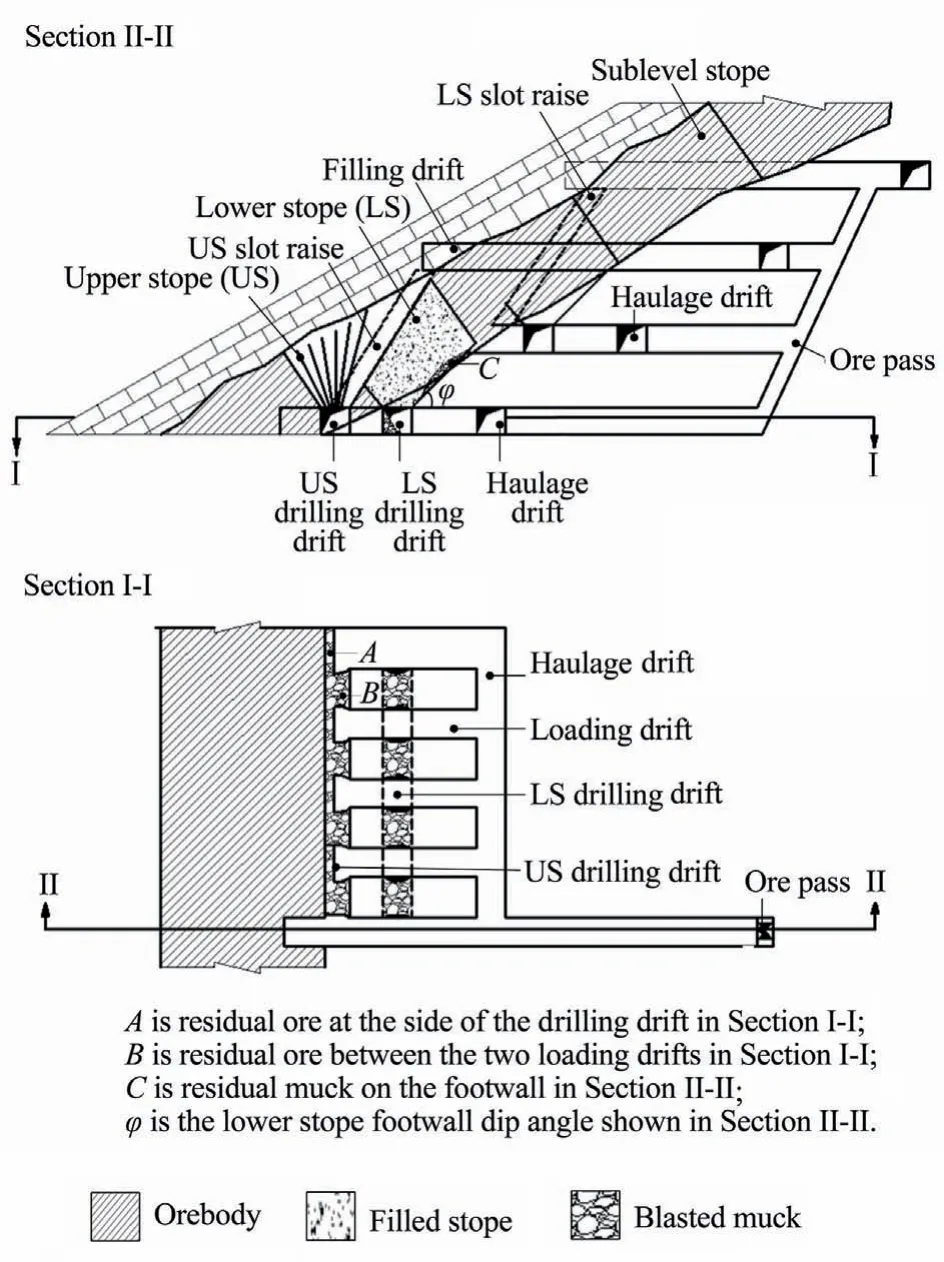
Fig.3.Sectional views of the DLSOS mining system with backfilling.
Mining of the upper stope requires mining through backfill in the lower stope in the proposed DLSOS mining system.To do this safely,the mining is done in two mining steps.In the first step,the bottom stope is mined first and filled with 20%cement content to a height of 5 m from the floor,and the upper part is filled with 10% cement content fill.In the second step the upper stope is mined by drifting through the 20% cement content backfill.After mining the upper stope,it is backfilled with 5%cement content fill material.Because the operational efficiency is increased in the proposed DLSOS mining system,the overall cost of filling is reduced.The 20%cement content backfill costs 11.43$/m3,10%cement content fill cost is 7.86$/m3,5%cement content cost is 5.86$/m3,and uncemented tailings(not used in the DLSOS)cost is 4.71$/m3.The overall cost of backfill in the DLSOS mining system is 7.25 $/m3.Fig.4 shows the backfill application in the DLSOS mining system.In Fig.4 the backfill proportions by volume of stope filled with each type of backfill are 20%cement content 12.8%and 10%cement content fill material is 34.1%for the lower stope;and the proportion of 5% cement fill material is 53.1%.Table 3 compares the cemented backfill types proportions by volume and cost used in the driftand-fill mining system at the case study mine and in the proposed DLSOS mining system.
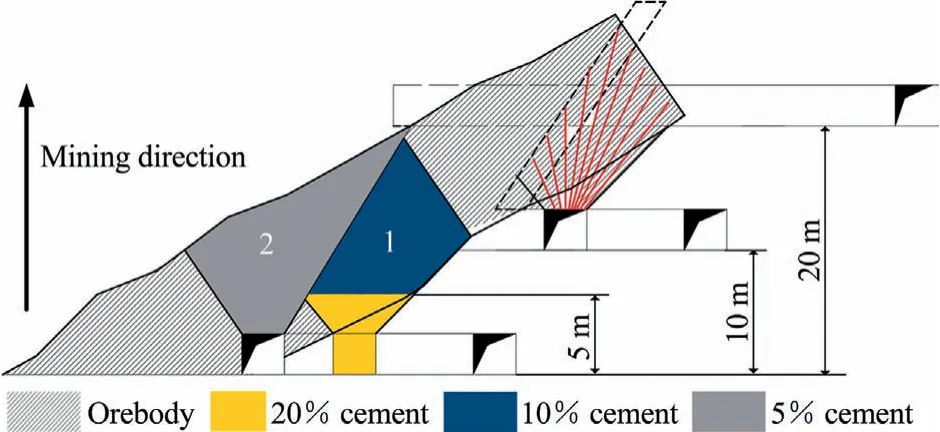
Fig.4.Backfill application in the proposed DLSOS mining system.
Alternative to the drift development through the higher strength backfill,one could install an Armco culvert (https://obobettermann.com/armco/market-construction.php) to serve the same purpose.However,this option implies installing the culvert through the void after blasting,which has a safety risk.Based on this consideration,the installation of Armco culvert and filling the void with low strength cement backfill was rejected.The loading crosscut is extended towards the upper stope,and the upper stope production drilling drift is constructed.The same procedure is then used to recover the upper stope as for the lower stope.After mining the upper stope,the low strength backfill material with 5%cement is used for filling.
The sublevel open stoping using fan blastholes with backfilling changes the temporal and spatial sequence of traditional mining of moderately dipping medium-thick orebodies.This new mining system makes the use of gravity transport and trackless equipment for possible transportation,and solves the problem of inefficient blasted muck transportation in these orebodies.The application of sublevel open stoping using fan blastholes with backfilling improves the efficiency of mining moderately dipping orebodies by increasing production capacity,saving labour,and thereby reducing cost.In addition,operations in the drilling access drift greatly improve the safety of workers and equipment.
Based on the filling cost in Table 3,the DLSOS method is seen to be relatively cheaper (2.69 $/t) than that of the original drift-andfill mining system at the case study mine (Fig.5) which required the use of higher strength backfill at an overall cost of 3.31 $/t.
After application of the DLSOS mining method,the mining height was 20 m and only the lower 5 m stope height is filled with a 20% cement-tailing ratio,and the upper part is filled with a 10%cement-tailing ratio in the case of the lower stopes.The upper stopes are filled with 5% cement content fill.
The DLSOS system improved the filling efficiency and eliminated complexity of the filling process.Hence,the mining cost of the new system is relatively less than that of the previous drift and fill approach.Although the DLSOS mining system overcame the problems of transportation inefficiency,and safe recovery at a relatively lower cost in traditionally moderately dipping medium-thick orebodies,the method has some drawbacks such as retention of residual muck on the footwall surface during the production process.The volume of residual muck retained is constrained by the footwall dip angle and roughness of the stope footwall surface labelled A as shown in Fig.3.First,the muck cannot be fully recovered,which leads to some ore loss.Second,when using trackless equipment to remove the muck,the muck recovery is influenced by the drawpoint interval and the ring burden,which results in residual ore at the access drilling drift brow labelled B as shown in Fig.3,and at the end of the upper portion of the drift labelled C as shown in Fig.3.These factors impact the ore recovery when using the proposed method.
Methods for studying muck recovery include physical simulations (i.e.small-scale laboratory experiments) [7,12-15],numerical simulation [16,17],and full-scale on-site experiments [18-21].Physical simulation experiments are conducted on the principle of similar materials through the construction of scaled experimental models,simulations of the actual ore drawing process,and quantifying the ore recovery of different mining processes to obtain a comparison of different mining plans.Physical simulation experiments have become the most widely used method in the studies of ore recovery in mining[12-14].For example,the particle flow ellipsoid theory proposed by Janelid and Kvapil [13]was the result of physical simulation experiments.Subsequently,many researchers have studied the effects of the form of extraction of blasted muck under different boundary conditions,structural parameters in particle flow processes,blasting parameters,and fragment size distribution on ore recovery [12].However,when there are many factors involved in the simulation process,it requires the use of several factor configurations that can result in the number of physical experiments becoming increasingly high,and generally approaching an exponential function.In such a case,the experimental workload becomes time-consuming.Typically,therefore,physical experiments are only applied to the study of a small number of influencing factor scenarios.

Table 3 Comparison of drift-and-fill and DLSOS mining systems backfill economics material.
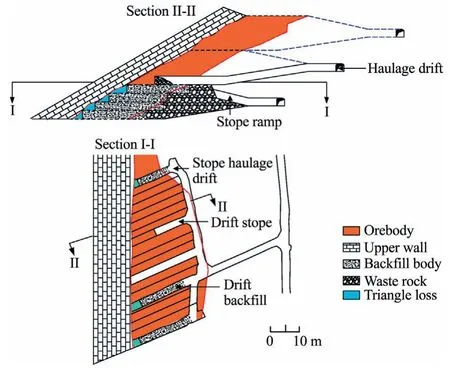
Fig.5.Section and plan views of the drift-and-fill mining system as used at the case study mine.
This paper studied the quantitative relationship between ore recovery in the DLSOS mining system and parameters,including the lower stope footwall dip angle,lower stope footwall surface roughness,drawpoint spacing,and blast ring burden using physical laboratory experiments.A backpropagation neural network(BPNN) data analysis procedure was then developed based on the physical laboratory experiments.
The BPNN is a multi-layer feedforward neural network trained according to the error back propagation algorithm [22].BPNN is an artificial neural network (ANN)-based powerful technique which is used for detection of the intrusion activity.The basic component of BPNN is the neuron which stores and processes information.The BPNN is a supervised learning algorithm.The main idea of BPNN is to input training samples and use the back-propagation algorithm to repeatedly adjust and train the weights and deviations of the network to make the output vector as close as possible to the expected vector.When the sum of root mean square errors of the output layer of the network is less than the specified error,the training is completed,and the weights and deviations of the network are saved.BPNN has strong nonlinear mapping ability and flexible network structure and is the most widely used neural network.The BPNN has been used in mining research in the literatures [23-26]and discussed further in Section 5.
The physical model for the laboratory experiment was designed to mimic the field scale mine using the material similarity concept.A forecast model with regards to the ore recovery,and the abovementioned factors was developed using the BPNN.Based on the developed model and applied single-factor sensitivity analysis,the significance of each factor affecting the ore recovery is presented and discussed.Finally,the results of the study were applied to an actual field experimental stope to provide practical support for the structural parameter optimization from theoretical experiments,for ore recovery prediction,and for causal analysis of ore loss as basis for suggested ore recovery improvement planning.
4.Evaluation of the proposed adapted mining method
4.1.Construction of the laboratory physical simulation model
The goal of the laboratory physical experiment was to establish a quantitative relationship between ore recovery and lower stope footwall dip angle,footwall surface roughness,drawpoint spacing,and production blast ring burden.Based on the basic assumptions of material similarity,the similarity conditions of this physical simulation experiment were identified as follows:(1) the model geometric similarity,including the model dimension,structure,and fragmentation size composition were established based on the similitude theory;(2) the model backfill material density was the same as the actual backfill loose density;(3) the time scale was in correspondence with the length scale;(4) the stress scale was in correspondence with the length scale;(5)the same residual friction angle as for the blasted ore was used;and (6) the blasted ore friction angle was the same as the loose material internal friction angle [12,14].
To guarantee that the results of a physical model can be directly scaled up,the model must be fully similar to the mine scale [14].Physical models and full-scale models cannot meet the similarity in all aspects.Geometric similarity is the most important and the easiest to implement in a physical ore drawing simulation model.
In this research,the following scaling measures were taken.
For the length scale CL,

where Lmodelis the length of the physical model;Lminethe length of the mine;and CLand k the length scales.
For the mass scale Cm,

where mmodelis the mass of the physical model;mminethe mass of the mine;and Cmand k3the mass scales.Therefore,the ratio of model ore mass to mine ore mass is k3.
For the time scale Ct,by controlling the drawing rate,it is possible to ensure the similarity of granular particle movement process.In the process of drawing,the movement distance of particles in the model is l in unit time.The particle motion process is the same,and the acceleration should be the same.Thus

where amodelis the acceleration of the physical model;aminethe acceleration of the mine;tmodelthe time of the draw process for the physical model;tminethe time of the draw process for the mine;and Ctandthe time scales.The tminesatisfies the similarity coefficient
For the stress scale Cσ,according to the similitude experimental conditions,the relationships between stress scale Cσ,length scale CL,and density scale Cρ are given in Eq.(4).

In Eq.(4),because the ore from the mine was used in the laboratory physical model experiment,Cρ=1 and Eq.(4) simplifies to Cσ=CL.
The DLSOS stoping method is an adapted sublevel open stoping method with backfill.In this method,the stoping sequence is from bottom-up,and therefore,the blasted ore is mucked under the protection of the upper stope pillar.The muck is not affected by the weight of overlying strata,and the stress is not transferred.Therefore,it is not necessary to apply the corresponding load to the upper part of the physical model.For operational convenience of the experiment,the similarity ratio of the physical simulation experiment was set to 1:50.To establish this ratio,the ore was retrieved from the mine site and crushed,and the mixture of the crushed material was prepared with reference to the survey results of blasted ore fragment size distribution at the mine site.The particle size distribution of the field surveyed fragmentation which was the same as that used in the laboratory experiments is shown in Fig.6.
The laboratory physical model was constructed to ensure that the simulations in the experimental model design,structure and scheme were consistent with the field practice at the mine site.The bulk material packing density in the laboratory experiment was the same as the loose density of blasted muck at the mine site.Finally,to simulate the scraper used at the mine,a scaled shovel was made for the laboratory experiment.The approach adopted ensured the laboratory physical experiment was like the field operations as observed.
The base of the laboratory physical model was constructed with iron materials except for the rock and ore veins,and the other parts were made of transparent acrylic plates to allow external observation of the movement of the muck in the process of ore drawing.Screws and grooves were used to assemble the various parts of the model to obtain the full 3D physical model shown in Fig.7.In summary,the model consisted of the floor,and lower and upper stopes.According to the foregoing discussion,the similarity ratio was 1:50,the length of the experimental stope was 30 m,the horizontal thickness was 30 m,and the sectional height was 20 m.The cross section of the drift in the experimental mined stope was 3.5 m × 3.3 m.Accordingly,the size of the model was 62 cm in length,60 cm in width,and 42 cm in height.The drift section was 7 cm wide and 6.6 cm in height in the physical model.
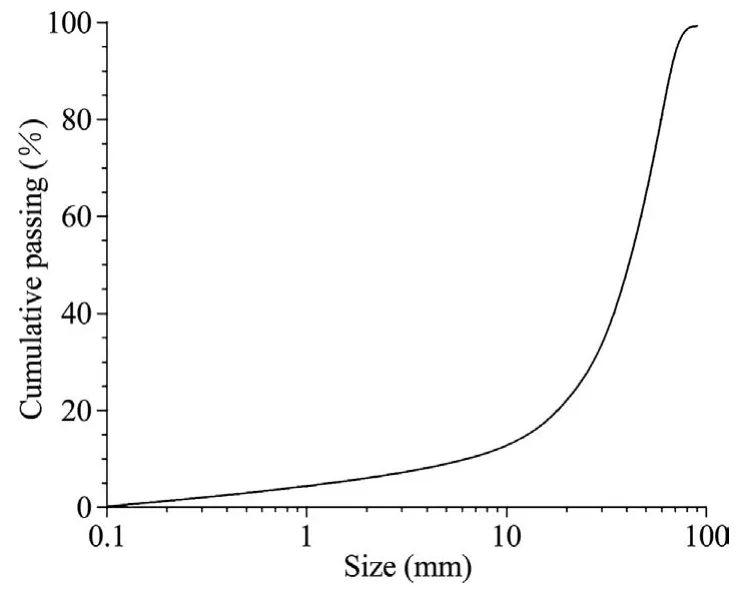
Fig.6.Particle size distribution curve of the mine ore muck that was used in the laboratory physical experiments.
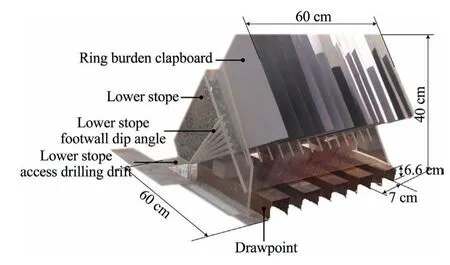
Fig.7.3D photograph of the laboratory physical experimental model showing the similitude dimensions.The scale is 1:50 relative to prototype.
4.2.Experimental data collection process
Each configuration was repeated twice to give a total of 162 experiments.The average outcome of each two identical experimental configurations was taken as the final result.
After assembling the physical model,a plate(referred to burden plate) is used to divide the inner space of the model into sections representing the burdens.In the experiment,burden plates were taken out to simulate the blasting operation.When the burden plate was withdrawn,the loose particles between the burden plates flow into the drilling drift and were drawn out.Therefore,the presence of the burden plate simulated different blasts.
The simulated ore was weighed and evenly loaded into the burdens.During the experiment,the ore-burden plates were drawn in sequence to simulate blasting in accordance with the steps set up in the simulation program.In the loading drift,small rakes with a grip length of 400 mm and a width of 50 mm were inserted 3 cm into the ore muck,and the ore was extracted evenly at full-face along the loading drift.The haulage was terminated when muck could no longer be extracted from the drawpoints.
During the experiment,fine sandpaper,coarse sandpaper,and mineral ore fragments were pasted on the model stope footwall surface to reflect different footwall surface roughness.For each case of simulated roughness,ore fragments were placed on top to simulate ore recovery under different footwall surface roughness conditions.The friction coefficients of the fine and coarse sandpapers,and ore fragments were determined by the inclined sliding experiments [27].The sandpaper to be tested was fixed on an inclined plane with an inclination angle of θ and the plane rotated on an axis until the paper started to slide.For friction coefficient of the ore fragments,standard cubes of 10 cm edge length with smooth surfaces and 1 kg in weight were placed on the inclined plane.The angle of the inclined plane was gradually increased and the angle at which sliding began was recorded.The maximum static friction force F of the sliding cube satisfies Eq.(5).

where G is the weight of mineral for the physical experiment;g the gravitational acceleration;m the mass of the mineral for the physical experiment;F the component of weight (i.e.static friction force);θ the incidence of the physical model;and μ the surface roughness of the physical model.
The frictional coefficients of the fine and coarse sandpapers,and ore particles were determined in this manner to be 0.45,0.70,and 0.95,respectively.The physical model experiment factors and values used are summarized in Table 4.Based on Table 4 we have fourfactors and each at three levels.Using factorial experimental design[28],we obtained 81(3×3×3×3)combinations(configurations) of experiments (Table 5).
The factorial experimental design approach was used so as to obtain sufficient data for the BPNN analysis.
4.3.Results of the laboratory physical model experiment
The physical model experiment results from the 81 experimental configurations are presented in Table 5.As shown in Fig.8a,ore draw increased to nearly 83.6% as the lower stope footwall dip angle increased to a maximum of 40°.As the footwall dip angle increased,the gravitational pull on the fragments increased to overcome the frictional resistance to the muck flow thereby increasing ore recovery.
The ore draw results for different footwall surface roughness represented by the footwall surface friction coefficient are shown in Fig.8b.As the footwall surface roughness friction coefficient increased from 0.45 to 0.95,the ore draw decreased from 90.21%to 83.61%.In the ore-drawing process,when the footwall surface was smooth with a friction coefficient of 0.45,the ore recovery was 8%-10% higher than when it was rough with a friction coefficient of 0.95.
The ore-drawing results for three different production blast ring burdens are shown in Fig.8c.With increase of the ring burden from 2 to 8 cm,corresponding to the true size of 1-4 cm in the mine,the ore draw decreased from 85.21% to 81.85%.Ore draw for 2 and 4 cm burdens was typically 3%-5%higher than that for 8 cm burden.Production blast ring burden determines the quality of fragmentation efficiency.Small burdens result in better fragmentations than larger burdens,and hence in better ore recovery in the former.
The relationship between drawpoint intervals and ore-draw as simulated for drawpoint spacings of 10,12,and 15 cm is shown in Fig.8d.The results indicated that the ore-draw (%) at the 10 cm drawpoint interval was higher than those at the 12 and 15 cm intervals.The remnant muck in the stope at the 10 cm drawpoint interval was less than those at the 12 and 15 cm intervals with the ore-draw(%)at the 10 cm interval being about 5%higher than that at the 12 cm interval.
5.Development of backpropagation neural network for ore recovery forecasting
5.1.Backpropagation neural network technique
An artificial neural network(ANN)is an information processing system that simulates human thought processes based on understanding the structure and function of the nervous system of the human brain[29].An ANN uses layered interconnections of a large number of simple neuron nodes to form a complex network through the study of a certain number of input samples to establish multi-parameter mapping relationships between the input sample and output target that have overall nonlinearity,a high degree of parallelism,good error tolerance,and strong adaptability.A back propagation neural network (BPNN) is the most mature and currently most widely applied network technique [30,31].
The core of BPNN is the backpropagation algorithm,which consists of forward information transmission and backward error transmission components.Input information is transmitted from the input layer to the output layer through hidden layers,and the state of a neuron node only influences the nodes in the next layer.If the output from the output layer fails to reach the expected value,the output layer error will be transmitted backwards.Through network connections,the error signal is backpropagated along the same connection path to modify the weight of each neuron node until the expected target is reached.
A BPNN has a strong generalization capability,and the constructed model can be expanded to learn and forecast new knowledge[32].For this reason,in the mining industry,BPNNs have been widely applied to mining method selection [33,34],rock mass parameter calculations[35],mining loss and degradation statistics[36],and blasting analysis in mines [37-39].
5.2.Neural network model
The neural network algorithm learning should use 90% of the samples to train the neural network model and 10%of the samples to test it [40].The data set used for the BPNN training and prediction (Table 5) was obtained from the laboratory physical ore flow simulation experiment.Based on Mladenov’s theory,out of the 81 items in the data set,72 were used for network training,among which 70% were for learning and 30% were for verification.The other nine items were used to verify the reliability of the trained BPNN predictive accuracy.
A three-layer BPNN structure was selected.The input layer contained four factors that were analyzed,and the output layer had only one element,the ore recovery percent in %.Thus,the neural network was denoted as 4-N-1.The structure of the neural network is shown in Fig.9.
The determination of the number (N) of hidden layer nodes in neural network training is a complex problem [41].It is generally believed that if the number of hidden layer nodes is too small,the network may not train at all or the network performance will be poor.If the number of hidden layer nodes is too large and the system error is reduced,the network training time will be prolonged.On the other hand,a small number of hidden layer nodes results in short training times but with large errors.
There are four methods for determining the number of hidden layer nodes.
Case 1:The relationship between the number of hidden layer nodes N and the number of input layer nodes I is

Case 2:Kolmogorov’s theorem shows that the number of hidden layer nodes N is

Case 3:The relationship between the number of hidden layer nodes N,the number of modes I,and output layer number a(a constant between 1 and 10) is

Case 4:The number of hidden layer nodes N(Eq.(9))should be less than (S -1) (where S is the number of training samples).Otherwise,the systematic error of the network model is indepen-dent of the characteristics of the training samples and tends to be zero,that is,the established network model has no generalization ability.
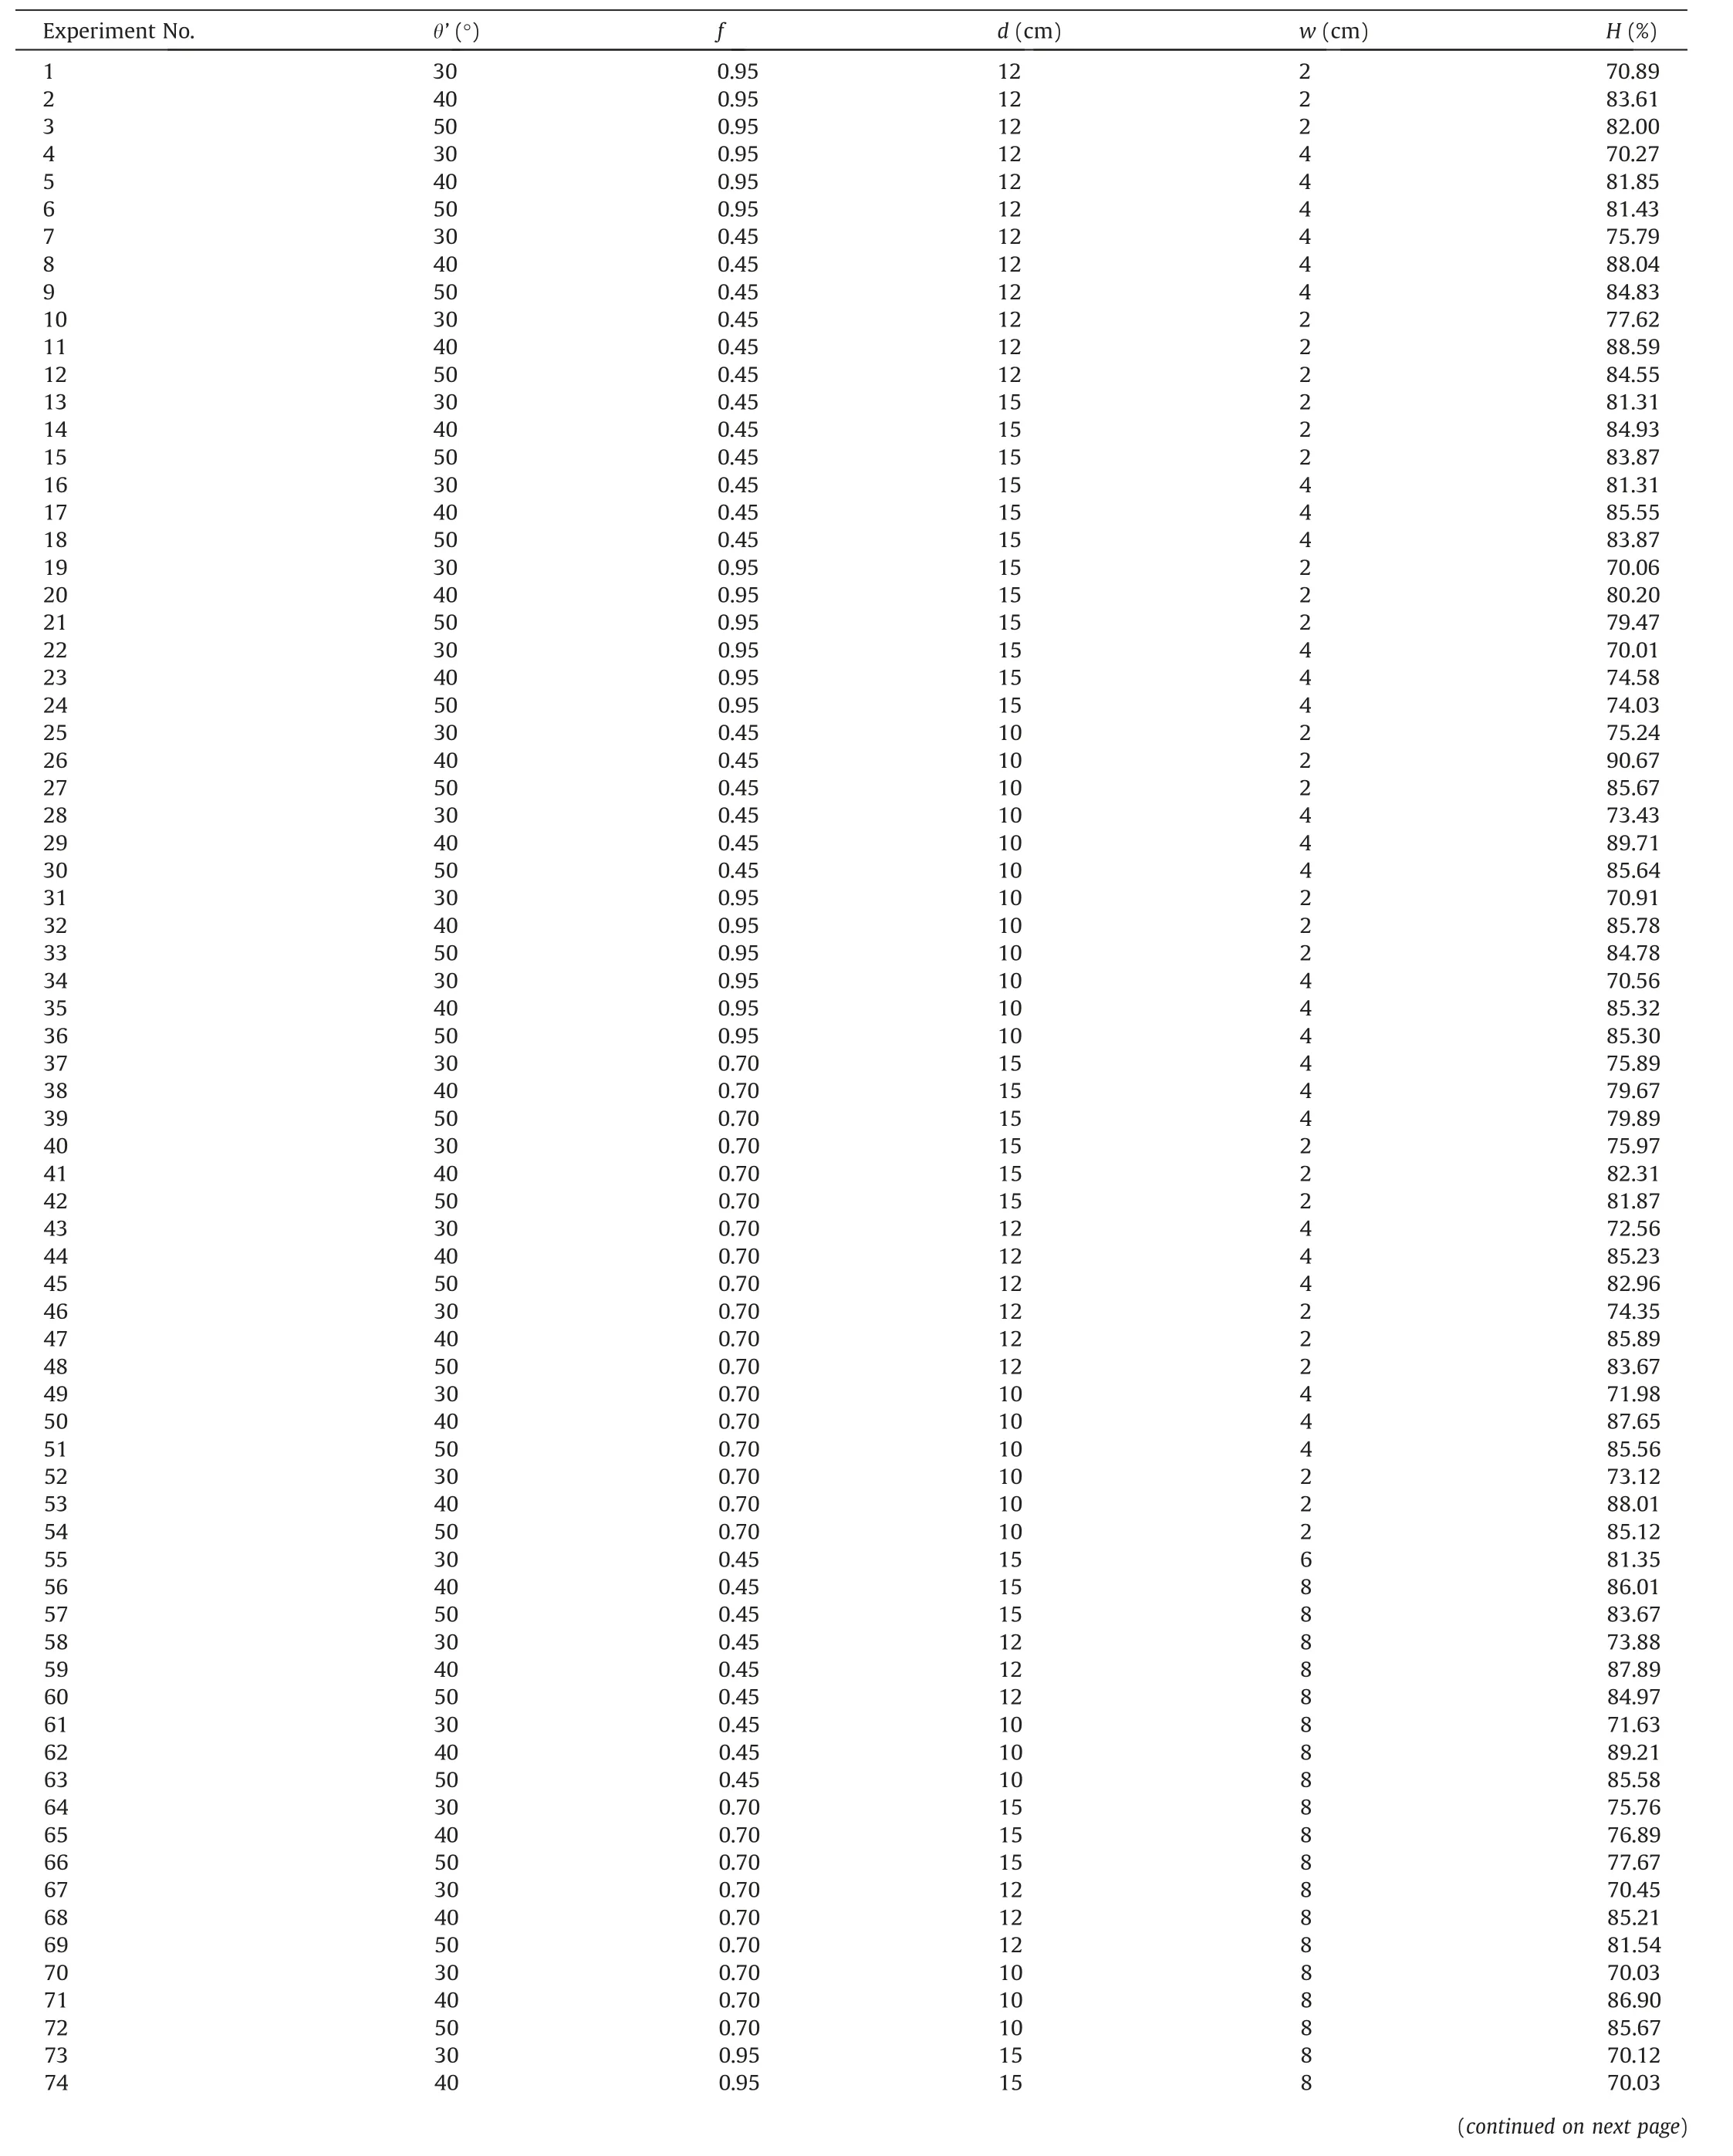
Table 5 Physical model experiment results.

Table 5(continued)

Fig.8.Relationship between ore recovery and the lower stope footwall dip angle,footwall surface roughness friction coefficient,rings burden,and drawpoint spacing.

where O is the number of output layer nodes;and k a constant value between 5 and 10.
In this research the number of input layer nodes I=4,the number of output layer nodes O=1,the total number of samples was 81 based on the factorial experimental design results in Table 5.Out of 81 results:50 were used in training the BPNN giving S=50;the number result used for process verification was 22;and the number of forecasting test samples was 9.Therefore,combined with the above five methods(cases 1-5),the lower limit of the number of hidden layer nodes was 9,the upper limit of the hidden layers was 50 when k takes the minimum value of 5;hence,the neuron nodes in the hidden layer were selected to be 10,15,20,25,30,35,40,45,and 50.
The transfer function may use TRANSIG,LOGSIG,or PURLIN[31],and the training function used TRAINLM,TRAINDX,or TRAINNDA [42].The learning function may use LEARNGDM or LEARNGD.The training parameters were as follows:epochs=10000,max fail=10000,Min grad=1e-10,mu=0.001,and mu dec=0.01.
The network was trained based on Matlab R2016b and its accuracy was assessed with respect to average absolute error(Eq.(11)),average relative error (Eq.(12)),and root mean square error (Eq.(13)) [43,44].
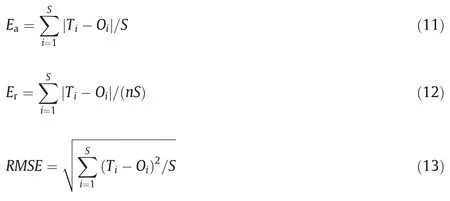
where Eais the mean absolute error;Erthe mean relative error;RMSE the root mean squared error;Tithe true value of the sample i;Oithe predicted value of the sample i;and n the number of samples.
The number of hidden layers,transfer function,learning function and training function affect the accuracy of BPNNs.The neuron nodes in the hidden layer were selected to be 10,15,20,25,30,35,40,45,and 50.The training function used TRAINLM,TRAINDX,or TRAINNDA.The learning function may use LEARNGDM or LEARNGD and the transfer function may use TANSIG,LOGSIG,and PURELIN for training.Therefore,in the design of the neural network structure,the variable factors and possible values are shown in Table 6.Table 6 shows the factors to be considered,their levels,and number of levels.SPSS orthogonal experimental design tool was used to determine the optimal number of neural network structure combinations and resulted in 27 experimental schemes as shown in Table 7.Based on Eqs.(11)-(13),the associated accuracies of each experimental scheme in predicting the ore recovery are calculated and included in Table 7.Table 7 shows that when the number of hidden layer nodes was 40,the absolute error of the network calculation was the lowest at 0.40,with a relative error of only 0.48,and a RMSE of 0.45.
5.3.Analysis of the neural network forecasting results
For the ore flow simulation experiment,the 40-node neural network (4-40-1) with the TRANINDX-LEARNGDM-TANSIG combination accuracy assessment results are better than those of the other node sizes as shown in Table 7.Hence,the 4-40-1 neural network model was used to forecast values for the selected 9 laboratory experimental configurations results.The forecasted and laboratory experimental results for the 9 cases are shown in Fig.10.The results of the physical simulation experiment and the BPNN forecast(Fig.10)are remarkably similar.The forecast results of different laboratory physical modelling experimental configurations fitted a linear regression correlation coefficient of 0.99,indicating a good match between the BP modelling and experimental results.
Fig.11 compares the forecasted and laboratory physical experiment results in terms of ore recovery percent and the errors in the predicted results.The error analysis results using different configurations (Fig.11) indicate that the forecasted values are very similar to the experimental values with the highest relative error being only 0.87.Thus,the BPNN model 4-40-1 can reliably predict the physical laboratory experiment results.This is significant as it shows that future productivity at the mine can be predicted and monitored using the BPNN rather than the physical model which is laborious and more time consuming.
6.Ore recovery sensitivity analysis
6.1.Principles of sensitivity analysis
In the study of an engineering problem,assuming a dependent variable Y,and n the influencing factors (independent variables),and Xisatisfy the relationship Y=f(Xi),where i=1,2,...,n.This analysis of the degree of variation of the dependent variable induced by changes in the independent variable Xiwithin a certain range is referred to as sensitivity analysis [45-47].

Table 6 Factors and their levels used in Synergetic Prover Augmenting Superposition with Sorts (SPASS) for determining number of experimental schemes.
The essence of sensitivity analysis is to individually change the numerical values of the independent variables within a certain range,to determine the degree of influence of the independent variables on the dependent variable.Among these variables,the factors for which a small change induces a large variation in the dependent variable are called the sensitive factors;otherwise,they are called insensitive factors.
Sensitivity analysis is widely applied in engineering practice.For example,Yu et al.conducted sensitivity analysis on slope stability factors based on roughness set theory,a neural network algorithm[48].A sensitivity entropy weight-based integrated attribute recognition assessment model that provided a new method for rockmass parameter sensitivity analysis was proposed by Huang et al.[49].Orthogonal experiment methods to analyse the comprehensive sensitivity of various factors in the studies of a drift collapse in an underground mine ore drawing system and for pillar stability were respectively proposed [50,51].
Sensitivity analysis based on reference value perturbation analysis has been widely applied due to its advantages of simplicity with practical results.The sensitivity calculation method used for this study is presented in Eq.(14).

where Z(X) is the sensitivity value corresponding to factor X;Γ the number of samples in the test sample set;Xithe i-th sample in the test sample set of factor X;Δithe perturbation value of the i-th sample;and ∀the selected neural network prediction model.
The sensitivity of the following factors on ore recovery was investigated:lower stope footwall dip angle,footwall surface roughness,drawpoint spacing,and production ring burden as listed in Table 8.The sensitivity of each of the four factors on ore recovery was evaluated at eight different levels.
6.2.Lower stope footwall geometry sensitivity analysis
In this study,the perturbation value method was selected for analysis of the data.According to a pre-set order,each factor was separately selected and assigned one of its eight levels values,with all other factors unaltered and its impact on the ore recovery evaluated.The procedure is continued for each of the eight values of the factor considered and for all the four factors.The four factors and the eight values for each of them were listed in Table 5.
According to the sensitivity analysis of the four factors,the lower stope footwall dip angle was first assessed,and the results are shown in Table 9.The sensitivity analysis cases for the other factors were remarkably similar to those in Table 9 and are not listed here.The eight results in Table 9 were used as input samples into the 4-40-1 neural network and the sensitivity analysis conducted.The resulting sensitivity of ore recovery to the four factors investigated are presented in Table 10.
As shown in Table 10,in a moderately dipping medium-thick orebody,sublevel stoping with fan blastholes in the physical simulation experiment,the dip of the footwall had the greatest impact on the ore recovery with a sensitivity of 3.736 and of the first order,followed by the drawpoint spacing with a sensitivity of 3.534 and of second order,then the footwall surface roughness with a sensitivity of 1.427 and the production ring burden having the least influence on ore recovery with a sensitivity of only 0.634.Therefore,when designing sublevel open stoping in moderately dipping medium-thick orebodies,a drawpoint spacing of 5.5 m,footwall surface roughness friction coefficient of 0.5,and a production ring burden of 2 m are suggested for optimum ore recovery.
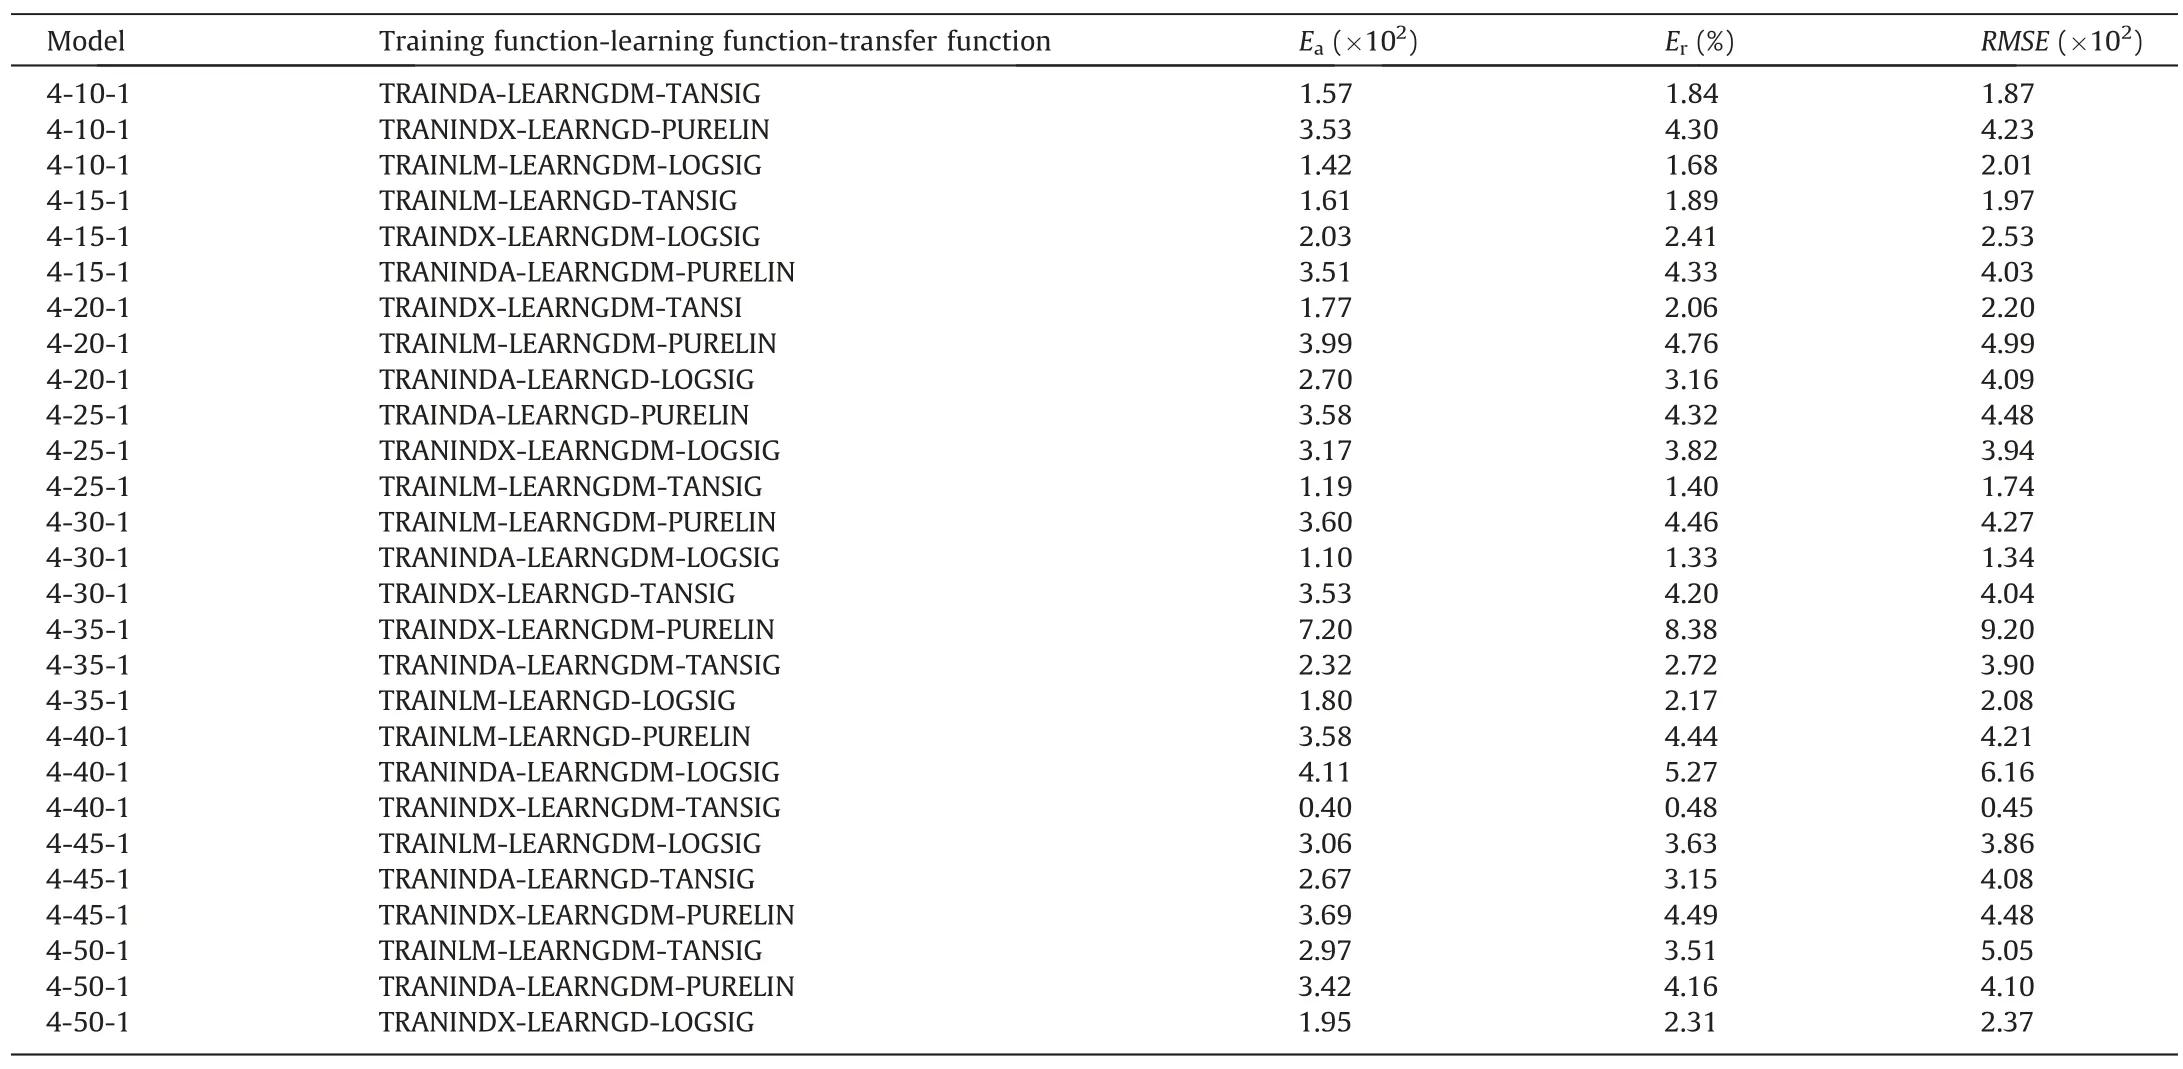
Table 7 Neural network experimental configurations and training results.
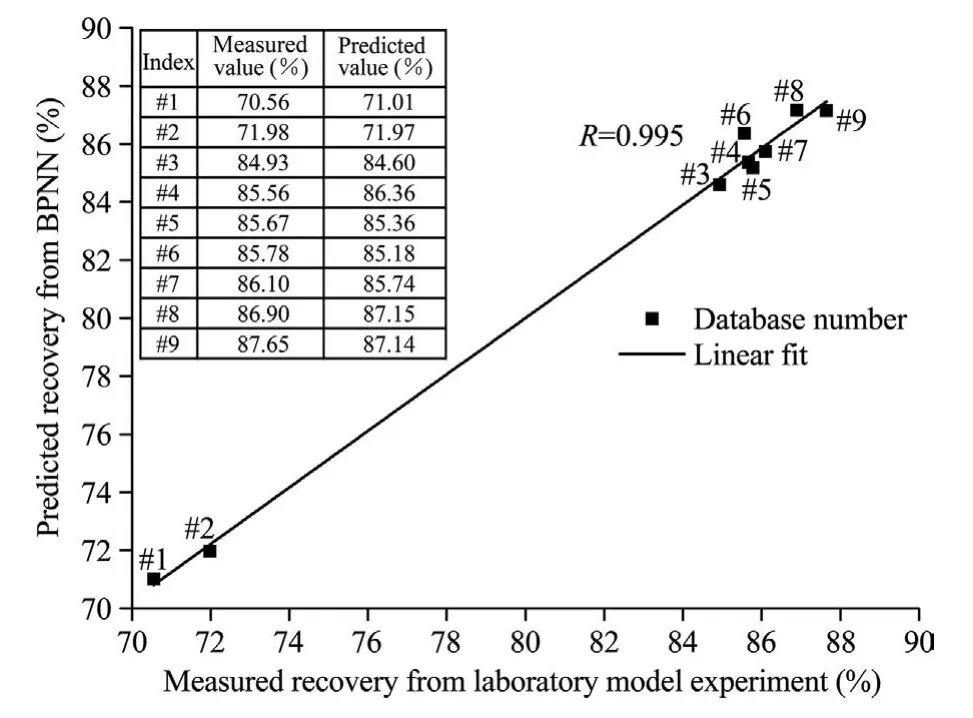
Fig.10.Relationships between neural network predicted ore recovery values and laboratory physical model measured experimental values.Numbers are experimental data set numbers.
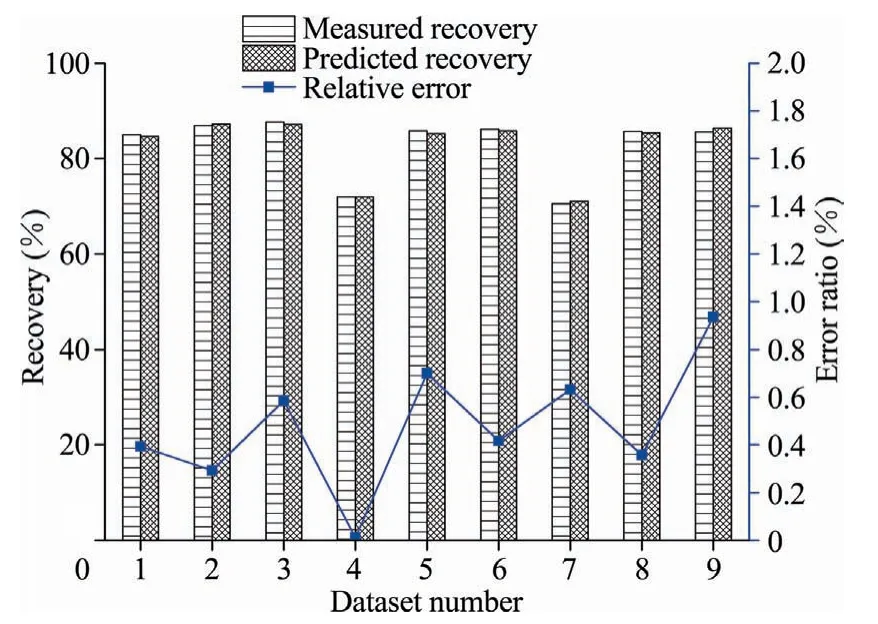
Fig.11.Comparative error analysis of the measured and predicted results.

Table 8 Sensitivity analysis configuration design cases.
6.3.Discussion of the sensitivity analysis results
6.3.1.Sensitivity analysis of the lower stope footwall dip angle
The impact of the lower stope footwall dip angle on the ore recovery is shown in Fig.12a.As the footwall dip angle increases,the ore recovery first increases to a maximum of 86% at 40° dip angle and generally stabilizes thereafter.The occurrence of this trend may be attributed to the fact that once the angle of sliding of the broken muck is exceeded,gravity effect on muck flow due to increases in the lower stope footwall dip angle is minimum.When the lower stope footwall dip angle decreases,the blasted muck movement to drawpoints decreases due to increased resistance to flow.When the lower stope footwall dip angle increases from 20° to 40°,the resistance to muck flow decreases,resulting in increased ore recovery.
6.3.2.Sensitivity analysis of the footwall surface roughness
The effect of the footwall surface roughness on ore recovery after blasting is shown in Fig.12b.As the footwall surface roughness increases,the ore recovery decreases gradually.The footwall surface roughness is measured by the friction coefficient of the post-blast footwall surface.The amount of the friction coefficient directly influences the frictional resistance experienced by the flowing ore muck.Due to variations in factors such as drilling accuracy between rows and explosive quality,the post-blast footwall surface may be rough,and thus reduces the rate of ore flow on the footwall.Therefore,blast design,drilling accuracy,and blasthole charging efficiency in production blasting process should bestrictly controlled to reduce footwall roughness in order to improve the flow of muck on the footwall surface.

Table 9 Lower stope footwall dip angle sensitivity analysis results.

Table 10 Sensitivity of the individual factors with respect to ore recovery.
6.3.3.Sensitivity analysis of production ring burden
The effect of blast ring burden on ore recovery is shown in Fig.12c.In the laboratory physical experiment,the ore draw gradually decreased with increasing blast ring burden determined by the burden plate placement intervals.In the onsite ore mucking process,only 30%-40%of the ore is drawn for a given blast to minimize the open void exposure time.The ore drawing was stopped when the swell space required for the next blast was reached.This practice is similar to shrinkage stoping (entry stoping system in which workers enter the stope) and vertical crater retreat (VCR,for non-entry stoping system in which workers do not enter the stope).VCR is a sublevel stoping system developed from shrinkage mining system experience for stoping in high stress conditions.Shrinkage and VCR mining systems are discussed in detail in[52,53].
At the mine,all ore was recovered from a stope only after stope blasting was completed and retention of muck in a stope for stability purposes was no more necessary.After the final blast in a stope,ore draw frequency was increased at drawpoints to boost ore recovery rate.This practice could not be explicitly implemented in the laboratory physical experiment.Therefore,the following steps were taken to overcome this deficiency in the laboratory physical experiment in order to implicitly simulate the actual process in the laboratory.First,because of the repeatability of the physical model experiments,each experiment was repeated until two experiments were within 5% error of each other.Once this condition was satisfied,the average value of the two results was taken as the result of physical simulation for that experimental configuration.Second,physical model experiments can well reflect the laws of the structure based on the similitude principles used in their design.Therefore,through the physical model experiments,we can obtain some rules of parameter adjustment to obtain the approximate expected actual field values.Based on the simulation of similar materials,the laboratory scale physical model can be scaled up to the full scale.
In the actual production process,the ore drawing parameters influence the timing of the stope production schedule.A large production ring spacing will induce a large workload for each blast,increase the mine production,and shorten the stope exposure time which is desirable.
6.3.4.Sensitivity analysis of drawpoint spacing
The impact of drawpoint spacing on ore recovery is shown in Fig.12d.As the drawpoint spacing increases,the ore recovery decreases in approximately linear manner.The amount of residual ore muck in the stope depends mainly on the ore draw method.When the drawpoint spacing decreases,the number of ore drawpoints increases,and hence results in increased ore recovery.The close spacing of drawpoints also results in draw ellipsoid interaction resulting in reduced residual ore in the stope.This logic follows the principles of drawpoint design in block caving mining as can be seen in[8,54].On the contrary,as the drawpoint interval increases,the number of ore removal points decreases,individual drawpoint ellipsoids cease to interact resulting in decreased ore recovery and increased ore loss.
During the production process,the choice of a minimum drawpoint spacing must also consider safety requirements and the minimum turning radius of the ore removal equipment.Under typical circumstances,the minimum turning radius of a 2 m3scraper is 5.5 m,and safe pillar stability requires a pillar width of at least 4 m.Hence,the drawpoint spacing should be at least 5.5 m.From Fig.12d,it can be seen that a drawpoint spacing of 4 m gives the maximum ore recovery,which then decreases with increase of the drawpoint spacing.When the spacing is 5.5 m,the corresponding ore recovery is 76%.Thus,the decision to recommend a drawpoint spacing of 5.5 m is based on economic and technical reasons[8,15,55,56].

Fig.12.Sensitivity results of the different factors.
7.Case study
The Jiaojia Gold Mine in Shandong Gold Group is located in Laizhou city,Shandong Province,China.The geographic position is E120°06′to E120°10′and N37°23′to N37°26′.The thickness of the orebody in Jiaojia Gold Mine is 10-15 m(average 12.5 m),with a dip angle of 26°-40°(average 30°).Thus,this orebody is a typical moderately dipping medium-thick orebody.The mine is currently mined by drift and fill mining system (Fig.5).At the Jiaojia Gold Mine was studied,during mining,a haulage drift is developed at the contact of the ore and host rock in the footwall,and the production drifts are placed approximately perpendicular to the haulage drift as shown in Fig.5.The drift dimensions are 3.5 m×3.3 m.After completion of ore recovery in a given drift,the mined void is tightly backfilled with cement to tailing ratio of 20%.
The production capacity of each drift per shift is only 80-100 t/d.The mine needs a production capacity of 10000 t/d requiring 100-125 working faces to meet this production requirement.Thus,because several working faces are needed to meet the production targets,the production scheduling is complicated.Furthermore,some ore is left close to the hangingwall as support to prevent the hangingwall from unravelling.This is significant sterilized ore.Hence,existing problems associated with the current mining system are numerous and are constraints on productivity.
To address these problems and optimize productivity a field scale experiment was conducted in the mine using the suggested DLSOS method with fan blasthole drilling and 20% cement to tailing ratio backfill.The experimental stope had a dip angle of 30°and an average thickness of 25 m.
According to the sensitivity analysis results,the lower stope footwall dip angle has a dominant effect on the ore recovery.Considering stope stability and angle of sliding of 35°for the muck,the lower stope footwall angle was designed to be 40°.The ore drawpoint interval was the second most important factor impacting the ore recovery but would need to be constrained by the turning radius of the mining equipment.Careful consideration was given to minimize the spacing and yet maintaining practical workability.During the production process,a 2.5 m3scraper was used for ore haulage.The minimum turning radius of the scraper was 5.5 m.Hence,considering all requirements,the ore drawpoint spacing was chosen to be 5 m.
Controlled blasting was used in the production process to control the footwall surface roughness to 0.5 as discussed in Section 4.2.For efficient production,the blasthole ring burden was set at 2 m.This was because in the mining process,blast burden determined the workload of rock drilling.If the burden interval is too small,many blastholes will be needed,and the process of drilling,charging,and detonation will be excessive.As shown in the physical model simulation results,when the burden increases,the recovery rate decreases (Fig.8).Therefore,considering the actual situation in the field,the minimum burden was set to 2 m.A lower burden could produce undesirable fragmentation and be more expensive per blast.The neural network experiment results are shown in Table 7.In Table 7,the 4-40-1 model gives the optimum results with the least errors.Table 9 presents the lower footwall dip angle sensitivity results,and shows that for a footwall dip angle of 30°,roughness friction coefficient of 0.3,drawpoint spacing of 5 m (10 cm on model scale) and blast ring burden of 2 m(4 cm) the ore recovery is 76.67%.Based on the physical model results,for a footwall dip angle of 30°,surface roughness friction coefficient of 0.45,drawpoint spacing of 5 m and a burden of 2 m the ore recovery is about 73.43%.It is argued that with a reduction in footwall surface friction coefficient from 0.45 to 0.3,one will expect the ore recovery to increase by about 80% if all other factors remain the same.
The voids created in the field experimental stope after complete mucking of ore is shown by cavity monitoring system survey results in Fig.13a and b.Based on the cavity monitoring results and the planned stope dimensions,the ore recovery was determined to be about 81.3%.
Fig.13b shows the residual muck after the ore haulage process.The residual muck is from three sources:the footwall surface residual ore,production drift end residual muck indicated by A in Fig.13b,and drawpoint brow residual muck identified by B in Fig.13b.The footwall residual muck resulted due to the constraint of the lower stope footwall dip angle being low.When the lower stope footwall dip angle was increased,the ore flow increased,but with increased dilution.With regard to the drift end and brow residual muck,the use of remote-control scrapers was recommended to allow the equipment to enter the open stope to recover that portion of the muck (see A and B in Fig.13b) to improve the ore recovery.
Table 11 shows the comparison of conventional cut-and-fill methods (including the drift-and-fill mining system practiced at the case study mine) with sublevel open stope mining (including the proposed DLSOS mining system)to show the benefits and efficiency of the proposed DLSOS mining system.Table 11 shows that although the DLSOS mining system proposed in this paper has slightly lower ore recovery and a higher dilution than the driftand-fill mining system used at the mine,its daily production capacity is about 5-6 times that of the drift-and-fill mining system.The DLSOS system is also less costly with a mining cost of 12.85$/t compared to 19.72 $/t for the drift and-fill mining system,as a result of improved operational efficiency of the former.

Fig.13.Ore loss and dilution in the experimental stope of DLSOS mining method.

Table 11 Comparison of cut-and-fill and sublevel open stoping mining system including existing mining practice at case study mine and the proposed DLSOS mining system.
8.Conclusions
A three-layered back propagation neural network (BPNN) was selected to evaluate and optimize the parameters governing the mining of moderate dipping medium-thick orebodies with diamond layout sublevel open stoping system (DLSOS) mining method.By comparing calculations of various configurations of different hidden layer node numbers,an optimal BPNN model with a 4-40-1 network structure was selected.Based on the results of the BPNN calculations of the ore drawing process with four input factors,and a single output factor,the relative error and RMSE were minimum when the number of hidden neural network nodes was 40.The best results were obtained in the study when the training function TRAINLM,learning function LEARNGDM,and transfer function TANSIG were used.
Based on the selected BPNN model and utilizing the results of a laboratory physical granular flow simulation experiment,an ore recovery forecast model for DLSOS mining method was constructed.The forecast results of different factor configurations fitted a linear relationship with a correlation coefficient of 0.995,indicating a good match between the BP modelling and physical experimental results.The error analysis results showed that the forecasted results were very similar to the experimental results with a highest relative error of only 0.48%.
Based on the constructed BPNN model,the parameters were perturbed within a certain range to conduct a sensitivity analysis of factors affecting the ore recovery.The results indicated that the lower stope footwall dip angle had the greatest effect on the moderately dipping orebody recovery,followed by the drawpoint spacing,footwall roughness and finally production ring burden.
The study results were applied to a field scale experiment at the Jiaojia Gold Mine.The predicted ore recovery was 80% when the lower stope footwall angle was 40°,the drawpoint spacing was 5 m,and the production ring burden was 2 m.Control blasting was used to manage the footwall surface roughness by controlling the construction accuracy of two adjacent rows of drilling holes and the results of later cavity monitoring system (CMS) scanning,the roughness of the lower plate was approximately 0.5 based on the sliding friction tests.The full-scale experimental results indicated that the recovery was 81.3%.Suggesting that ore recovery forecasting based on the BPNN and physical simulation experiments were suitable for ore recovery prediction and assessment of the performance for moderately dipping medium-thick orebodies.
The field scale experimental results indicate that sublevel open stoping with fan layout blastholes and tight backfilling is suitable as a mining method for the condition where an orebody and the hangingwall can be kept stable during the mining process.The use of manual scrapers was found limited to operations outside the stope.To improve the ore recovery,remote-controlled scrapers could be employed to enter the stope and remove any sterilized ore.
Acknowledgements
The authors wish to thank the staff of Shandong Gold Group Co.Ltd Jiaojia Gold mine for providing access to their mine for this research.The authors also acknowledge the Project Manager,Zhang Zhonghui,for his contributions.This study was funded by the State Key Research Development Program of China(2018YFC0604400),the National Science Foundation of China(No.51874068),the Fundamental Research Funds for the Central Universities (N160107001,N180701016),and the 111 Project(B17009).The authors also acknowledge Nazarbayev University for the Faculty Development Competitive Research Grant(240919FD3920).
杂志排行
矿业科学技术学报的其它文章
- Stability control of gob-side entry retained under the gob with close distance coal seams
- A novel coating technology for fast sealing of air leakage in underground coal mines
- A robust approach to identify roof bolts in 3D point cloud data captured from a mobile laser scanner
- Physical model test and numerical simulation on the failure mechanism of the roadway in layered soft rocks
- Deformation response of roof in solid backfilling coal mining based on viscoelastic properties of waste gangue
- Blast-induced ground vibration prediction in granite quarries:Anapplication of gene expression programming,ANFIS,and sine cosine algorithm optimized ANN
