A robust approach to identify roof bolts in 3D point cloud data captured from a mobile laser scanner
2021-04-08SrveshKumrSinghSimitRvlBikrmBnerjee
Srvesh Kumr Singh,Simit Rvl,*,Bikrm Bnerjee,b
a School of Minerals and Energy Resources Engineering,University of New South Wales,Sydney,NSW 2052,Australia
b Agriculture Victoria,Horsham,VIC 3400,Australia
Keywords:Mobile laser scanning Roof bolts Support system planning Roof monitoring Change detection Underground roadways
ABSTRACT Roof bolts such as rock bolts and cable bolts provide structural support in underground mines.Frequent assessment of these support structures is critical to maintain roof stability and minimise safety risks in underground environments.This study proposes a robust workflow to classify roof bolts in 3D point cloud data and to generate maps of roof bolt density and spacing.The workflow was evaluated for identifying roof bolts in an underground coal mine with suboptimal lighting and global navigation satellite system (GNSS) signals not available.The approach is based on supervised classification using the multi-scale Canupo classifier coupled with a random sample consensus (RANSAC) shape detection algorithm to provide robust roof bolt identification.The issue of sparseness in point cloud data has been addressed through upsampling by using a moving least squares method.The accuracy of roof bolt identification was measured by correct identification of roof bolts (true positives),unidentified roof bolts(false negatives),and falsely identified roof bolts (false positives) using correctness,completeness,and quality metrics.The proposed workflow achieved correct identification of 89.27%of the roof bolts present in the test area.However,considering the false positives and false negatives,the overall quality metric was reduced to 78.54%.
1.Introduction
The structural stability of an underground mine can be compromised by hazardous ground movement and weak rock strata that can destabilise rock walls,floors,and roofs.The reinforcement of weak rock strata using structural support such as roof bolts enhances the load-bearing capacity of rocks and improves the stability of a mine roadway.Roof bolts can meet a variety of geological conditions and requirements essential for a modern roof support system in an underground mine or tunnel [1].However,due to humidity and constant stress from mining activities,roof bolts can deform and corrode over time,posing safety risks in mines.Failure often occurs in the form of rock or roof fall,with costly downtime.The United States Mine Safety and Health Administration,an organisation responsible for maintaining regulatory standards for mining,defines a reportable roof fall as a fall which causes fatal injury,disrupts mining activities for more than an hour,occurs at or above roof bolt anchorage level,impairs ventilation or impedes passage[2].In Australia,a safety bulletin issued by the Queensland government lists support structure related factors leading to roof fall:incorrect installation of roof bolts,inappropriate design of support structures,changes due to mining activities,and corrosion of support structures over time [3].Considering these factors,it is very important to analyse the design and distribution of roof bolts over a wide area,identify the optimum placements of roof bolts,and routinely monitor the condition of roof bolts to maintain better roof stability.
Traditionally,roof bolts have been monitored using instruments such as a ring/dial gauge [4],strain gauge [5],extensometer [6],ultrasonic bond tester [7],shear meter [8],closure meter [8],or compression pad [9,10].These conventional methods are limited to monitoring local changes in the vicinity of the equipment at a few roof bolts which are often not scalable to a larger area.For example,Jones et al.[11]assessed mining-induced deformation on discrete points using readings from extensometers.Although the deformation measurement is accurate at the discrete points,it is not sufficient to study deformation occurring over an extended region.
Alternatively,popular surface imaging approaches such as terrestrial laser scanning (TLS) [12]and photogrammetry [13]can be used to map and monitor underground environments.However,TLS is characteristically a fixed point(stationary)scanning technology with a limited operational coverage area,is heavy to carry and is expensive for frequent assessments over a large area.Conversely,photogrammetry is an economic alternative,but it comes at the expense of increased processing time and has subjective performance due to dust,shadow,and suboptimal lighting conditions in underground mining environments [13].The absence of global navigation satellite system (GNSS) coverage makes it even more challenging to use such technologies underground for large scale mapping.
Recent developments in simultaneous localisation and mapping(SLAM)based mobile laser scanning systems offer new opportunities for rapid mapping of large indoor or underground spaces.The SLAM technology has the advantage of working in both GNSS aided and GNSS deprived conditions,thus making it suitable for use in outdoor,indoor,and underground environments.Portable versions of mobile mapping systems,such as ZebRevo,uGPS-rapid mapper,Lynx,and Leica-Pegasus,are easy to operate and can function in an environment with no ambient light.A mobile laser scanner produces output in the form of a three-dimensional (3D) point cloud which represents an exact 3D replica of the scanned environment.
The opportunity to extract unprecedented detail from the point cloud has led to the application of machine learning in a number of studies including classification,object identification,and scene semantic segmentation.For instance,Matkan et al.[14]used support vector machine (SVM) classification to extract road surfaces from 3D point cloud data.Similarly,Mayr et al.[15]compared SVM and the random forest classifier to automatically identify damages in landslide prone areas using a 3D point cloud.To achieve high-performance classification in a complex environment,a Canupo classifier was developed that used SVM on projected multi-scale local dimensionality descriptors to identify decision boundaries[16].Machine learning has also been used in rock slope monitoring with various objects such as vegetation and the ground classified using the Canupo classifier[17].In similar research,Weidner et al.[18]used the random forest classifier to classify objects(vegetation,ground,gravel) on a hill slope.In particular,random forest and SVM have shown promising results in the classification of objects in a 3D point cloud.Recently,many deep learning algorithms operating on various levels such as point-based [19,20],graph-based [21,22],or voxel-based [23,24]have been developed to classify and identify objects with high accuracy.Guo et al.[25]presented a survey and comparison of existing deep learning algorithms for object classification on various benchmark datasets.To achieve high accuracy,deep learning algorithms require a large amount of training data.Since the presented study had limited training data,roof bolts were classified using the Canupo classifier which was developed to classify structures and features in a complex environment.
As modern mining operations use computer-aided programs that combine industrial,laboratory,and numerical research,the use of 3D imaging technology with big data to identify mining induced hazards is increasing [26].In the mining environment,laser scanning is used to monitor roof closures[27]and cavity collapse [28]where frequent observations are essential.The highresolution 3D model generated from a laser scanner is also used to monitor tunnel profile and deformations [29-31]and to measure vertical and cross-sectional clearances [32].In an innovative approach,Lato and Diederichs [33]used laser scanning to map shotcrete thickness and improved the result accuracy by taking into account the surface convergence by capturing multiple laser scans over time.The 3D model generated from laser scanning can also help assess the hazards of underground cavities as it provides relevant geometrical information which,when merged with geological data and numerical models,provides estimates of rock mass or roof failures [34].One of the most useful applications of laser scanning is in the characterisation of rock mass [35,36].Fekete et al.[36]analysed both exposed rock faces and rock faces obscured due to support installation by collecting laser scans at successive blast rounds.There has been a recent increase in the use of laser scanning technology for change detection and deformation monitoring due to its potential to capture accurate 3D data in an underground environment [37-40].
This study proposes a robust workflow to automatically classify roof bolts in the 3D point data generated from a mobile laser scanner.The method rapidly and readily generates a map of roof bolt density and spacing which can be used for change detection throughout a mine site.An underground coal mine,a complex and challenging environment for mapping,was selected to evaluate the developed approach.This is a complex environment for mapping due to the geometrical symmetry,high repeatability of features,limited reflectivity of the surface,limited lighting,and no GNSS availability which all mean the mapping solution often has errors due to false laser scan matches[41].Additionally,structures which are structurally similar to roof bolts such as signboards,markers,cables,and pipelines cause difficulty in the identification process.The protruding portion of a roof bolt in an underground mine is usually cylindrical with variation in the protruding length and size based on the type of roof bolts used at the site (Fig.1).A suitable processing workflow is designed that exploits the geometrical properties of roof bolts in the 3D point cloud to distinguish bolts from other structures at the mine site.To the authors’ knowledge,no existing technique has focused on detection and monitoring of the roof bolts distributed over an area.The main objective of this study is to evaluate a point cloud captured from a mobile laser scanner (ZebRevo) to identify roof bolts in an underground coal mine.The identified roof bolts are then used to examine the distribution and spacing of roof bolts to support future monitoring and assessment.The approach presented in this study is a combination of several techniques to produce a robust and accurate identification of roof bolts even in sparse 3D point cloud data.
2.Material and methods
Section 2 describes the technology,instrumentation,and procedures used to capture laser scans in the study area.Section 2 also explains the processing workflow from data collection through to mapping of roof bolts.
2.1.Simultaneous localisation and mapping (SLAM) technology
The mobile laser scanning equipment in this study uses the SLAM principle.SLAM is a computational process of building a map in an unknown or known environment while simultaneously keeping track of the sensor carrier (localisation) using a range of sensors such as inertial measurement unit (IMU),odometer,laser scanner,camera,radio detection and ranging (RADAR),or sound navigation and ranging (SONAR) [42].To build an accurate map of the environment,the mapping sensor should know its precise location while to obtain a precise location of the mapping sensor,an accurate map of the environment is required.Therefore,SLAM is an optimisation process which tries to minimise the error in mapping and localisation when the two aspects are correlated.
To perform mapping in an unknown GNSS-denied environment,the location and pose of the sensor carrier are tracked using sensors such as the IMU or odometer,which suffer from uncertainty as mapping time progresses.To reduce the uncertainty in positioning,an imaging sensor captures details of features in the surrounding environment which are stored and matched to identify the same location.The process of identifying the same location in the environment when revisiting is called loop closure.When loop closure is detected,the sensor pose uncertainty reduces and the map of the surrounding environment is updated using the new optimised pose.
2.2.Mobile laser scanner
This study uses a mobile laser scanner,ZebRevo [43],that was developed for mapping in indoor environments.The equipment provides a simple and rapid means of capturing 3D point cloud data as the sensor moves through the area of interest.The portable device has an internal 2D time-of-flight laser sensor integrated with an IMU mounted on a motor drive.The 2D laser sensor rotates with the help of a motor drive to generate a 3D point cloud.An external optical camera is also available to collect ancillary image and video information.The generated raw data is stored on a portable onboard data acquisition computer which is processed without the need for a GNSS signal by using the post-processing SLAM software provided with the unit.Table 1 summarises the major specifications of the mobile laser scanning system.The Hokuyo UTM-30LX-F uses laser pulses of wavelength 905 nm which falls in the near-infrared range in the light spectrum and is classified as a Class 1 laser product [43],being safe to use under reasonably foreseeable conditions of operation.The scanner has a maximum range of 30 m under optimal conditions(indoors with good target reflectivity),fires around 43200 laser pulses per second,and has a reported range error of about±3 cm[43].The range error of a laser scanner,a measure of absolute error at individual scan points,is determined using scans of a standard reference panel (80%-90%reflectivity) from varying distances (0-30 m).
2.3.Methods
Several processing algorithms were implemented to identify roof bolts in the 3D point cloud data.The steps included data pre-processing,classifier training,3D point cloud classification,and accuracy analysis of the obtained result.Individual steps for roof bolt identification in the 3D point cloud are shown in the flow chart in Fig.2.
2.3.1.Data collection
Medium to large scale data collection in an underground coal mine is challenging using conventional mapping technology such as TLS or photogrammetry due to immobility and poor lighting conditions.To overcome this,a mobile laser scanner was used for data collection in a test area of an underground coal mine in the Southern Coalfields,New South Wales,Australia.The test area selected for mapping and identification of roof bolts was a section of underground roadway about 40 m in length (Fig.3a),with a cross-sectional height of approximately 3.5 m and width of 4.5 m(Fig.3b).The roof bolts used at the mine site included both resin anchored and grouted rock bolts as well as grouted cable bolts(Fig.1).However,in this study,both rock bolts and cable bolts are referred to as roof bolts for classification.Datasets were collected in a loop at walking pace with the handheld laser scanning system oriented towards the roof (Fig.3c),to maximise the point returns from the roof bolts.Various objects such as a ventilation pipeline,roof bolts,signboards,markers,and wires are visible in the captured point cloud (Fig.3d).Since the SLAM algorithm depends on the matching of successive laser scans for mapping,presence of moving objects in the environment may lead to false scan matches resulting in a drifted or inaccurate 3D map [41].Therefore,there was minimal activity on site to avoid possible inaccuracy or mapping drift.Also,multiple datasets were collected in various loops to observe the effect of point density in surface reconstruction.Data from a single loop at normal walking speed resulted in a nominal point spacing of 8 mm which in turn provided point density of 15625 points/m2.
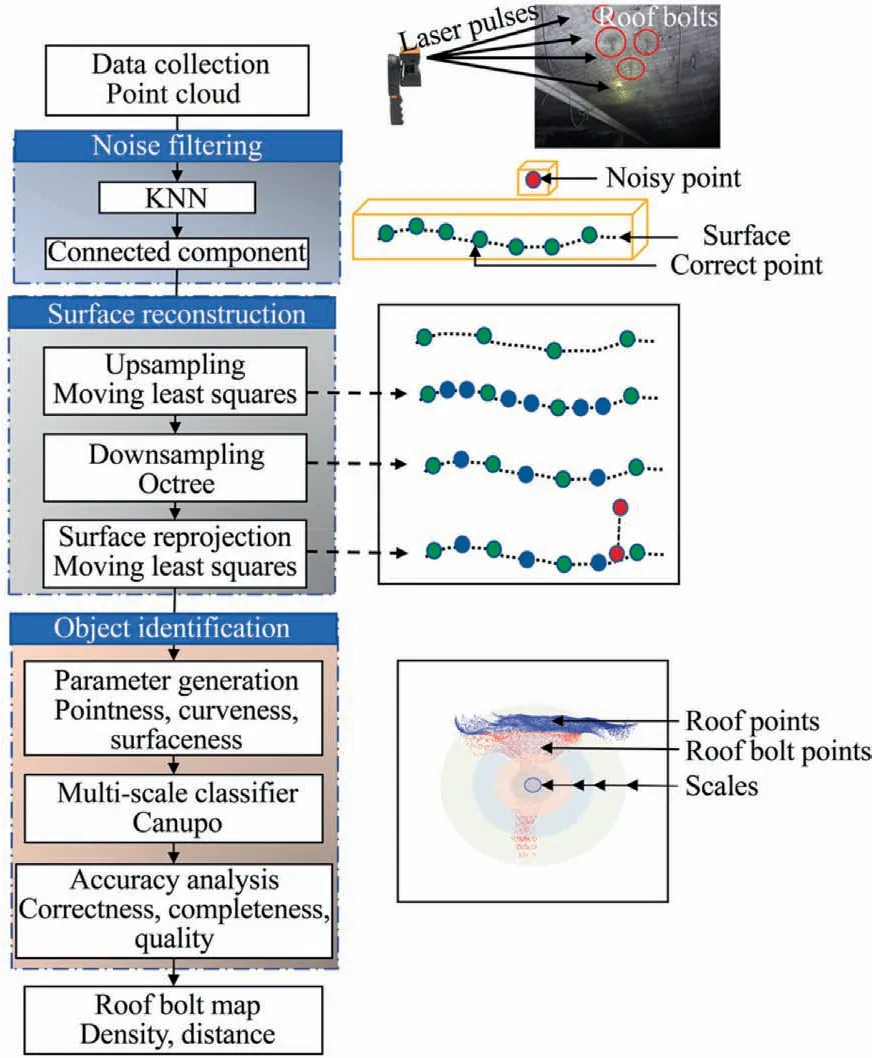
Fig.2.Workflow for generating the roof bolt map from 3D point cloud data.

Fig.3.Data collection in a test area of an underground coal mine in Australia.
2.3.2.Noise filtering
The noise filtering step is essential to remove erroneous points from the dataset that might affect point cloud classification.Prominent factors contributing noise include false range measurements due to laser beam divergence when the target being scanned is too far away based on the sensor range limit,moving objects during active scanning,sensor perturbation,sudden jerks,and low surface reflectivity.To accurately detect roof bolts,the point cloud was filtered to remove inherent noise and optimally sampled for further processing.The step is essential as the presence of noisy points near roof bolts may lead to false descriptor generation which in turn affects classification results.For data cleaning,popular algorithms such as k-nearest neighbour (KNN) [44]and connected component filter [45]were used.These algorithms were selected over other filtering algorithms as they do not substantially vary point spacing and require less processing time [46,47].
(1) KNN based filtering:Due to sensor perturbations and laser beam divergence,the range measurements given by the laser scanner are sometimes erroneous.Such points were removed by analysing the spatial distribution of neighbours around the query point using the k-nearest neighbour algorithm.KNN filtering algorithm is a non-parametric method for classifying data points.It can be categorised as instance-based learning where the function is an approximation of a local subspace for computation and hence is sensitive to local structures.For each point in the point cloud,the algorithm uses a set of surrounding k nearest neighbours to construct an imaginary fitted plane.If the distance of a given point from the fitted plane exceeds a certain defined threshold,then it is flagged as noisy and discarded.This study used six nearest neighbours for filtering,and if the point was further than two times the standard deviation from the fitted plane,it was removed.Choosing a large number of neighbours in the KNN algorithm increases the sensitivity to the fitted plane and can remove potential inlier points in the dataset.For plane fitting to operate for filtering,a minimum of four non-collinear points are required.However,selecting a large number of point neighbours removes inlier points from the point cloud,which affects the point density.In this study,setting the number of point neighbours beyond 15 (trial-and-error) was found to severely affect the point cloud.Therefore,the point neighbour parameter can be set between 4 and 15;in our study,it was set at 6.Broadly,the point neighbourhood parameter does not need to be specifically set at any unique value but needs to be within the acceptable limits for lossless filtering.
(2) Connected component-based filtering:A point cloud often contains isolated sets of points disconnected from the main segment of the scanned data.These isolated points are either a result of false range measurements or due to the scanned feature being at a certain offset distance from other scanned features.These points appear as random isolated sections in the point cloud data which can be removed effectively using a connected component filter.The connected component is an algorithmic approach to detect connected regions within an image or 3D scan.For point cloud scans,the algorithm uses an octree structure to segment connected or nonconnected regions.An octree is a tree-based data structure for managing sparse 3D data where the point cloud is divided into several voxels (a unit of graphical information in 3D space) at a selected level of octree[48].A higher level of octree refers to smaller voxel size and vice versa.The filter works by segmenting the point cloud into smaller parts separated by a minimum distance specified by the octree level and a minimum number of points.Each segmented part is called a connected component (set of connected points).The components which have total points less than the set threshold minimum number of points are automatically removed.This study used an 11th level octree (grid size of 0.016 m) with a minimum threshold of 10000 points per component as a filtering criterion.The threshold number of points is defined to avoid including spurious points as essential segments of the scanned point cloud.Strategically,a sufficiently large threshold (≥10000) can be defined to select cloud segments of interest.
The filtering step was imperative to deal with noise that might have caused unnecessary complications in the classification process.The effect of filtering can be observed in Fig.4.Part of a mining vehicle and other erroneous points visible in the raw data(Fig.4a)were efficiently removed after applying the KNN filter followed by the connected component filter (Fig.4b).
2.3.3.Upsampling and surface reconstruction using moving least squares (MLS)
Identification of an object in a 3D point cloud requires a certain minimum point density and proper surface reconstruction to ensure that essential features of the target object(a roof bolt in this case) are preserved.Feature preservation and regeneration were achieved using a process called upsampling,where new sample points are inserted between original points to synthetically increase the sampling rate that leads to increased point density.This study used moving least squares(MLS)to perform upsampling due to its intrinsic capability to handle noisy input and simplicity in computing the differential geometric (normal and curvature)properties [49,50].A spherical region of user-defined radius r(0.02 m in this study) moved through the 3D point cloud,and a surface was fitted (using a polynomial of order n,1 in this study)on the points that fell in the localised subspace of the sphere.Points were added on the fitted plane based on a defined step size(0.01 m in this study) as shown in Fig.5.A first-order polynomial fit model provided a suitable surface approximation for the neighbourhood of points present in a small spherical radius (0.03 m).A large radius value(>0.03 m)covered a wider area around the query point and was not suitable for the first-order polynomial fit because the terrain may not be planar and might exhibit complex geometry which is difficult to project using a simple polynomial model over extended regions.For surface reconstruction,the points were projected (by translation) along the surface normal vector to make them lie on the fitted surface.The reprojection smooths the surface.

Fig.4.Raw point cloud and filtered point cloud obtained after KNN filtering followed by connected component filtering.Colour in the point cloud represents a height gradient where blue represents lower value and red represents higher value.
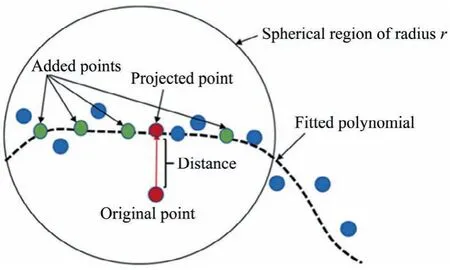
Fig.5.Upsampling and surface reconstruction using moving least squares.
2.3.4.Multi-scale Canupo classification algorithm
The Canupo classifier is a machine learning-based binary classification technique which was originally developed and tested for vegetation classification in a point cloud [16].The classifier uses the dimensionality of the object over multiple scales for identification and classification.The scale here refers to the imaginary spherical region in space (Fig.6) while dimensionality refers to how the 1D,2D,or 3D (pointness,curveness,and surfaceness,respectively)object appears based on variance.For instance,a roof bolt surface at a scale of a few centimetres(<3 cm)may appear 2D while the same bolt when observed on a larger scale (>3 cm) may appear 3D.Therefore,using a Canupo classifier involves a proper understanding of object dimensions in order to select the appropriate number of scales for the classification.The classifier uses principal component analysis (PCA) to evaluate dimensionality of the object at defined scales by computing eigenvalues.The proportion of variance (POV) shown by each eigenvalue is given by pi=λi/(λ1+λ2+λ3),where λ1,λ2,and λ3are eigenvalues obtained for the 3D point cloud using PCA and i represents the eigenvalue number at a particular scale,and leads to three important dimensional parameters:pointness,curveness,and surfaceness (see Eq.(1))[51].
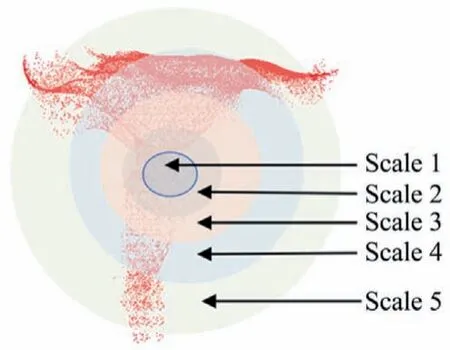
Fig.6.Different scales for parameter generation represented by the spherical region around a point.

where p1>p2>p3.
From the obtained parameters across various scales,a twoparameter domain can be constructed using the approach presented by Brodu and Lague [16].In the two-parameter domain,a suitable boundary also called the hyperplane can then be identified to classify the object.The parameters of the fitted hyperplane such as weights and biases were determined using SVM with a linear basis function.The classifier was chosen as it can identify and classify objects in a complex environment using multi-scale characteristics [16,17].The use of a linear decision boundary using the Canupo classifier is justified over other non-linear decision tools because the variance between the two classes (roof bolt and nonbolt) should be large enough for a linear separation when using multi-scale descriptors.The classifier also offers the flexibility of manual decision boundary modification through human intervention for better accuracy.
Separating roof bolts from other structures in the 3D point cloud of the underground environment is a binary classification problem that can be addressed effectively using the Canupo classifier due to its constrained shape and size.In this study,the classifier was trained for roof bolt classification by using around 60 point cloud samples of roof bolts consisting of 9701 points in total (including the ones captured from different viewpoints) and a few point cloud samples of non-bolts consisting of 8796 points from one of the pre-processed point clouds to represent varying field conditions (Fig.7).Roof bolt training samples captured from several viewpoints are required because only a portion of the roof bolt surface is normally visible when viewed from one particular direction (and the scanner can only capture the visible surface).Such variability in the training dataset is vital so that roof bolts located near the roof edges can be efficiently identified.The standard approach to create a training dataset for point cloud classification is either to sample points on the surface of an object using a 3D CAD model [52]or to manually segment the target object from the scanned point cloud[53,54].In this study,the training dataset was created by manually segmenting roof bolt points and non-bolt points from the scanned point cloud (Fig.7).The scales (spherical region) defined for descriptor generation ranged from 0.02 to 0.15 m radius with an interval of 0.01 m based on the suggestion by Brodu and Lague [16].The scales were selected to capture the point of variation from 2D to 3D that distinguishes roof bolt points from other structures.Finally,the trained classifier was run on an independent 3D point cloud dataset of a different mine section from the same mine site to classify the points into two classes—roof bolts and non-bolts.Since the training data extraction was manual,it was possible to extract 60 roof bolts from the total of 120 roof bolts with ease and accuracy.Increasing the size of the training dataset could have potentially added error in the manual extraction process.The 60 roof bolt samples were kept to form the training dataset because it was considered enough to capture all possible roof bolt variations.
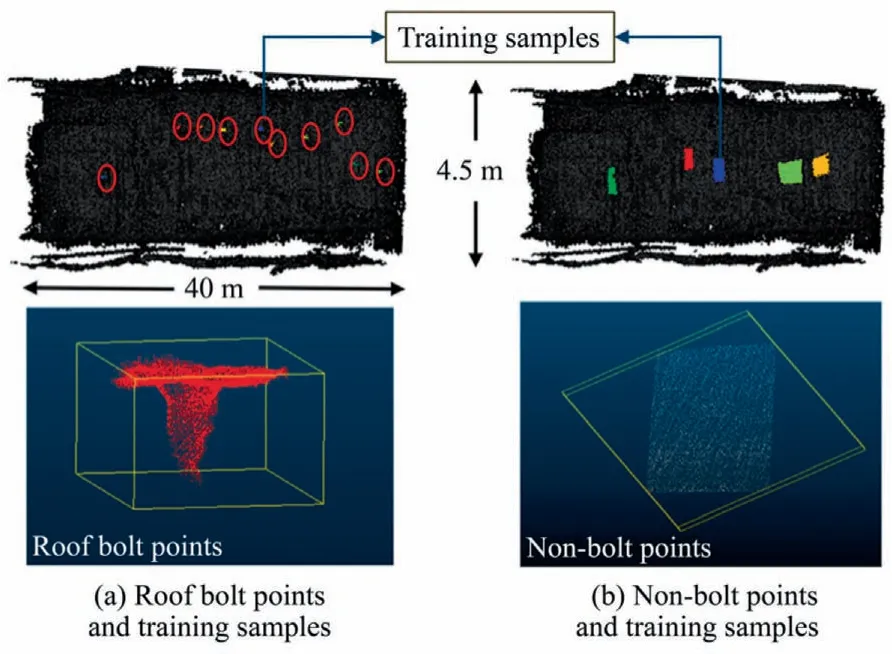
Fig.7.Training dataset creation for roof bolt classification.Some of the roof bolts are selected in the actual point cloud shown in the red circle with the close-up view of one of the roof bolt points given at the bottom;and some of the non-bolt training samples are selected in the actual point cloud with the close-up view given at the bottom.
2.3.5.RANSAC shape detection
The classified point cloud obtained through the process described in Section 2.3.4 contained some structures falsely classified as roof bolts which needed to be removed.To achieve this,the classified points were clustered individually and were filtered as outliers using random sample consensus (RANSAC) which is a method for estimating parameters of a model(plane,circle,sphere or cylinder)by random sampling of the observed data.RANSAC has the advantage of robust estimation of the model parameters even when a significant number of outliers are present [55].The algorithm is iterative,and parameters of the model are solved by randomly selecting the minimum number of data points required to determine the model (cylinder for roof bolt) parameters.Cylinder fitting using RANSAC involved determining seven parameters(centre of the cylinder x1,y1,z1and x2,y2,z2at two extreme ends and radius r of the cylinder).This study used point normal information for cylinder fitting using the modification of the RANSAC algorithm given in Schnabel et al.[56].The algorithm uses a minimum of six points to estimate the two extreme ends,centre and radius of the cylinder.Inliers in the point cloud were selected using the defined tolerance value(radius from 1 to 6 cm and length from 2 to 20 cm for a typical roof bolt)from the fitted cylindrical model.If the ratio of inliers to total points exceeded a predefined threshold (80% in this case),then the parameters were re-estimated using all the inliers and the iteration was terminated.The number of iterations chosen was high enough(100 in this study)to ensure there was at least one set of random samples that did not include an outlier.
2.3.6.Ground truth and evaluation metrics
The accuracy of the classified roof bolts was analysed by preparing a ground truth data by visual identification of roof bolts,an approach widely used for validation in the point cloud [57,58].Accuracy was measured in terms of true positives (TP),false positives (FP),and false negatives (FN).TP refers to all the correctly identified roof bolts,FP refers to all the structures which were falsely classified as roof bolts,and FN refers to all the actual roof bolts which were not identified.To determine the FP and FN,the difference(Diff)between ground truth consisting of actual roof bolt location (BoltGT) and the roof bolts predicted (BoltAlgo) using the algorithm for a given location of the roof bolt was computed according to Eqs.(2) and (3).

At a given ground truth(GT)location of an actual roof bolt,if the algorithm predicted correctly,then it resulted in TP or 0.If the algorithm was unable to identify a roof bolt at the actual location,then it resulted in FN or 1,whereas if the algorithm predicted a roof bolt at a given location when there was no roof bolt,it resulted in FP or-1.Three widely used standard parameters of correctness,completeness,and quality [14,58,59]were used as accuracy measures and were calculated according to Eqs.(4),(5),and(6),respectively.
Correctness is the percentage of correctly detected roof bolts out of all detected roof bolts.It is also called precision.The measure is given by

Completeness is the percentage of the reference roof bolts that are detected by the algorithm and is also called recall.The measure is given by

Quality refers to the goodness or overall assessment of the final result which takes into account the completeness and correctness of the classified data.The measure is given by

2.4.Roof bolt distribution density and distance maps
The classified roof bolts in the point cloud data were used to create a roof bolt distribution density map and a distance map.The location(centroid of classified roof bolt points)of each identified roof bolt helped to estimate the number of roof bolts present in a circular area of unit radius (which can be varied based on the requirements) around a query point.The resulting number was then used to provide false colour to the points in the point cloud to generate a roof bolt density map.Similarly,the false colours were assigned based on the proximity of a point to the nearest roof bolt to generate a roof bolt distance map.The generated maps were intuitive as they reflected the support structure design and plan across different sections of a mine roadway.
3.Results and discussion
3.1.Pre-processing
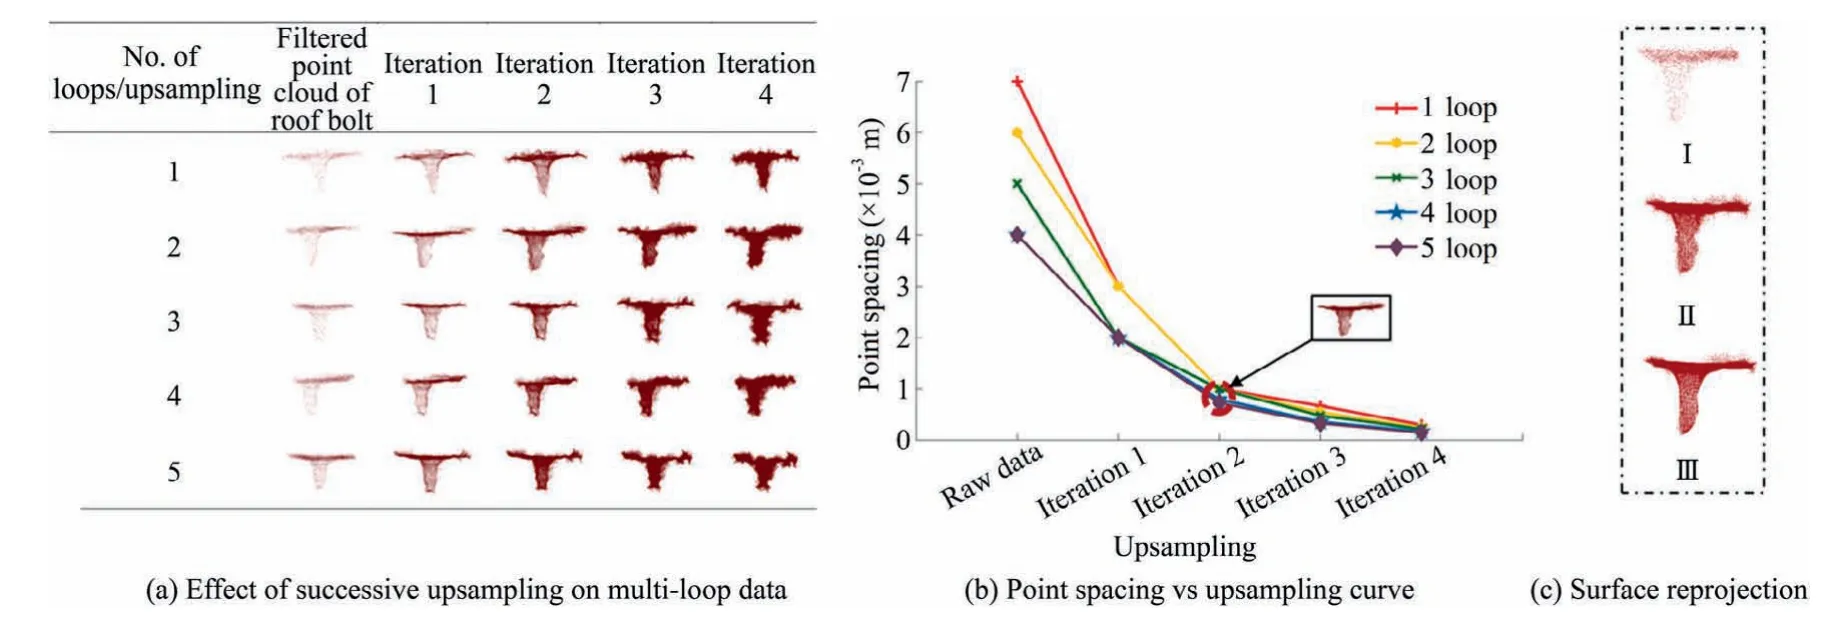
Fig.8.Effect of upsampling and the surface reprojection.
The filtered point cloud was upsampled and reprojected to recover the proper shape and structure of the roof bolts.The effect of upsampling is demonstrated in Fig.8a and b and surface reprojection is shown in Fig.8c.The first column in Fig.8a represents points corresponding to individual roof bolts observed in multiple loops,revisiting the same place again to increase point density.Columns in Fig.8a represent the point cloud after successive upsampling,while rows represent the upsampling results corresponding to a particular number of loops.As evident from Fig.8a,the upsampling and surface reconstruction help recover the shape of roof bolts even in sparse point cloud data.Further,upsampling of two iterations was found to be effective in producing sufficient structural detail irrespective of data collected at multiple loops (Fig.8b).However,iterations beyond two levels added spurious points in the reconstructed surface that led to inconsistent descriptor generation.Homogeneity of point distribution in the point cloud was achieved by downsampling the upsampled point cloud again using an 11th level octree.The downsampling step reduced the processing time for surface reconstruction and classification,which was directly proportional to the number of points in the point cloud.Fig.8c shows the surface reconstruction from processed point cloud data:(I)filtered point cloud of an individual roof bolt,(II) point cloud after two successive upsamplings,and (III) smoothed point cloud of a roof bolt after downsampling followed by surface reconstruction using moving least squares.Finally,as shown in(I),(II),and(III)in Fig.8c,the erroneous points added during upsampling were effectively reprojected,resulting in a smooth roof bolt surface.
The results suggest that the upsampling approach addresses the point density and shape recovery issue to detect roof bolts.It limits the need to collect the scan data in multiple loops which can often be laborious,time-consuming and expensive.The approach also avoids depending on expensive laser scanning equipment for object identification or monitoring applications.
3.2.Classification
Classification is a process of attaching a label to an individual point in the point cloud to denote the class it belongs to,in our case,a roof bolt.The trained classifier was used to convert the original point cloud (Fig.9a) into a classified point cloud represented by custom colours(Fig.9b).As shown in Fig.9b,the classified roof bolts are shown in red,and the rest of the point cloud is shown in black.The classified roof bolts appear as clusters and include some falsely classified points.The clusters were filtered using RANSAC,and all the identified roof bolts are shown as an individual component with a yellow bounding box in Fig.9c.
Compared against the ground truth of 205 roof bolts present in the scanned mine section,the algorithm resulted in 183 true positives,28 false positives,and 22 false negatives,with correctness of 86.73%,completeness of 89.27%,and overall accuracy or quality of 78.54%.The overall accuracy of the classification was reduced due to false positives and false negatives from several factors.A prominent reason is the associated noise(non-bolt points)present in the training samples which might have been included during manual identification of roof bolts from the point cloud.Selection of inaccurate training samples results in interclass overlap,which makes it difficult to distinguish two classes using a decision boundary.Further,some support structures,like those supporting ventilation pipe or wires in an underground environment,have similar characteristics as roof bolts in terms of shape and size causing false positives.Several roof bolts near the sidewalls of the mine could not be recognised due to the insufficient number of points on the surface of the roof bolt.Roof bolts near the edges mainly appear semicylindrical as half a side of the roof bolts could not be captured in the scan.In these cases,recovering the proper structure of roof bolts becomes challenging,which results in false negatives.To preserve the shape,data collection could be conducted so that enough points are captured on each roof bolt for the structural reconstruction process.Inaccurate training samples,similar or congruent structures,and insufficient points on the roof bolt surface reduce the quality metric or overall accuracy.Nevertheless,the achieved accuracy is high enough based on the existing mapping challenges in mine sites such as unavailability of GNSS,feature deficiency,geometrical symmetry,and sub-optimal lighting.
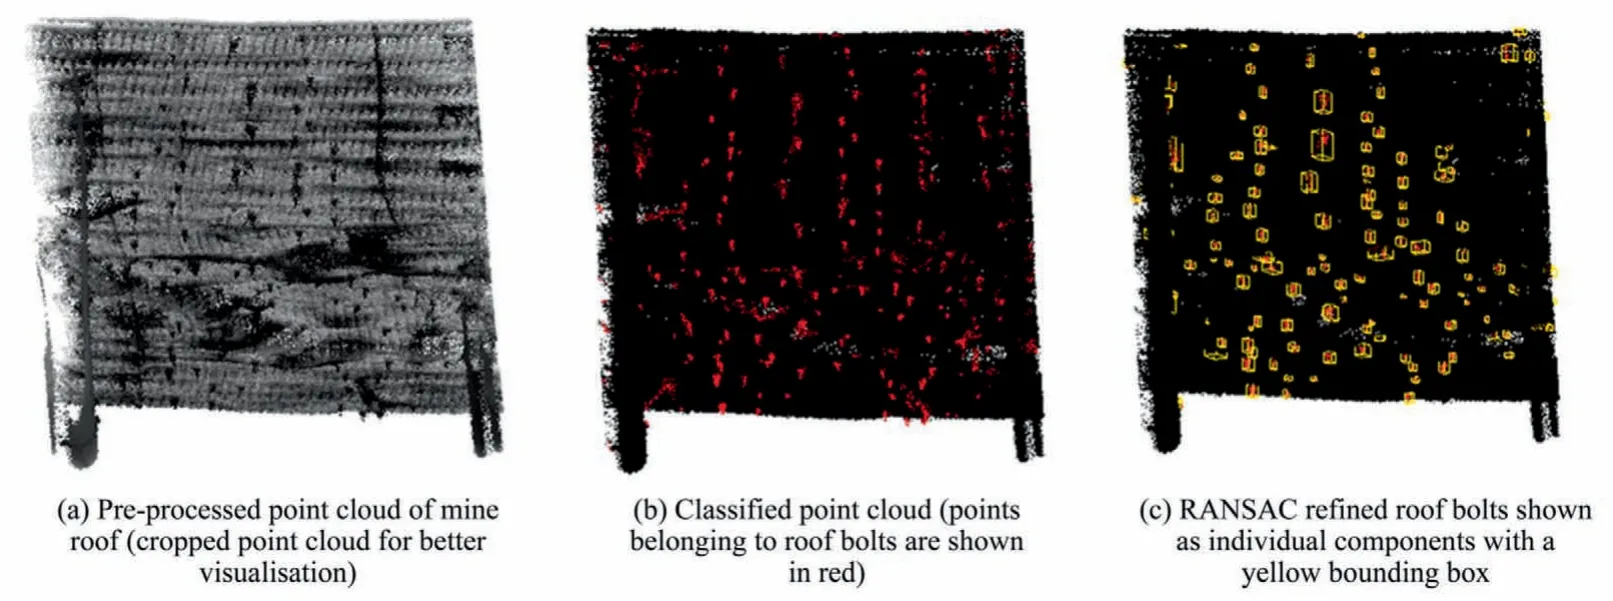
Fig.9.Classification process.
The processing time taken for the entire workflow is listed in Table 2,excluding the time taken in the intermediate step of training the classifier.Table 2 shows the classification step required more time than other steps as the classifier takes the point cloud as input and starts generating parameters (pointness,curveness,and surfaceness)corresponding to the individual point over multiple scales defined by the user.The entire process for a 40 m section of a mine was completed in 542 s.
3.3.Roof bolt distribution density and distance maps
The classified roof bolts were used to generate roof bolt distribution density and distance maps for assessment,shown in Fig.10a and b,respectively.In Fig.10a,the points in red indicate there are less than two bolts within a circle of unit radius around the point,blue points indicate there are more than ten bolts (depicting the higher density of roof bolts in the region)and the other colours show the variation in between.A spherical region of unit radius was selected due to simplicity of visualisation as well as better comprehensibility of roof bolt distribution over a small area;nevertheless,the density map can be generated at any given radius based on the end-user’s requirements or using prior information of installation pattern.In the roof bolt distance map shown in Fig.10b,the blue points show that the nearest bolt is locatedwithin 0.5 m,red shows that the nearest bolt is further than 1.5 m and the other colour levels show the variation in between.
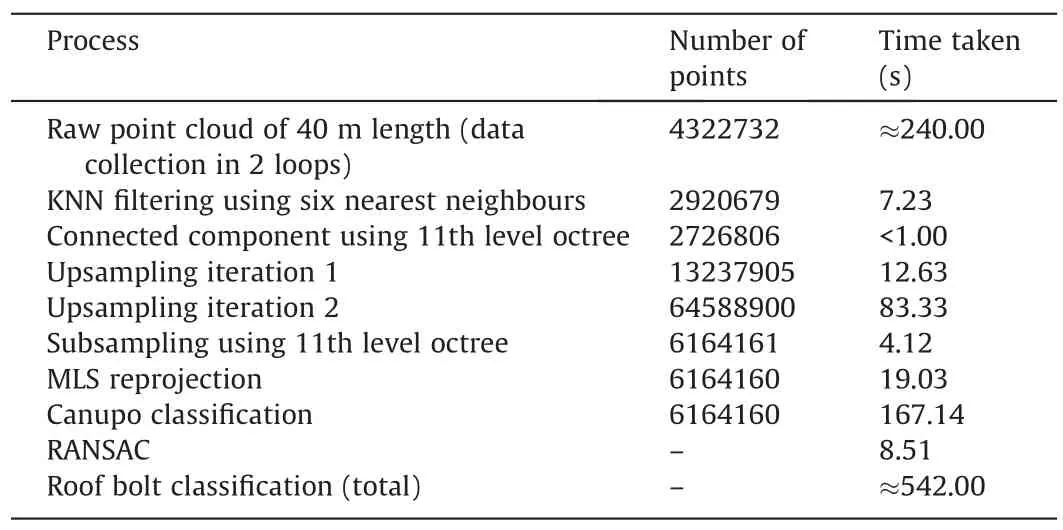
Table 2 Execution time of various steps involved in roof bolt classification.
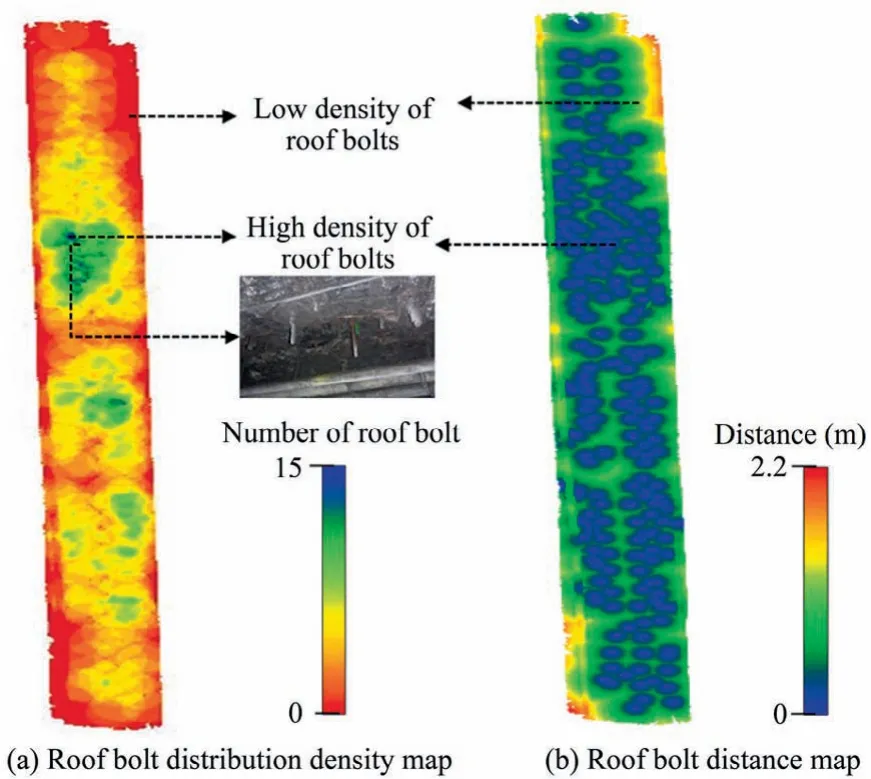
Fig.10.Roof bolt distribution density map generated by creating a colour scale based on the number of roof bolts located within a circle of unit radius and roof bolt distance map generated by creating a colour scale based on the distance of a point from the nearest roof bolt.
The generated map provides quick and customised visualisation capabilities to analyse the number of roof bolts within the given search radius.The maps can also assist in rapid verification of the roof bolt locations against their planned installation.Moreover,keeping a record of roof bolt spacing in certain sections of underground mines is often an operational requirement,where an automated approach for roof bolt detection could be preferred over manual observations.In very large underground mines,some inactive areas have less frequent inspections.The automated generation of the roof density map could easily identify any change in the number of roof bolts which may occur in old areas where a roof bolt may sometimes get dislodged.Further,any corroded roof bolts might deform slightly in orientation and position which can be picked up by the scanner.A separate layer of information on corrosion can be added to roof bolt density and distance maps to quickly locate any corroded roof bolts for safety purposes (based on the availability of intensity information).The classified roof bolt data,when combined with complementary data from other sensors such as extensometers or closure meters,can provide important insights on roof stability and its dependence on roof bolt distribution.Additionally,the distance between each identified roof bolt and the floor can be measured to identify any convergence occurring over time.
The workflow successfully demonstrated roof bolt identification in a challenging underground environment where no other means of monitoring at medium or large scale was available.Good quality pre-processed data and a multi-scale analysis of the roof bolts led to accurate roof bolt identification in the 3D point cloud data.With alterations,the presented approach can be used to analyse other objects underground such as pipelines,signboards,and luminaires.To ensure reliable results the entire algorithmic workflow was developed considering the worst possible scenario in terms of the scanned environment and data density.Similar or higher accuracy can be expected if this approach is used in most other underground environments including metal mines and tunnels.To further enhance the reliability of the result in a complex underground environment some best practice measures can be undertaken.For example,the data collection could be conducted to collect more points on the target object for better classification while preventing any sudden jerks on the scanning device.Also,to maintain high accuracy of the captured point cloud,it is advisable to have a static or less dynamic environment.The study showed that a SLAM based mobile laser scanning system could collect medium scale data in handheld mode quickly while maintaining acceptable accuracy for object identification,which would otherwise be a tedious task using TLS or photogrammetry.The system can overcome the challenge of providing accurate data in suboptimal lighting conditions which makes it useful for the underground space industry.Further work based on the application of alternative approaches of object detection to other case studies could enhance knowledge and validate the efficiency.
4.Conclusion
The study presented an efficient and robust approach to identify roof bolts in 3D point cloud data.The entire process except training is automated and requires no human intervention(apart from preselected threshold values for algorithms) during the execution of the workflow.The employed classifier performs reasonably well in terms of processing time and achieved accuracy.However,a basic understanding of the scales at which an object can be identified could further enhance performance by reducing processing time through the number of scales constraint.Since no other rapid and automated method for analysing roof bolts over medium or large scale is available,the approach can be used to generate assessment results with high accuracy considering the survey challenges in underground mines.The generated roof bolt density and distance maps can assist in better mine management and planning of support structures.Further,the maps generated through multitemporal point clouds can help monitor deformation in mines.Overall,the study aimed to support manual inspection efforts carried out by the coal mining industry as an operational requirement to maintain mine safety.Future work in this area includes spatiotemporal monitoring of roof bolts,combining roof bolt distribution with data from other sensors (such as extensometers,closure meters and strain gauges) for stress-strain analysis,measuring support strength and working resistance,and fine-tuning of the processing algorithm to provide immediate detection of roof bolts for near real-time monitoring and predictions.
Acknowledgement
This study was financially supported by the Australian Coal Industry’s Research Program (ACARP) Project C27057.
杂志排行
矿业科学技术学报的其它文章
- Development of ensemble learning models to evaluate the strength of coal-grout materials
- An updated empirical model for ground control in U.S.multiseam coal mines
- Study on seepage and deformation characteristics of coal microstructure by 3D reconstruction of CT images at high temperatures
- Drilling signals analysis for tricone bit condition monitoring
- The influence of borehole arrangement of soundless cracking demolition agents (SCDAs) on weakening the hard rock
- Numerical assessment of the influence of former mining activities and plasticity of rock mass on deformations of terrain surface
