Physical model test and numerical simulation on the failure mechanism of the roadway in layered soft rocks
2021-04-08XiaomingSunChengweiZhaoYongZhangFengChenShangkunZhangKaiyuanZhang
Xiaoming Sun,Chengwei Zhao,Yong Zhang,Feng Chen,Shangkun Zhang,Kaiyuan Zhang
a State Key Laboratory for GeoMechanics and Deep Underground Engineering,China University of Mining and Technology-Beijing,Beijing 100083,China
b School of Mechanics and Civil Engineering,China University of Mining and Technology-Beijing,Beijing 100083,China
c School of Civil Engineering,Nanyang Institute of Technology,Nanyang 473004,China
Keywords:Failure mechanism Physical model test 3DEC Layered soft rocks Large deformation
ABSTRACT To explore the failure mechanism of roadway in layered soft rocks,a physical model with the physically finite elemental slab assemblage (PFESA) method was established.Infrared thermography and a video camera were employed to capture thermal responses and deformation.The model results showed that layered soft roadway suffered from large deformation.A three-dimensional distinct element code(3DEC) model with tetrahedral blocks was built to capture the characteristics of roadway deformation,stress,and cracks.The results showed two failure patterns,layer bending fracture and layer slipping after excavation.The layer bending fracture occurred at positions where the normal direction of layers pointed to the inside of the roadway and the layer slipping occurred in the ribs.Six schemes were proposed to investigate the effects of layered soft rocks.The results showed that the deformation of ribs was obviously larger than that of the roof and floor when the roadway passed through three types of strata.When the roadway was completely in a coal seam,the change of deformation in ribs was not obvious,while the deformation in the roof and floor increased obviously.These results can provide guidance for excavation and support design of roadways in layered soft rocks.
1.Introduction
The soft rocks with stratified layers at specific orientations,i.e.layered soft rocks,widely distribute in geological strata [1].Although underground chambers should be designed away from layered rocks,many underground openings,such as roadways for mining excavations,are inevitably constructed in layered soft rocks because of the complex ground geology and special requirements[2].Layered soft rocks have a great effect on the stability of the roadway.Roof subsidence,floor heave,and rib shrinkage are the major causes of equipment destruction and catastrophic accidents.In order to reduce accidents to the greatest extent,it is necessary to investigate the failure mechanisms of layered soft rocks during underground excavation.
The main methods for studying the failure mechanism of deep underground openings in layered rocks include theoretical analysis,field experiments,physical model testing,and numerical simulation.Generally,it is impossible to explore all mechanical characteristics by implementing a theoretical model [3].Many studies have been conducted to investigate the mechanical behavior of layered rock masses by field tests [4-6].However,field experiments and in situ tests are limited in both time and cost[7].Physical model testing has been one of the most effective means to investigate the mechanical behavior of layered rock masses.Full-scale experiments are very expensive and difficult to operate,so many scale model tests have been conducted to investigate the failure mechanism of stratified rock masses [8-12].However,small-scale tests are limited by the model size and in situ stresses are not realistically simulated [13].A kind of large-scale physical model test with a new approach,physically finite elemental slab assemblage (PFESA),initially proposed by He et al.,was used to mimic stratified rock masses with different inclinations [1,7,14,15].Gong et al.used PFESA to investigate the failure features of stratified rock masses during tunnel excavation[16-18].They focused on analyzing the linear and nonlinear processes after roadway excavation in stratified rock masses and successfully captured the characteristics of large deformations in a deep underground roadway by infrared thermography.This physical model method can be better employed to investigate the responses of layered rocks in underground excavations.
In addition to physical model tests,numerical simulations with continuum methods are widely used to investigate failure mechanisms of underground excavations of layered rocks [19-25].Although floor heave has been studied by the PFESA approach and numerical simulations with FLAC3D,the obvious limitation was that they failed to capture the development of cracks in numerical simulations [26].The limitations can be overcome by using discontinuum methods,which can provide a better understanding of the failure mechanism of layered rocks [27-35].The development of discrete element method (DEM) was aimed at straight representations of discontinuum.Three-dimensional distinct element code (3DEC) [36],one of the most commonly used DEM codes,is considered to be more suitable for simulating layered soft tunnels [37].Based on 3DEC,Cui et al.showed that the dip direction has a great influence on the main deformation region of layered rocks around a tunnel [38].Shreedharan and Kulatilake used 3DEC to investigate the stability of two shaped tunnels which were driven into a soft sandy shale stratum [39].
When the roadways were excavated,roof subsidence,floor heave,and rib shrinkage occurred frequently,especially when the roadway was in layered soft rocks.However,few physical model tests are used to study the failure mechanism of roadway considering both the rock structure and rock lithology.In this paper,a physical model test with a 10° slightly inclined strata was established by using the PFESA method to investigate the failure mechanism of roadway in layered soft rocks.The roadway was in the coal seam,with sandstone roof and mudstone floor.Infrared thermography was used as a noncontact technique to inspect cracks and defects inside the materials.A 3DEC numerical simulation model was also built to capture the development process of fractures.To overcome the occurrence of fractures only along predefined joints,the tetrahedral blocks were divided in 3DEC to research roadway stability[40-42].Finally,the effect of coal seam thickness on deformation and failure was investigated by the numerical simulation.
2.Physical model test
2.1.Experimental background
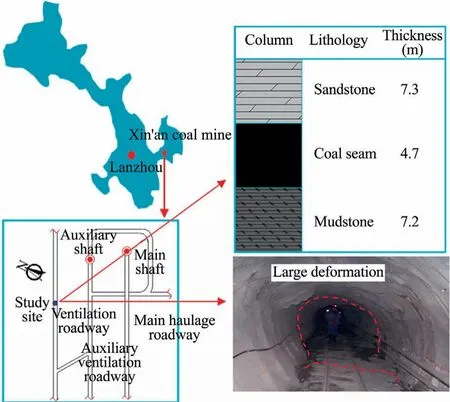
Fig.1.Location of Xin’an coal mine,with lithology and large deformation of the roadway.
Deeply buried roadway in soft rock strata always has the problem of large deformation.A deep roadway located in Xin’an coal mine,Gansu Province,eastern China,was used as the background for this paper(Fig.1).The roadway is 800 m under the ground.The main lithology is sandstone,coal seam,and mudstone.The dip angle of the geological strata is an average of 10°.The roadway suffered from large deformation with roof subsidence,rib shrinkage,and floor heave.In the physical model test,the roadway was simplified as a circle.The physical and mechanical parameters of the roadway surrounding rock are shown in Table 1.
2.2.Similar materials and elementary slabs
In physical model studies,the selection of the ratio of similar materials is very important.This factor determines not only whether the model can correctly reflect the characteristics of the prototype,but also the smooth performance of the physical model.
The physical model must satisfy similar requirements in geometric,physical,and mechanical properties,boundary conditions,initial stress conditions,etc.However,it is impossible to satisfy all similar parameters.According to previous studies [43,44],the parameters were selected as follows.

where CL,Cσ,Cε,Cδ,CE,Cμ,Cγ,Cρ,Cf,CC,CR,and CBσrepresent the similarity constants for geometry,stress,strain,displacement,deformation modulus,Poisson’s ratio,body force,density,friction coefficient,cohesion,compressive stress,and boundary stress,respectively.The subscript p indicates that the corresponding parameter is the prototype,while the subscript m indicates that the corresponding parameter is the physical model.The symbols L,σ,ε,δ,E,μ,γ,ρ,f,C,R,and σBdenote the parameters of geometry,stress,strain,displacement,deformation modulus,Poisson’s ratio,body force,density,friction coefficient,cohesion,compressive stress,and boundary stress,respectively.
Meanwhile,the model should meet the differential equations of equilibrium,so these similarity constants should meet the following requirement.

In this study,a mixture of plaster and water were selected as the model material to satisfy the requirements of the scaled test.Sandstone,coal seam,and mudstone were simulated by elementary slabs with dimensions of 400 mm×400 mm×20 mm.Three water-plaster ratios were used for the model:0.8:1 for sandstone,1:1 for mudstone,and 1.2:1 for coal.Fig.2 shows the manufacturing process of the elementary slabs.The paste was formed according to the water-plaster ratio,then put it into the mold,which was made of plexiglass.When the paste hardened a little,it was taken out of the mold and dried on the shelf for about one month.
The mechanical tests of artificial rocks are displayed in Fig.3.The main parameters of the elementary slabs are listed in Table 2.The geometric similarity constant is 12,stress similarity constant is 8,and body force similarity constant is 0.67,and they meet Eq.(2).

Table 1 Mechanical and material properties of real rocks.
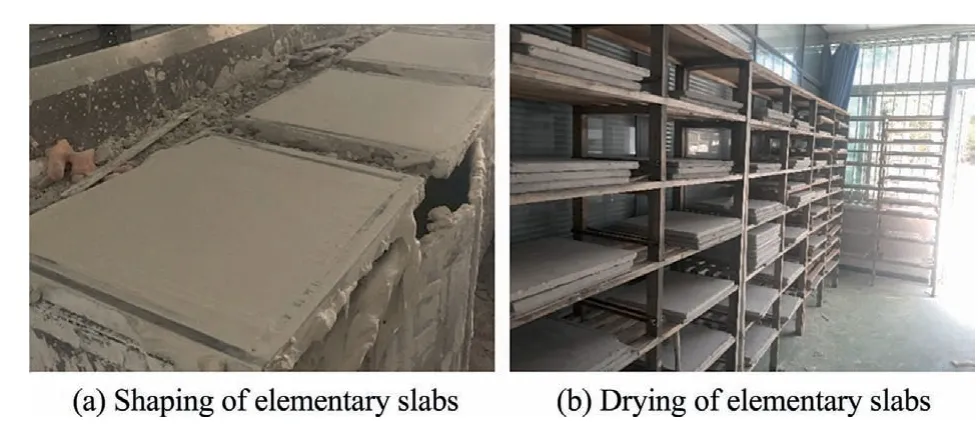
Fig.2.Production of elementary slab.

Fig.3.Mechanical tests of artificial rock.
2.3.Physical model test equipment
The physical experiment was conducted at the State Key Laboratory for GeoMechanics and Deep Underground Engineering,China University of Mining and Technology-Beijing.The physical system consisted of a control system,experimental platform,and data collection equipment,as shown in Fig.4.
The experimental platform could be used for experiments with model dimensions of 1600 mm×400 mm×1600 mm,and it consisted of a steel frame,hydraulic jack,and loading plate.The hydraulic jack was controlled by the control system,and it could apply loads on the upper,lower,left,and right of the model through the loading plate,which could simulate real in situ stress conditions.An infrared camera and Canon video camera were used in this experiment.The infrared camera CX320 was made in Korea and stored the IR radiation temperature image data with an image matrix of 288 × 384 pixels.The resolution of the thermal imaging system is 80 mk.It can detect the temperature variation of 0.08°C.The video camera recorded the image data,as shown in Fig.4c.
2.4.Physical model experimental scheme
To reduce the friction of the model during the experiment,antifriction paper (0.5 mm thick polytetrafluoroethylene material made in Hebei Shaozuo Sealing Material Co.,Ltd.) was pasted on the loading plates.The elementary slabs of mudstone,coal seam,and sandstone with dip angle of 10° were laid successively,as shown in Fig.5a.The bottom boundary was constrained by displacement;the front and rear boundaries were constrained by the acrylic sheet.The loads were calculated through a similarity calculation based on the in situ stress test results.According to the physical stress similarity constant Cσ (Cσ=8),2.5 MPa was applied at the top of the physical model and 4.5 MPa was applied at the lateral sides,as shown in Fig.5b.Near the roadway,four measurement points were set to measure the displacement.
The whole experimental process consisted of states A and B.The loading scheme is shown in Fig.6.There were two processes,stages A and B.An additional load of 0.2 MPa was applied at the top and lateral sides in A-1.When the load reached 2.5 MPa at the top of model,the load increment was no longer applied at the top side.An additional load of 0.2 MPa continued to be applied at the lateral sides in A-2 until the load reached 4.5 MPa.After the initial rock stress of the roadway was completed,the whole roadway was excavated at once.The electric drills were used to drill through the centre of roadway in the front and back of the model as soon as possible.When the roadway was completely drilled through,the electric drills were used to expand the excavation area until the roadway shape was formed.No support was considered in the model test.After excavation,the tunnel was kept for 150 min,and five stages,B-1-B-5,were obviously observed in stage B.
3.Numerical model
The model was generated with the‘‘fish”program.The first step was to define the whole model using the POLY command,and then JSET was used to define three rock strata.Due to the limitation of computer performance dealing with lots of blocks,the numerical model was built with dimensions of 1600 mm × 200 mm ×1600 mm.To keep the same rock structures as the physical model test,the sandstone,coal seam,and mudstone were divided into layers with a thickness of 20 mm.In order to better simulate the fracture behavior of rocks,the layers were divided into 249082 tetrahedral blocks with an average edge length of 10 mm in a cuboid area of 500 mm× 200 mm× 500 mm.The area surrounding the cuboid area was divided into 28832 tetrahedral blocks with an average edge length of 40 mm in a cuboid area of 800 mm × 200 mm × 800 mm to avoid a sudden large increase in block.The remainder of the model was divided by the bedding faces with a thickness of 20 mm.The numerical simulation modelis shown in Fig.7.In this paper,layered rock model is more inclined to simulate the layered effect of sedimentary strata.Therefore,the authors paid more attention to the bedding planes and neglected the sub-vertical discontinuous in the numerical simulation model.

Table 2 Main parameters of similar simulated rock materials.

Fig.4.Physical model test equipment.
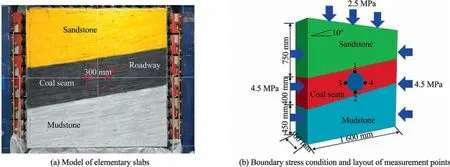
Fig.5.Elementary slabs model and boundary stress condition.
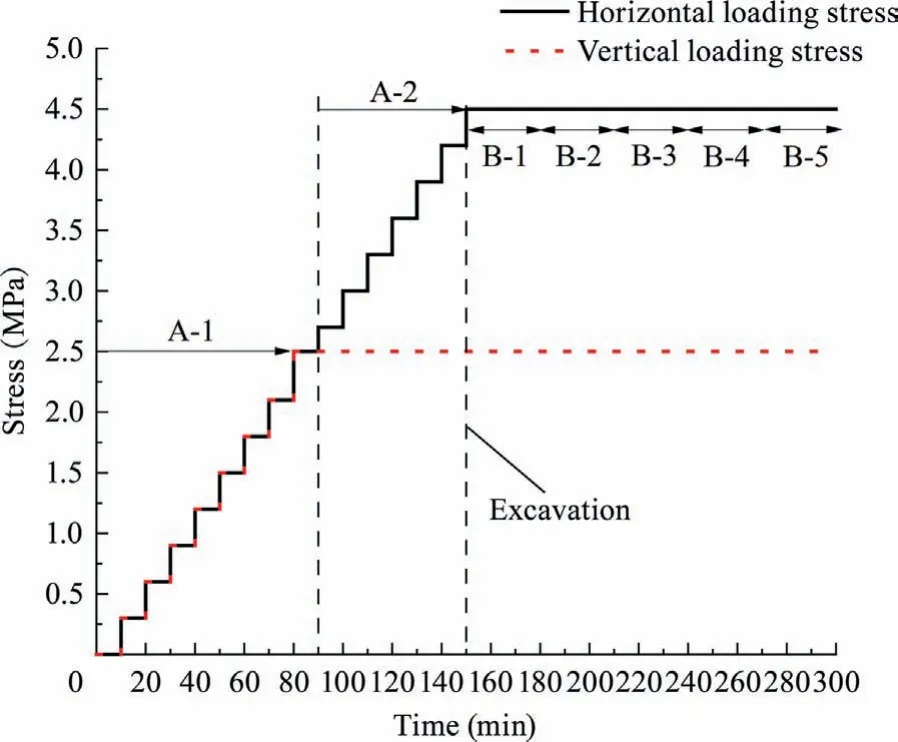
Fig.6.Loading scheme.
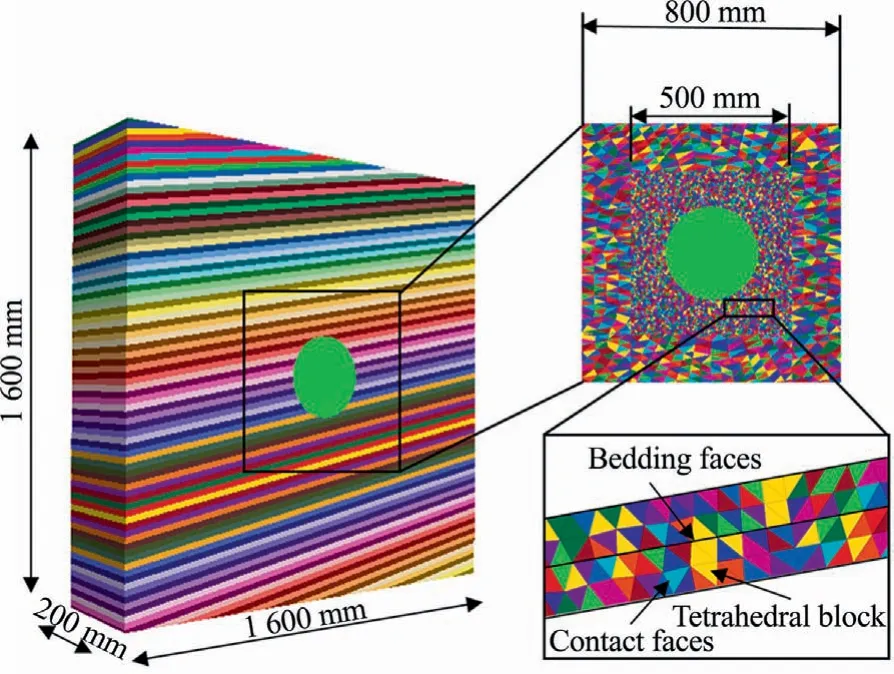
Fig.7.Numerical simulation model.
In the numerical model,layers were connected by the bedding and contact faces.The tetrahedral and layered blocks were assumed to behave as elastic materials.The Coulomb slip joint model was used to represent the behavior of the bedding and contact faces between tetrahedral blocks.The layers will fail with shear and tension along the bedding and contact faces,which depends on the contact force and mechanical properties of the contact faces.To be consistent with the physical model test,the cohesion and tensile strength of bedding faces were assumed to be zero,and these micro-parameters in contact faces were obtained from the same size of uniaxial compression tests when the numerical simulation test results were consistent with the physical model test results,as shown in Fig.8.The parameters used for blocks and joints are listed in Tables 3 and 4.The front and rear boundaries were fixed in displacement.Horizontal stress of 2.5 MPa was applied on the top boundary and vertical stress of 4.5 MPa was applied on the lateral boundaries.The roadway was excavated by deleting blocks.
4.Results and discussion of physical model test
4.1.Failure process
The failure process of the roadway after excavation is displayed in Fig.9.In the early stages,the shape of the roadway stayed round.Microscopic cracking did not result in any obvious macroscopic fractures,as shown in Fig.9a and b.As time progressed,microscopic cracks began to occur with the blocks peeling off in the upper right corner of the roadway (Fig.9c).By this point,macroscopic fractures had formed.As time progressed,more obvious fractures appeared around the roadway,especially in the floor.The blocks of floor began to heave due to the bending layers,as shown in Fig.9d.Over time,the roof and floor of the roadway suffered from serious separation and heave,respectively,because of the layer bending fracture.Finally,the roadway suffered from large deformation.In addition,the shape of the roadway turned into an ellipse (Fig.9e).
The displacement curves of the roadway are illustrated in Fig.10.Although the roof and floor suffered from serious bending fracture,the deformation of ribs was larger because of the layers slipping in the ribs,which could be observed from the change of shape of the roadway (Fig.9).
4.2.Temperature data
Fig.11 shows the temperature change during the failure process.The colors in the positive range represent high temperature,which corresponds to high heat energy due to friction,stress concentration,etc.The colors in the negative range represent low temperature,which corresponds to low heat energy caused by stress release,tensile cracking,etc.
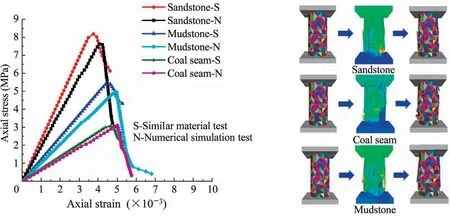
Fig.8.Results of uniaxial compressive test and stress-strain curves for physical model and numerical simulation tests.

Table 3 Rock mechanical parameters.
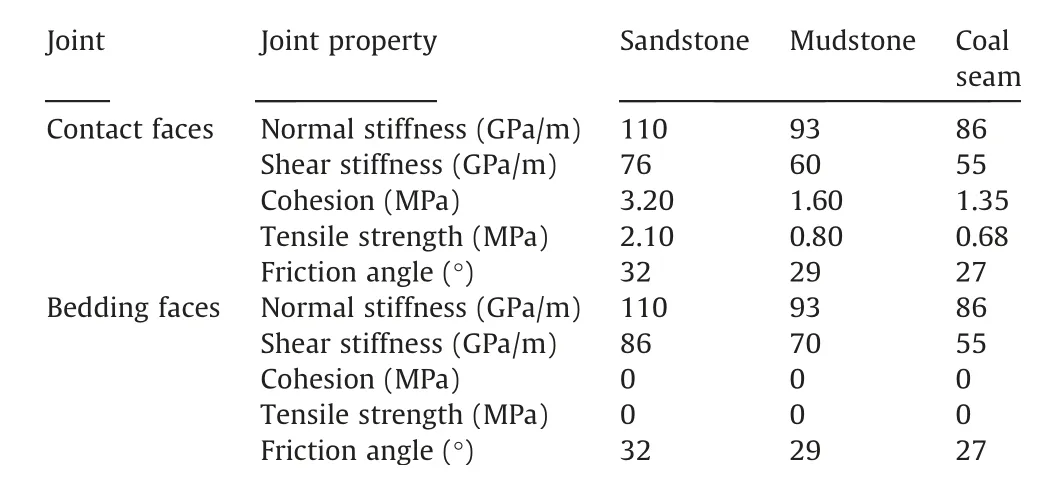
Table 4 Joint mechanical parameters.
In the first stage,there was little obvious macroscopic temperature change around the roadway.Low temperature occurred in the rock surrounding the roadway,indicating that a few cracks occurred(Fig.11a).As time progressed,the temperature increased in the bottom left corner of the roadway.As shown in Fig.11c,the temperature ranged from -0.3 to 0.2 °C because of concentrated stress,leading to the generation of microscopic cracks in the bottom corner of the roadway.Over time,the temperature change was obvious,as illustrated in Fig.11d.The high temperature ranging from 0 to 0.7°C propagated to the bottom of the roadway associated with the generation of macroscopic fractures in the floor.In addition,the temperature around the roadway surface ranged from-0.3 to 0.2 °C,indicating that deformation occurred around the roadway surface.
Finally,the roadway suffered from serious deformation.The span of high temperature expanded to the whole bottom of the roadway,as shown in Fig.11e.The change of temperature was still observed in the roof and floor,indicating that fractures were occurring in these places.It should be noted that the temperature of the shallow surrounding rocks decreased,indicating that a lot of new friction occurred in this area,consuming energy.
5.Results and discussion of numerical simulation
5.1.Failure process
It is clear that the failure mechanism obtained by 3DEC showed good agreement with the physical model test results (Fig.12).In the numerical simulation,B-1,B-2,B-3,B-4,and B-5 correspond to the time steps of 100,200,500,1000,and 1800,respectively.In the early stages,the shape of the roadway stayed round,indicating that the deformation was too small and homogeneous to be visualized,as shown in Fig.12a and b.Small fractures occurred in the floor that could be seen with the naked eye,as shown in Fig.12c.As the steps progressed,the layer bending was obvious,as shown in Fig.12d and e.It should be noted that the bending fracture occurred at positions where the normal direction of the layers pointed to the inside of the roadway.Finally,the roadway suffered from large asymmetric deformation with rib shrinkage and floor heave.
5.2.Deformation of roadway

Fig.9.Failure process of physical model test.
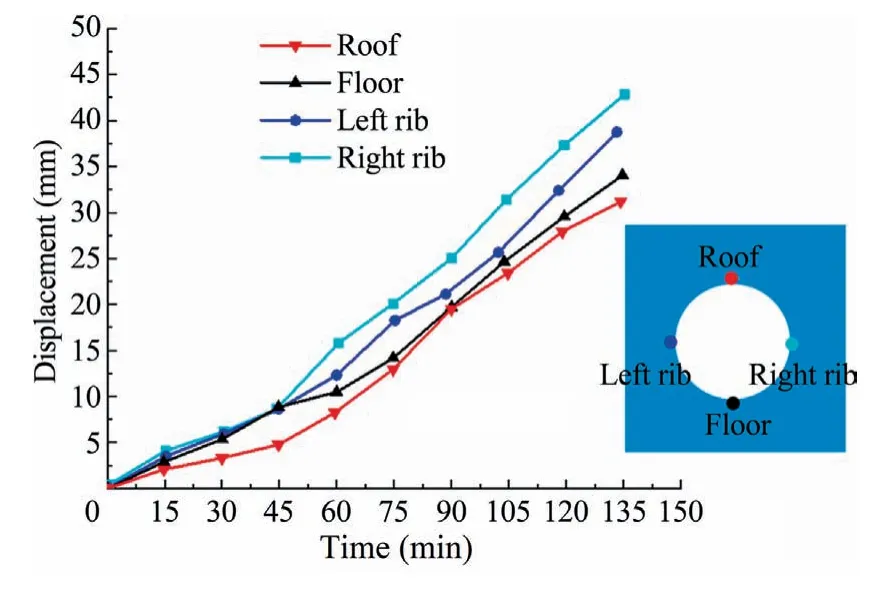
Fig.10.Displacement curves of roadway under physical model test.
Roadway excavation disturbs the stress state and stability of the surrounding rock mass.A new equilibrium of displacement redistribution does not occur instantaneously,but gradually.The displacement of roadway is illustrated in Fig.13.At stage B-1,displacement appeared around the roadway.By this point,the roadway appeared to be round.Over stages,the deformation propagated along the ribs.The maximum displacement was 10 mm in the right rib,as shown in Figs.13c and 14.Obvious layer bending fracture in the roof and floor can be seen in Fig.13d,and the deformation of the ribs was still larger than that of the roof and floor.The maximum displacement was 21 mm in the right rib.At stage B-5,the layer bending fracture and layer slipping continued to occur.The displacement of roof,floor,left rib,and right rib was 28,33,38,and 42 mm,respectively.The deformation in the ribs was more than the roof and floor,which resulted in the roadway turning to an ellipse.
The maximum displacement of roof,floor,left rib,and right rib was 31,34,38,and 42 mm,respectively,in the physical model test,as shown in Fig.10.Although little deviation existed between the numerical simulation and physical model results,the deformation trend of the simulation was consistent with the model,indicating that the results of the numerical simulation test were reliable.
5.3.Maximum principal stress
Knowledge of the stress change is very important in understanding the failure mechanism of the roadway.Figs.15 and 16 show the maximum principal stress distribution around the roadway at different time steps.After excavation,the maximum principal stress decreased sharply,especially in the ribs,as shown in Figs.15 and 16a.At this time,the maximum principal stress of the right rib reached the lowest value of 1 MPa.As the steps progressed,the location of concentrated stress was horizontally away from the roadway,further into the ribs of coal,which was associated with the destressed scope enlarging around the roadway surface.At stage B-2,the maximum principal stress of the roof reached the lowest value of 3 MPa.After stage B-2,the maximum principal stress increased gradually in the floor,roof,and left rib,while the change in right rib was not obvious.When the steps reached stage B-3,the ratio of concentrated stress to vertical stress was approximately 1.8 in the floor.At stage B-4,the maximum principal stress in the floor reached the maximum value,and the magnitude of concentrated stress increased to 2.4 times the vertical stress,as shown in Figs.15 and 16d.At this moment,the floor began to bend fracture,corresponding to Figs.12d and 13d.As steps progressed,the maximum principal stress decreased sharply,indicating that the floor suffered from serious bending fracture.The maximum principal stress of the right rib,roof,and left rib continued to increase slightly,and there was some compressive stress in the ribs,as shown in Fig.16d.In the end,the maximum principal stress of the roof decreased sharply,indicating that the roof underwent bending fracture,as shown in Figs.15 and 16e.Both the roof and floor suffered bending fracture at stage B-5.There was obvious compressive stress in the ribs,indicating that the ribs suffered from serious shear failure.
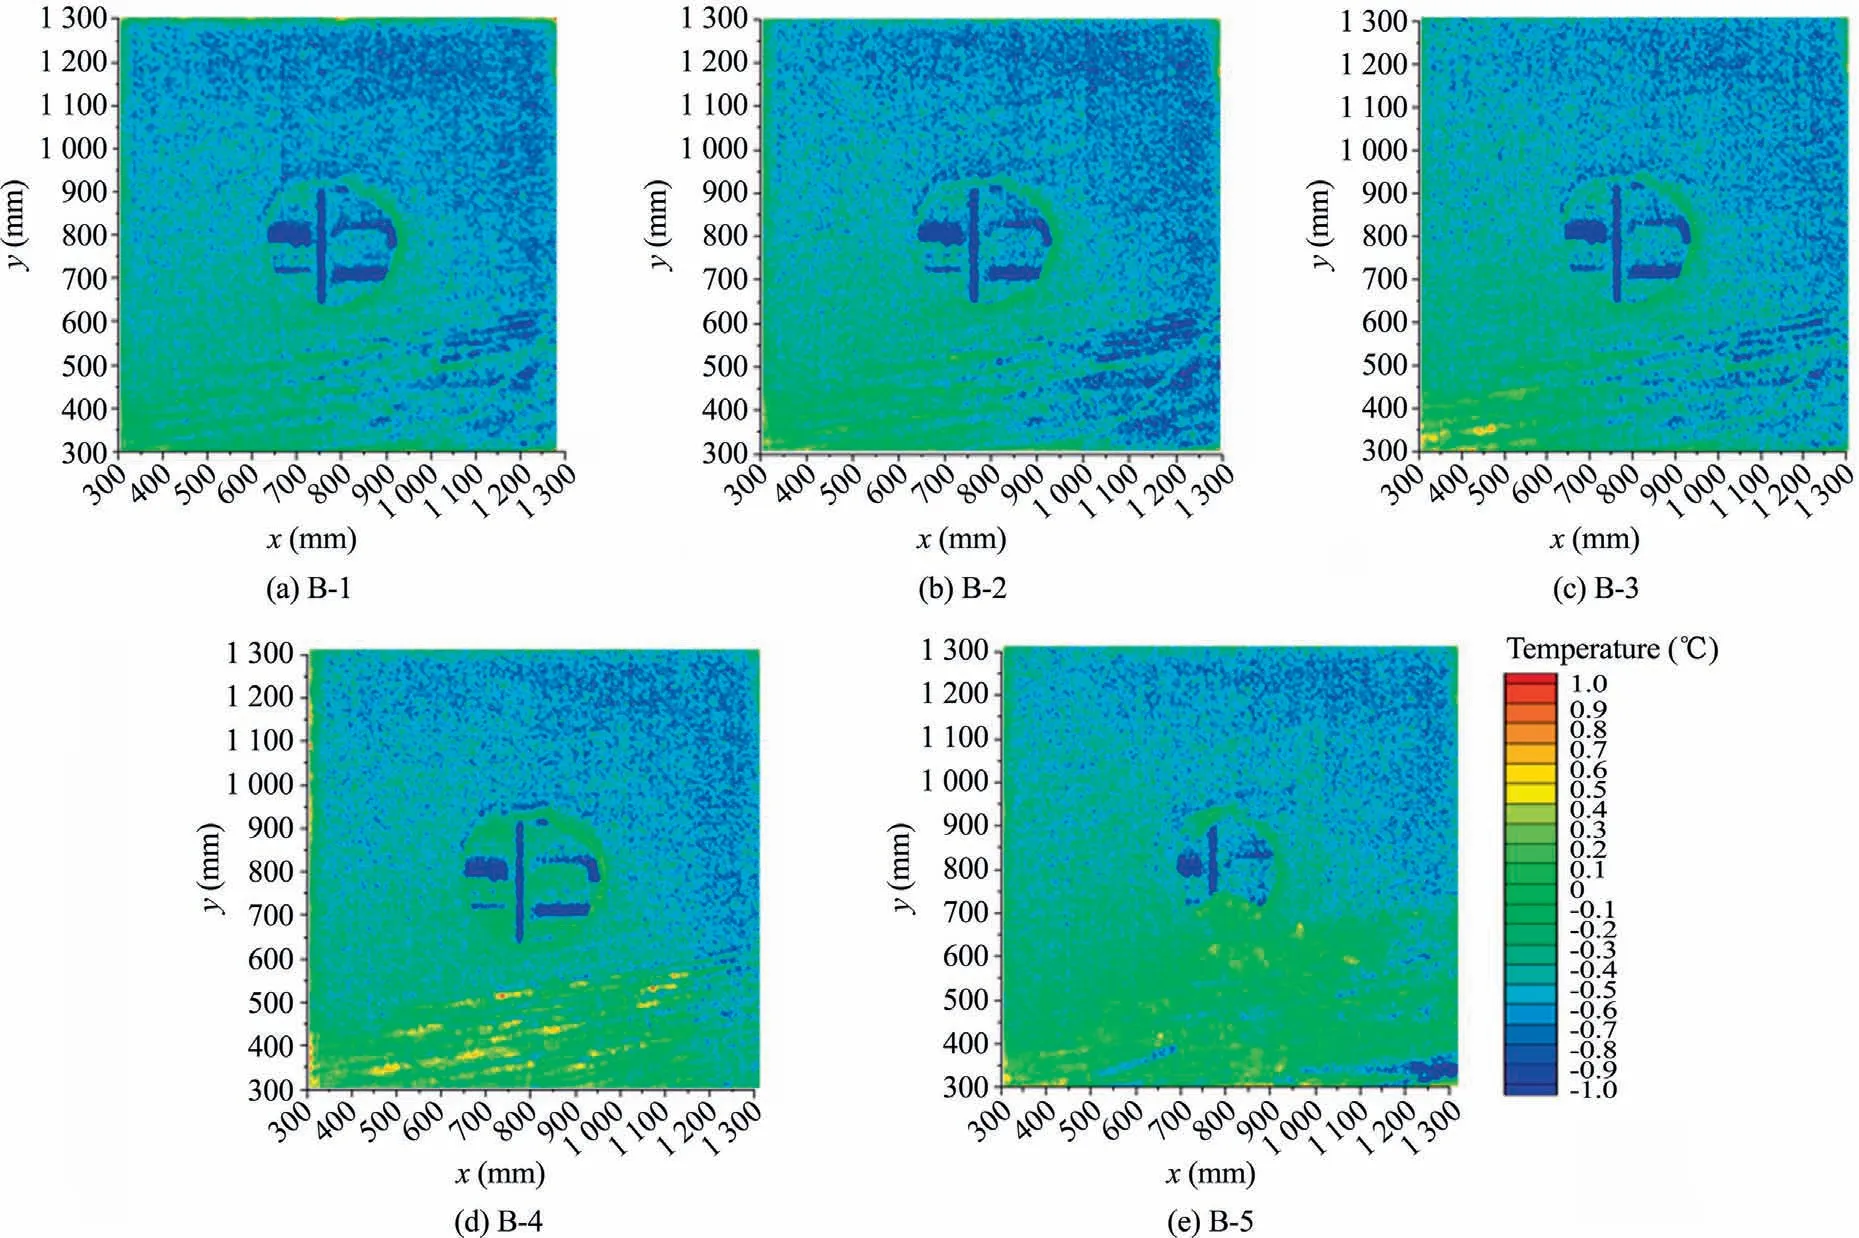
Fig.11.Temperature change process after excavation.
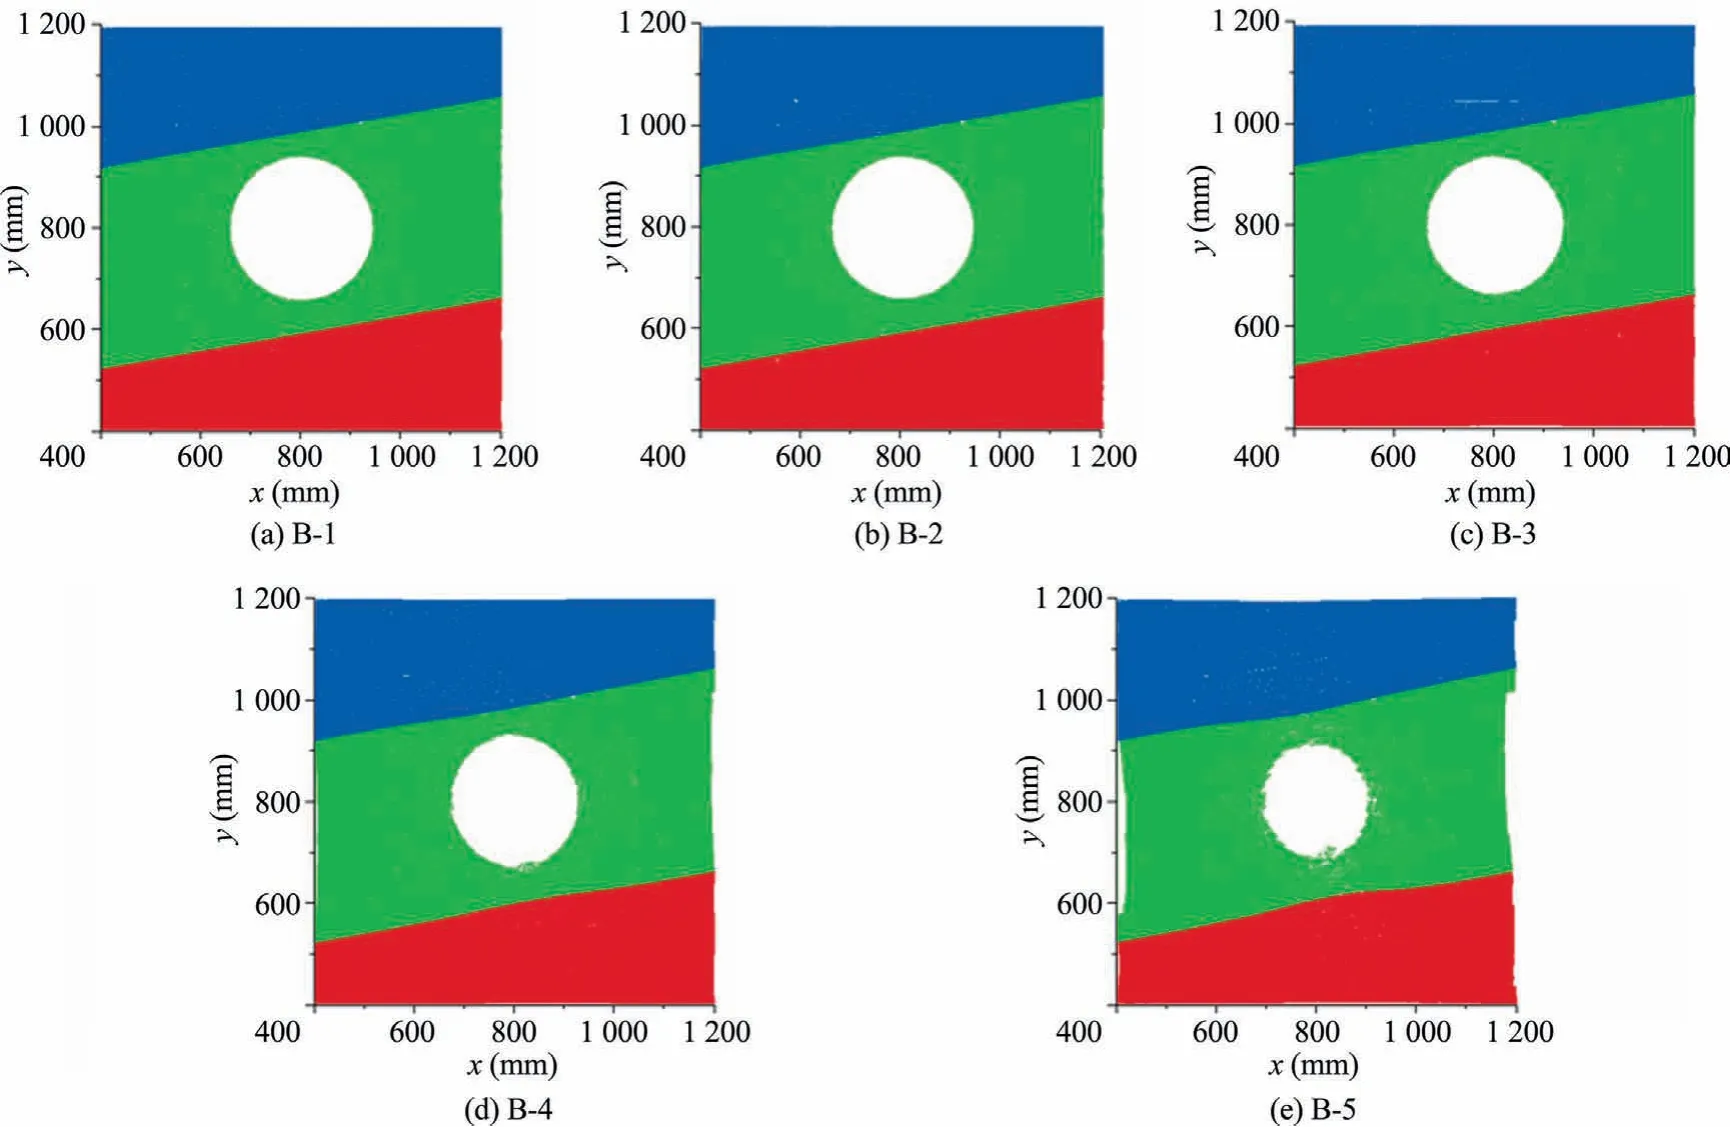
Fig.12.Failure process of numerical simulation test.
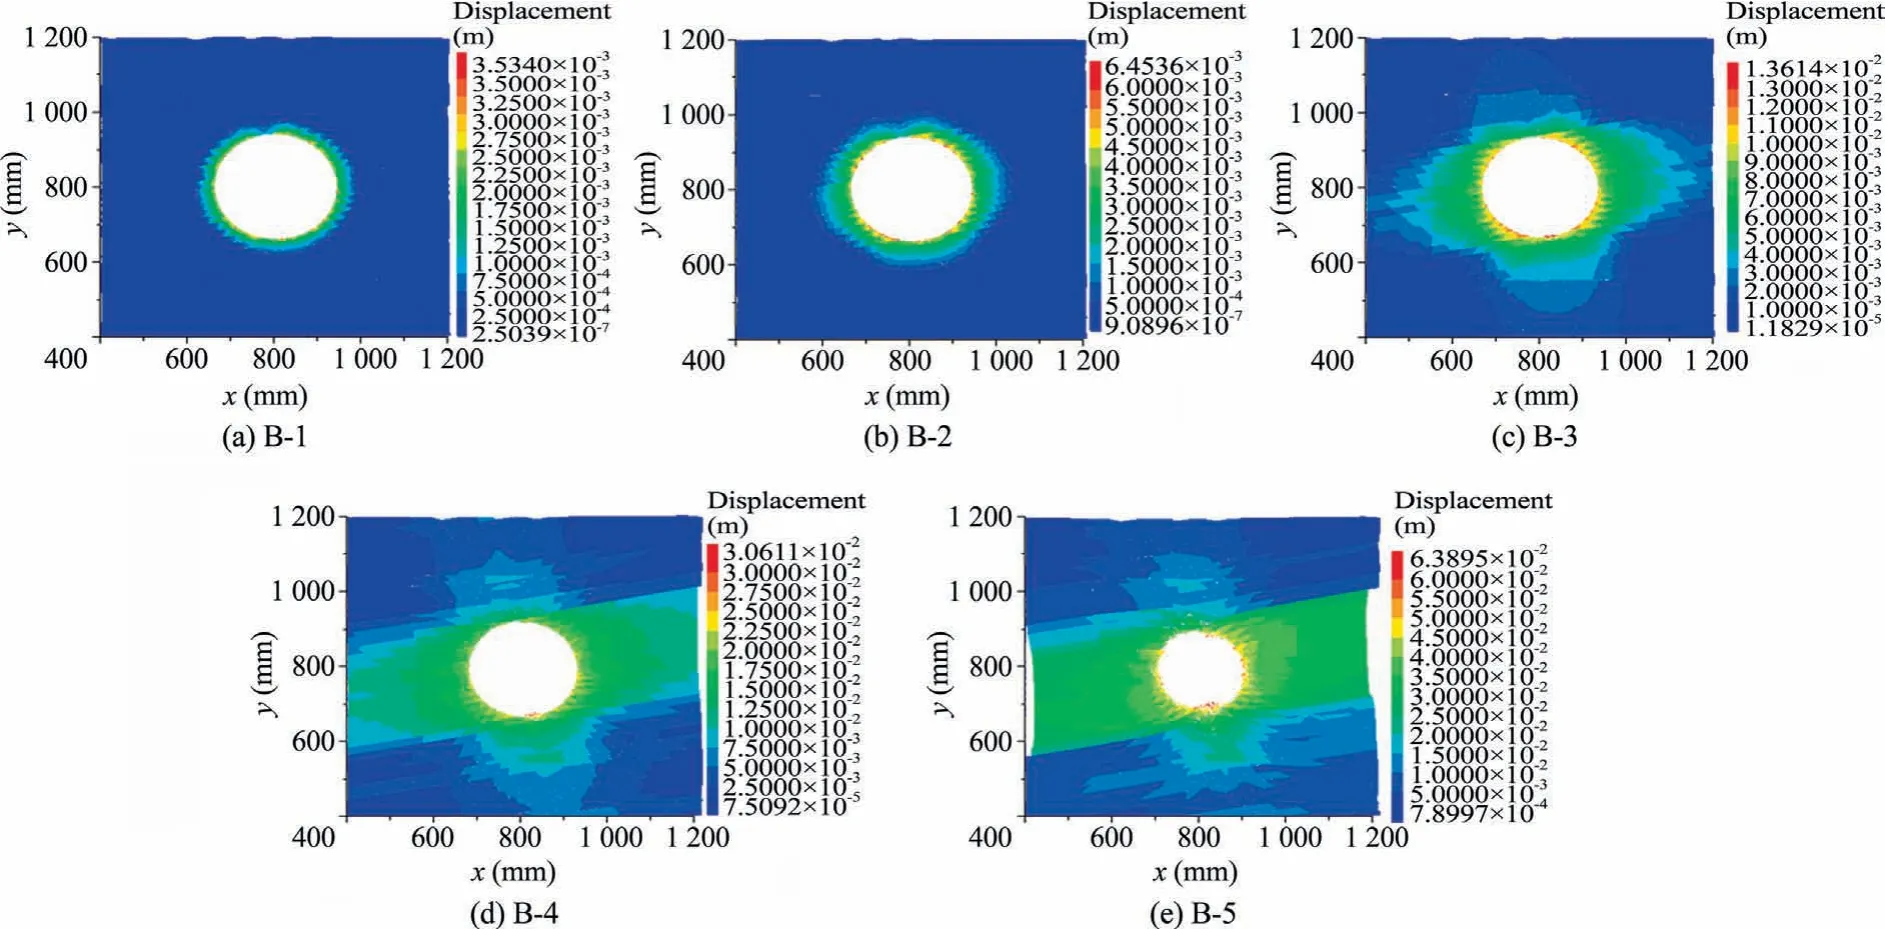
Fig.13.Displacement of roadway after excavation.
5.4.Minimum principal stress
Fig.17 shows the minimum principal stress distribution around the roadway at different time steps,demonstrating that areas near the roadway surface exhibited much tensile stress.At the early stages,tensile stress appeared around the roadway,especially in the ribs,due to the stress release,as shown in Fig.17a.As the steps progressed,the extent of tensile stress in the ribs further increased,which was associated with the extension of tensile stress in the roof and floor,as shown in Fig.17b.Over the steps,the span of tensile stress in the roof and floor reached the sandstone and mudstone,as shown in Fig.17c and d.Finally,shallow rocks underwent much tensile stress when the roadway suffered from large deformation,indicating that much tensile failure occurred around the roadway,as shown in Fig.17e.
5.5.Development of cracks
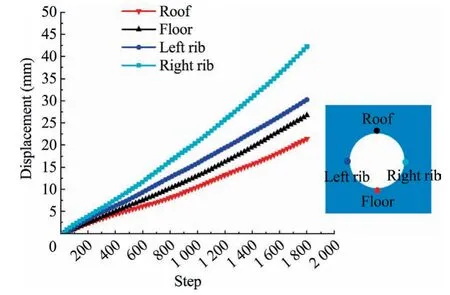
Fig.14.Displacement curves of roadway under numerical simulation test.
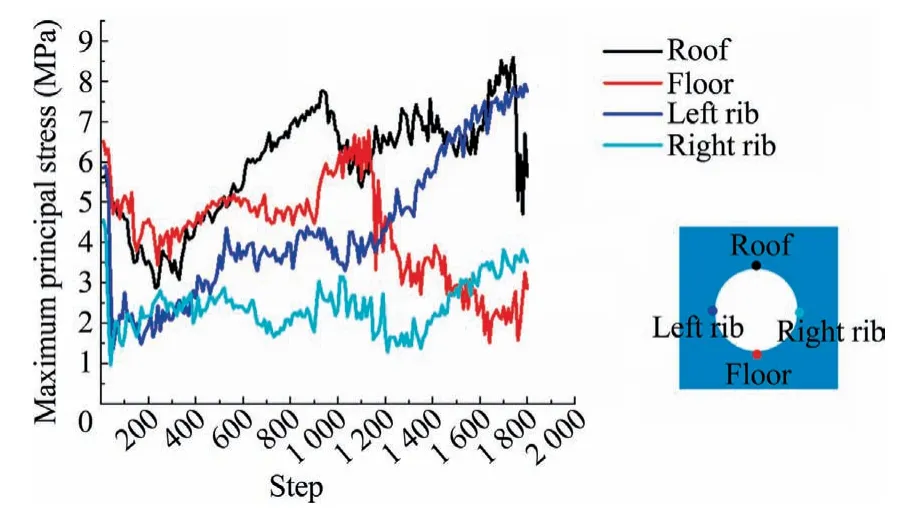
Fig.15.Curves of maximum principal stress.
Compressive and tensile stress lead to the generation of cracks,and it is important to study the initiation and propagation of cracks caused by excavation.Crack propagation and failure damage(shear damage is defined as Ds=(As/A) × 100% and tensile damage is defined as Dt=(At/A) × 100%,where Asis the total area of shear cracks,Atis the total area of tensile cracks,and A is the total area of contact face) of the roadway after excavation were captured by 3DEC software,as shown in Figs.18 and 19.The shear and tensile cracks are marked in red and blue,respectively.
In the early stages,both shear and tensile cracks appeared around the roadway.The shear cracks mainly appeared in the top and bottom corners,while the tensile cracks mainly appeared in the ribs,as shown in Fig.18a.By this point,cracks developed only within the coal seam,and there were more shear cracks than tensile cracks.Over time,the cracks gradually increased,and the extent of the crack zone further increased.The shear cracks also enlarged to the floor and roof,while the tensile cracks mainly occurred in the ribs.The shear cracks reached the interface of the coal seam and sandstone,causing their propagation along the interface,as shown in Fig.18b and c.Cracks did not appear in the top sandstone because of its greater strength,while cracks occurred in the bottom mudstone.Microscopic cracks did not result in macroscopic cracks,as shown in Fig.18c.As the steps progressed,the cracks continued to increase around the surrounding rocks,some cracks began to propagate in the top sandstone,and more cracks propagated in the bottom mudstone,as shown in Fig.18c and d.By this point,macroscopic cracks formed in the floor and roof.The span of the crack zone enlarged to the same size as the monitoring areas of coal seam and mudstone,as shown in Fig.18e.A few crack zones were distributed in the sandstone.In the whole process of crack development,there were more areas of shear cracks than tensile cracks,as shown in Fig.19.The shear damage was 5.76% and the tensile damage was 2.62% at stage B-5.Both the shear and tensile cracks resulted in roadway failure.
5.6.Effect of layered soft rock
The authors studied the failure mechanism of roadway in layered soft rocks,which was influenced by their thickness.Six schemes were provided and represented by the ratio of layered soft rock thickness to roadway diameter (2L/D,where L is the rock thickness,and D is the roadway diameter):0.33,0.87,1.33,1.67,2.47,and 7.53 (Fig.20).
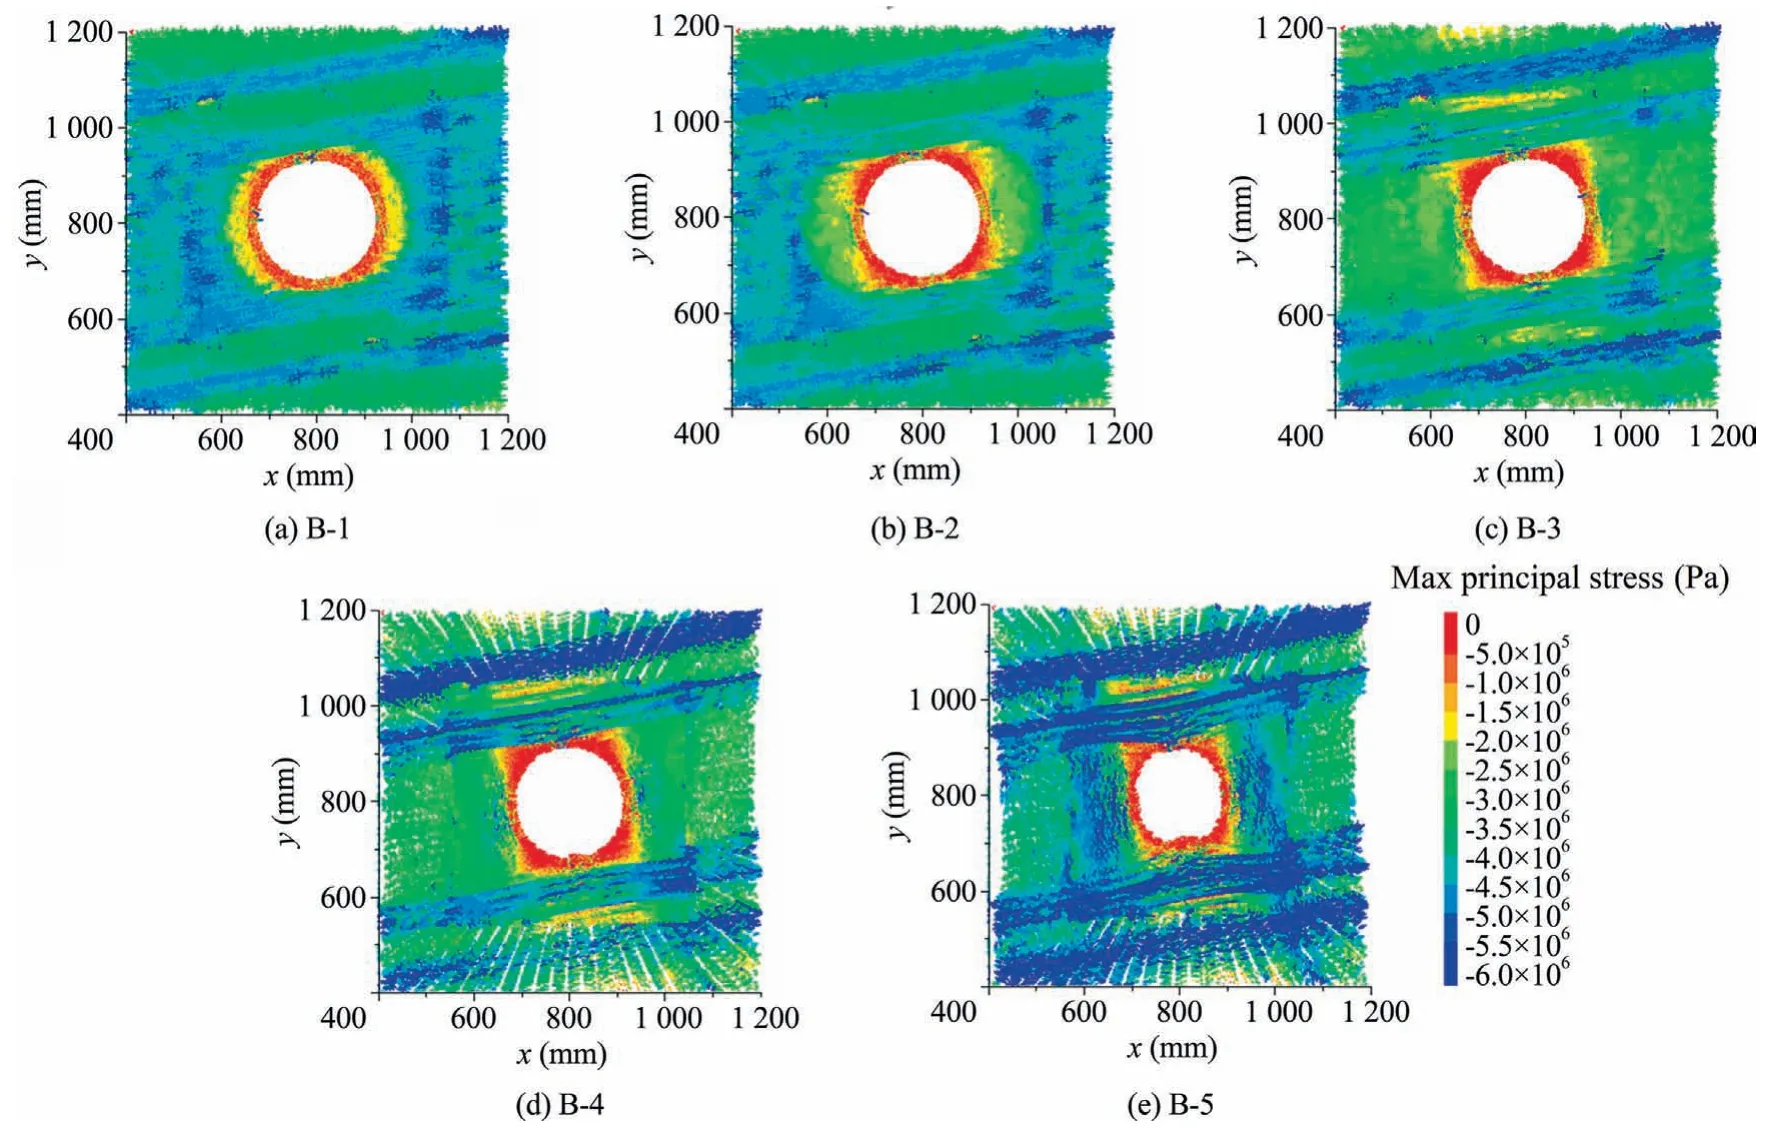
Fig.16.Distribution of maximum principal stress around the roadway.
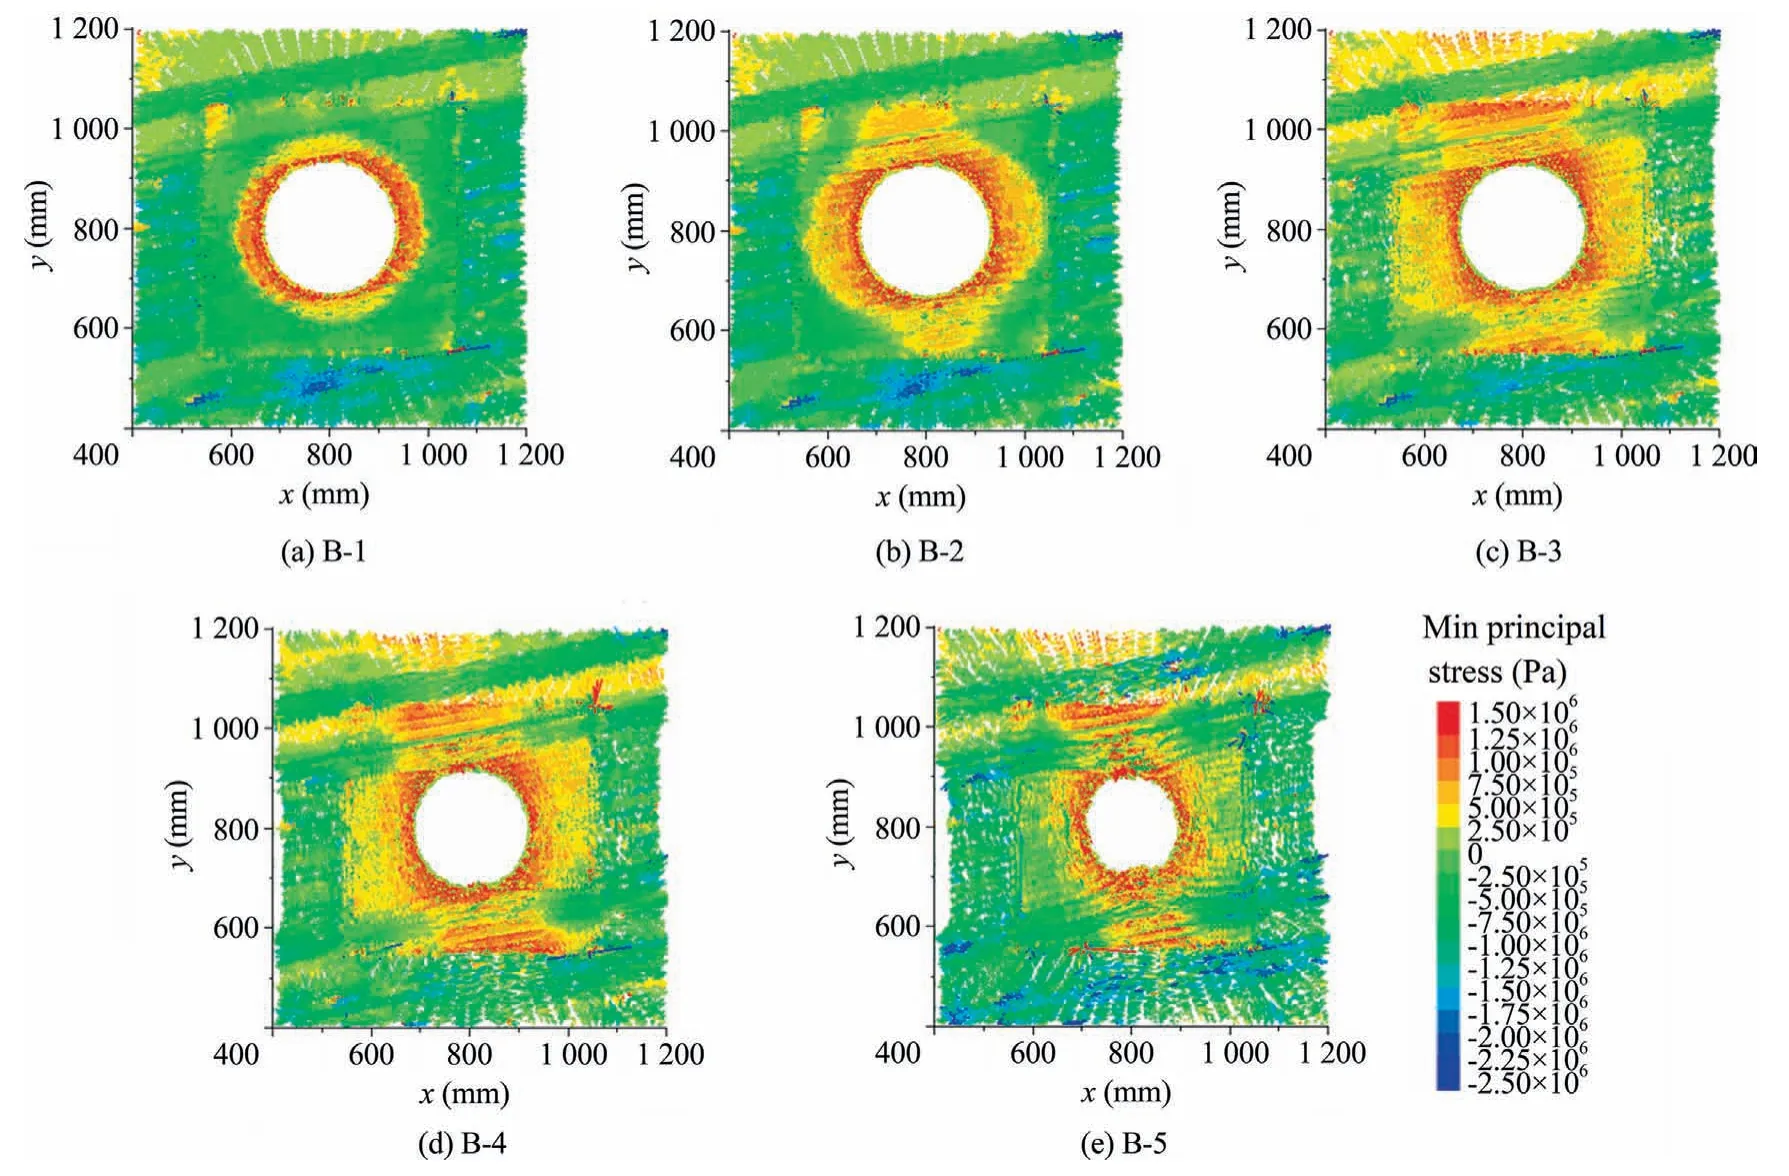
Fig.17.Distribution of minimum principal stress around the roadway.
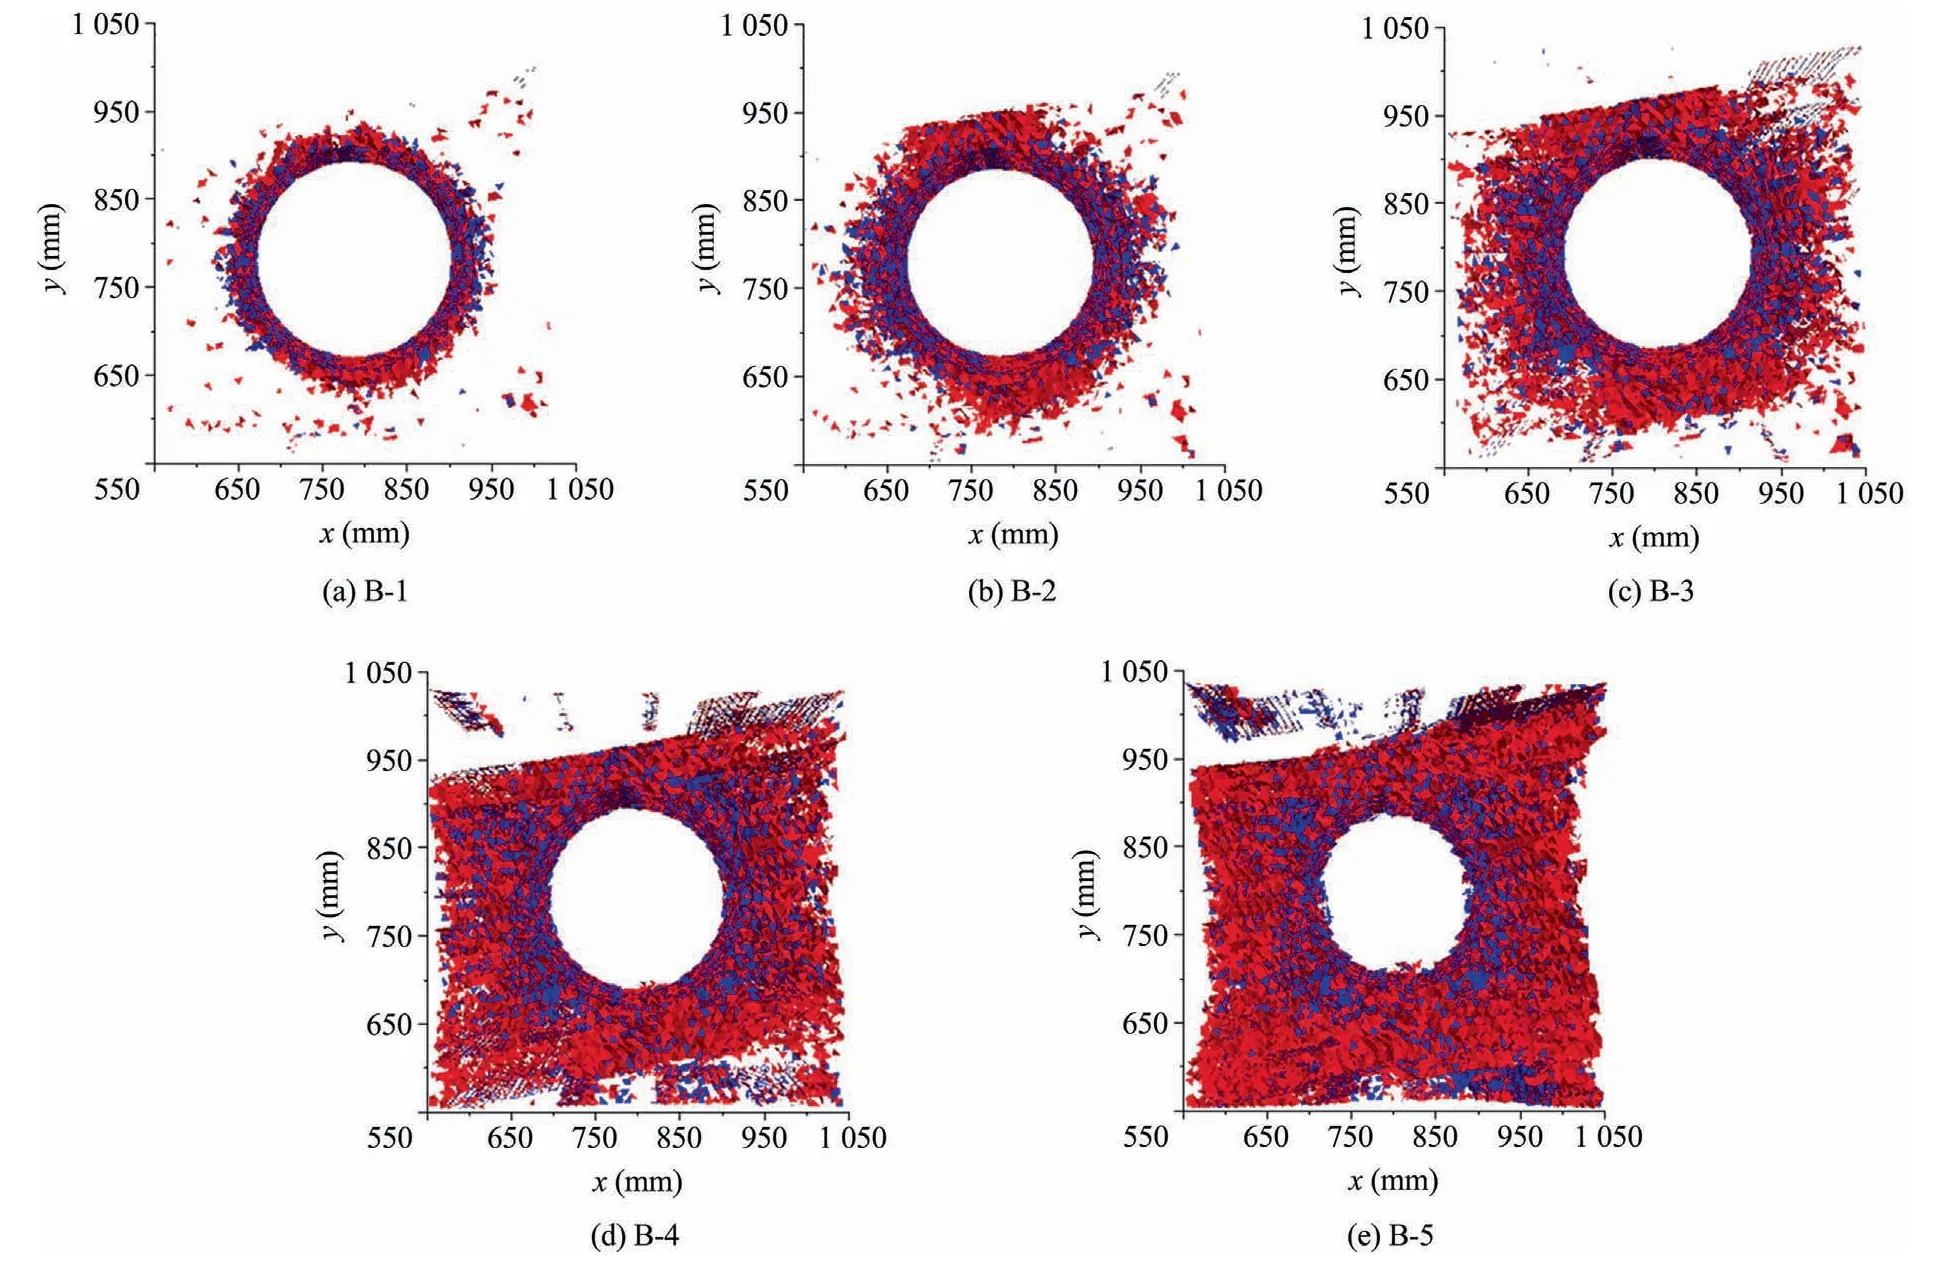
Fig.18.Shear and tensile failure after excavation.
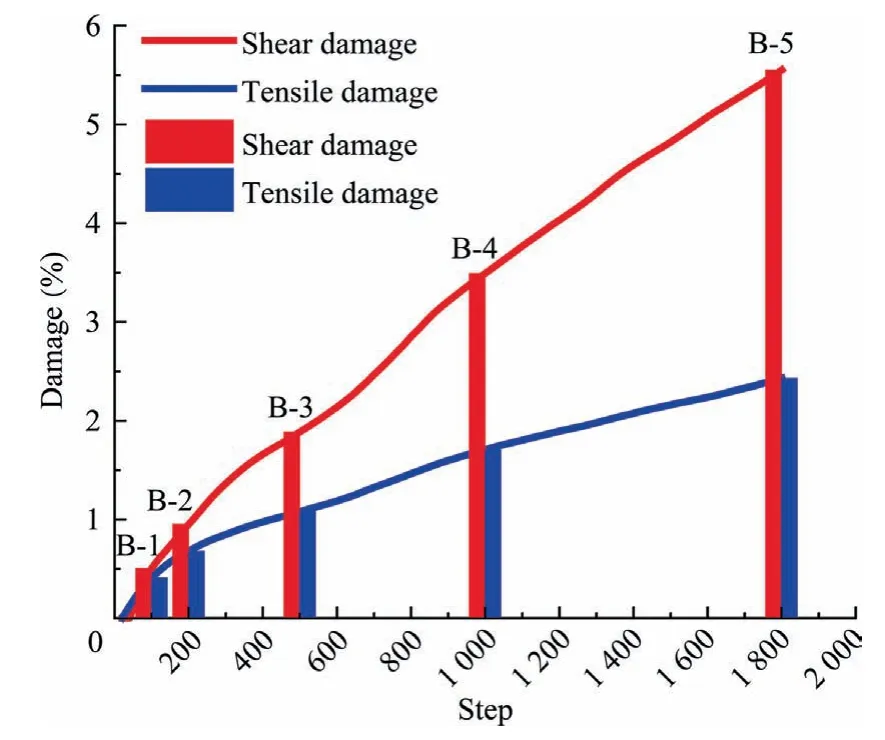
Fig.19.Curves of shear and tensile failure after excavation.
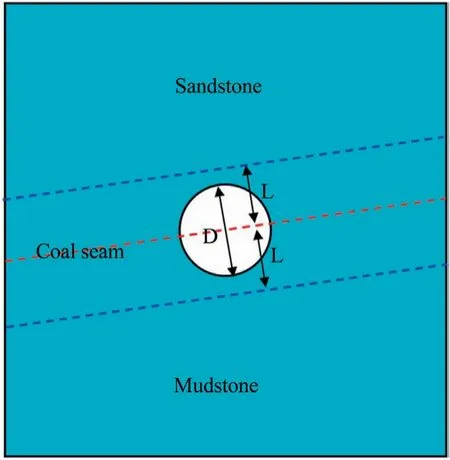
Fig.20.Position relationship between layered soft rocks and roadway.
Fig.21 shows the deformation of roadway under different coal seam thicknesses.At a ratio of 0.33,the thickness of layered soft rocks was much smaller than the diameter of the roadway,and the roadway passed through the sandstone,coal seam,and mudstone.Large deformation occurred in the ribs,especially in the position of the coal seam,and the maximum displacement of the right rib was 41 mm.The floor also bent,with a displacement of 27 mm.At a ratio of 0.87,the roadway passed through a small part of sandstone,the whole coal seam,and a small part of mudstone.The roadway seriously failed with rib shrinkage and floor heave.Moreover,the roadway presented characteristics of elliptical deformation,as shown in Fig.21b.When the ratio reached 1.33,the roadway was completely in the coal seam.At this time,the left rib reached the maximum displacement compared with the other five schemes.The displacement of floor,roof,and right rib continued to increase when the ratio reached 1.67,as shown in Figs.21d and 22.When the ratio reached 2.47,the deformation of the floor and roof increased obviously,while the deformation of ribs decreased slightly.As shown in Fig.22,the displacement of the roof,floor,left rib,and right rib was 49,38,37,and 43 mm,respectively.The maximum deformation occurred in the roof.Similarly,when the ratio was 7.53,the deformation of the roof and floor continued to increase,while the change of deformation in the ribs was not obvious.The displacement of the roof,floor,left rib,and right rib was 51,43,38,and 44 mm,respectively.The maximum deformation still occurred in the roof.
It can be obtained from the analysis above that when the roadway passed through three types of strata,the deformation of the ribs was obviously larger than that of the roof and floor.When the roadway was completely in the coal seam,the deformation of the roof and floor increased obviously with the increased ratio,while the change of deformation was not obvious in the ribs.
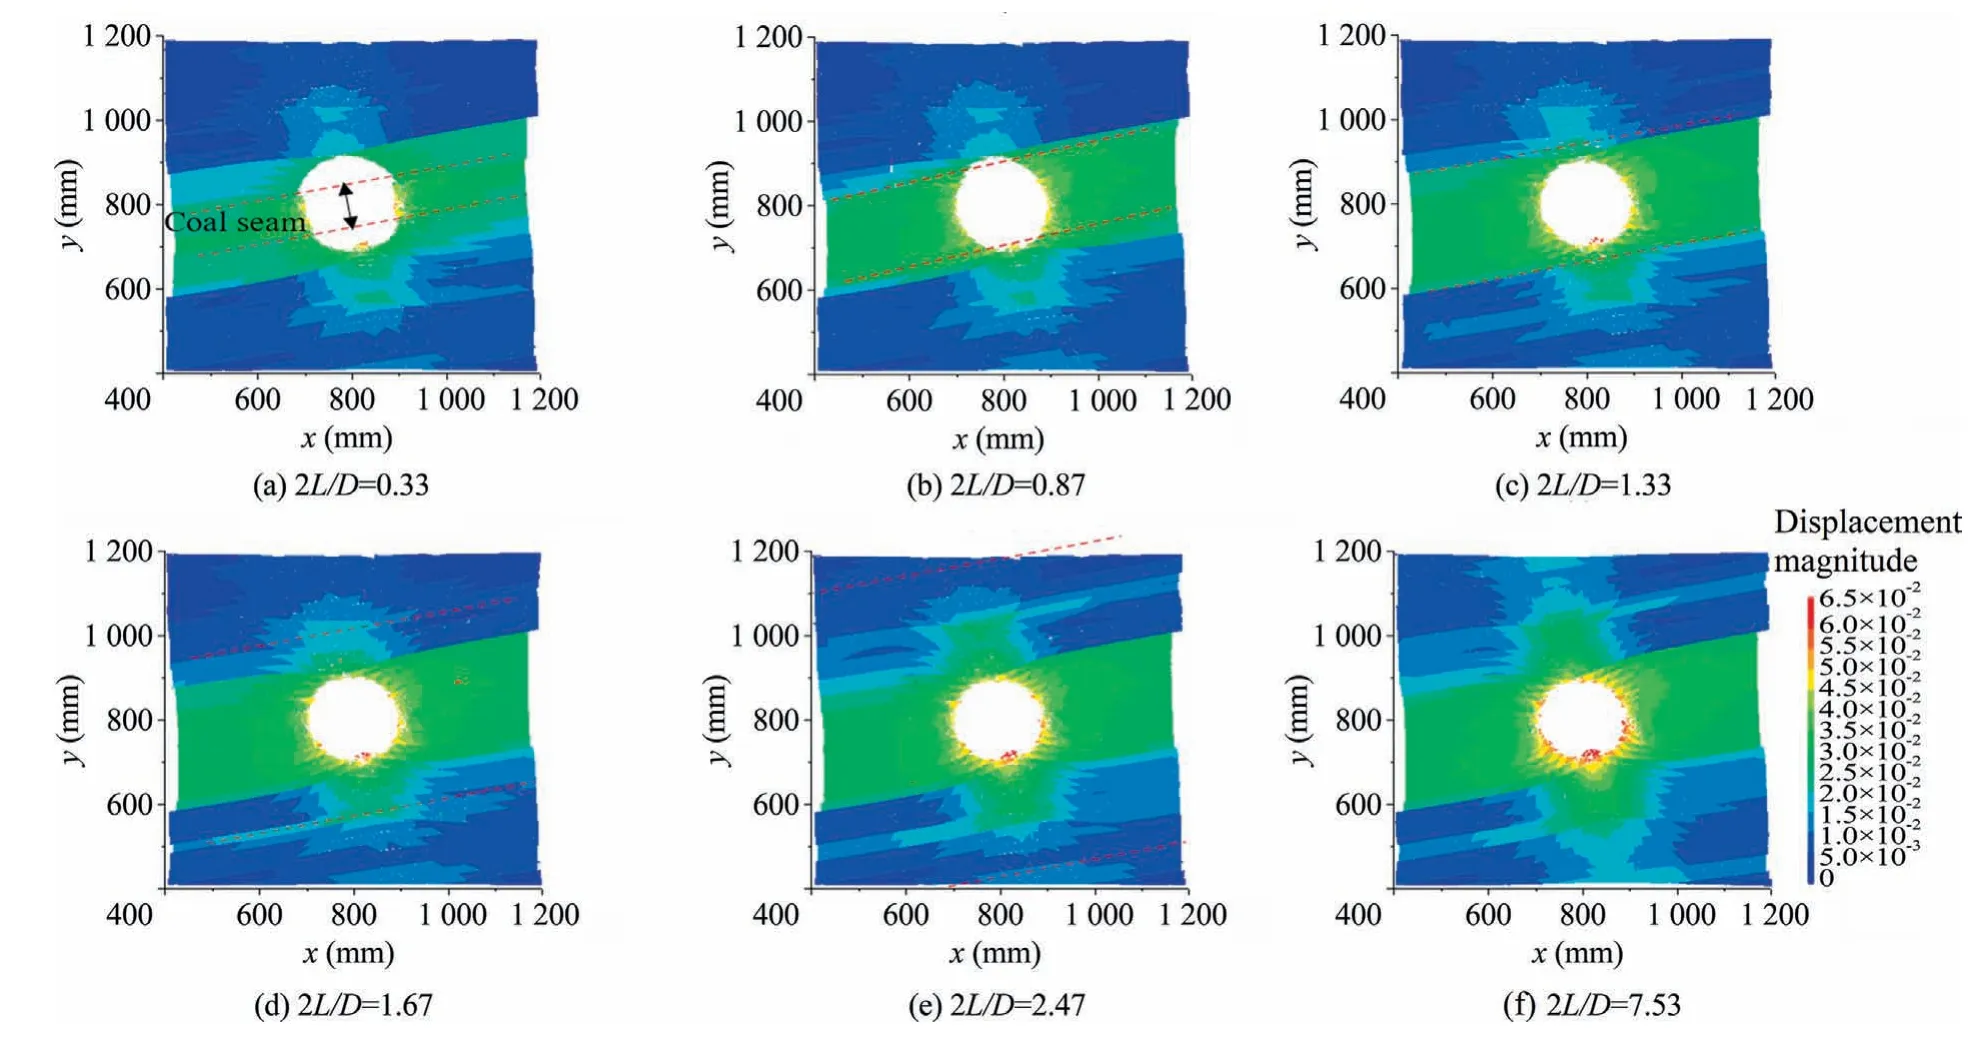
Fig.21.Displacement of roadway under different ratios.
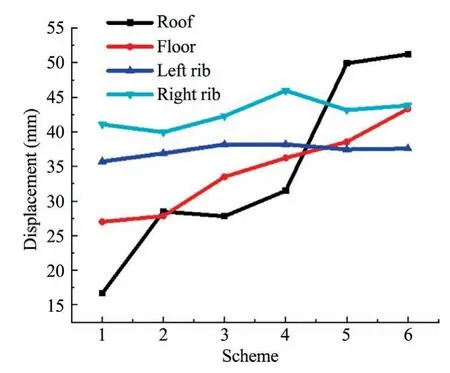
Fig.22.Displacement curves of roadway under different ratios.
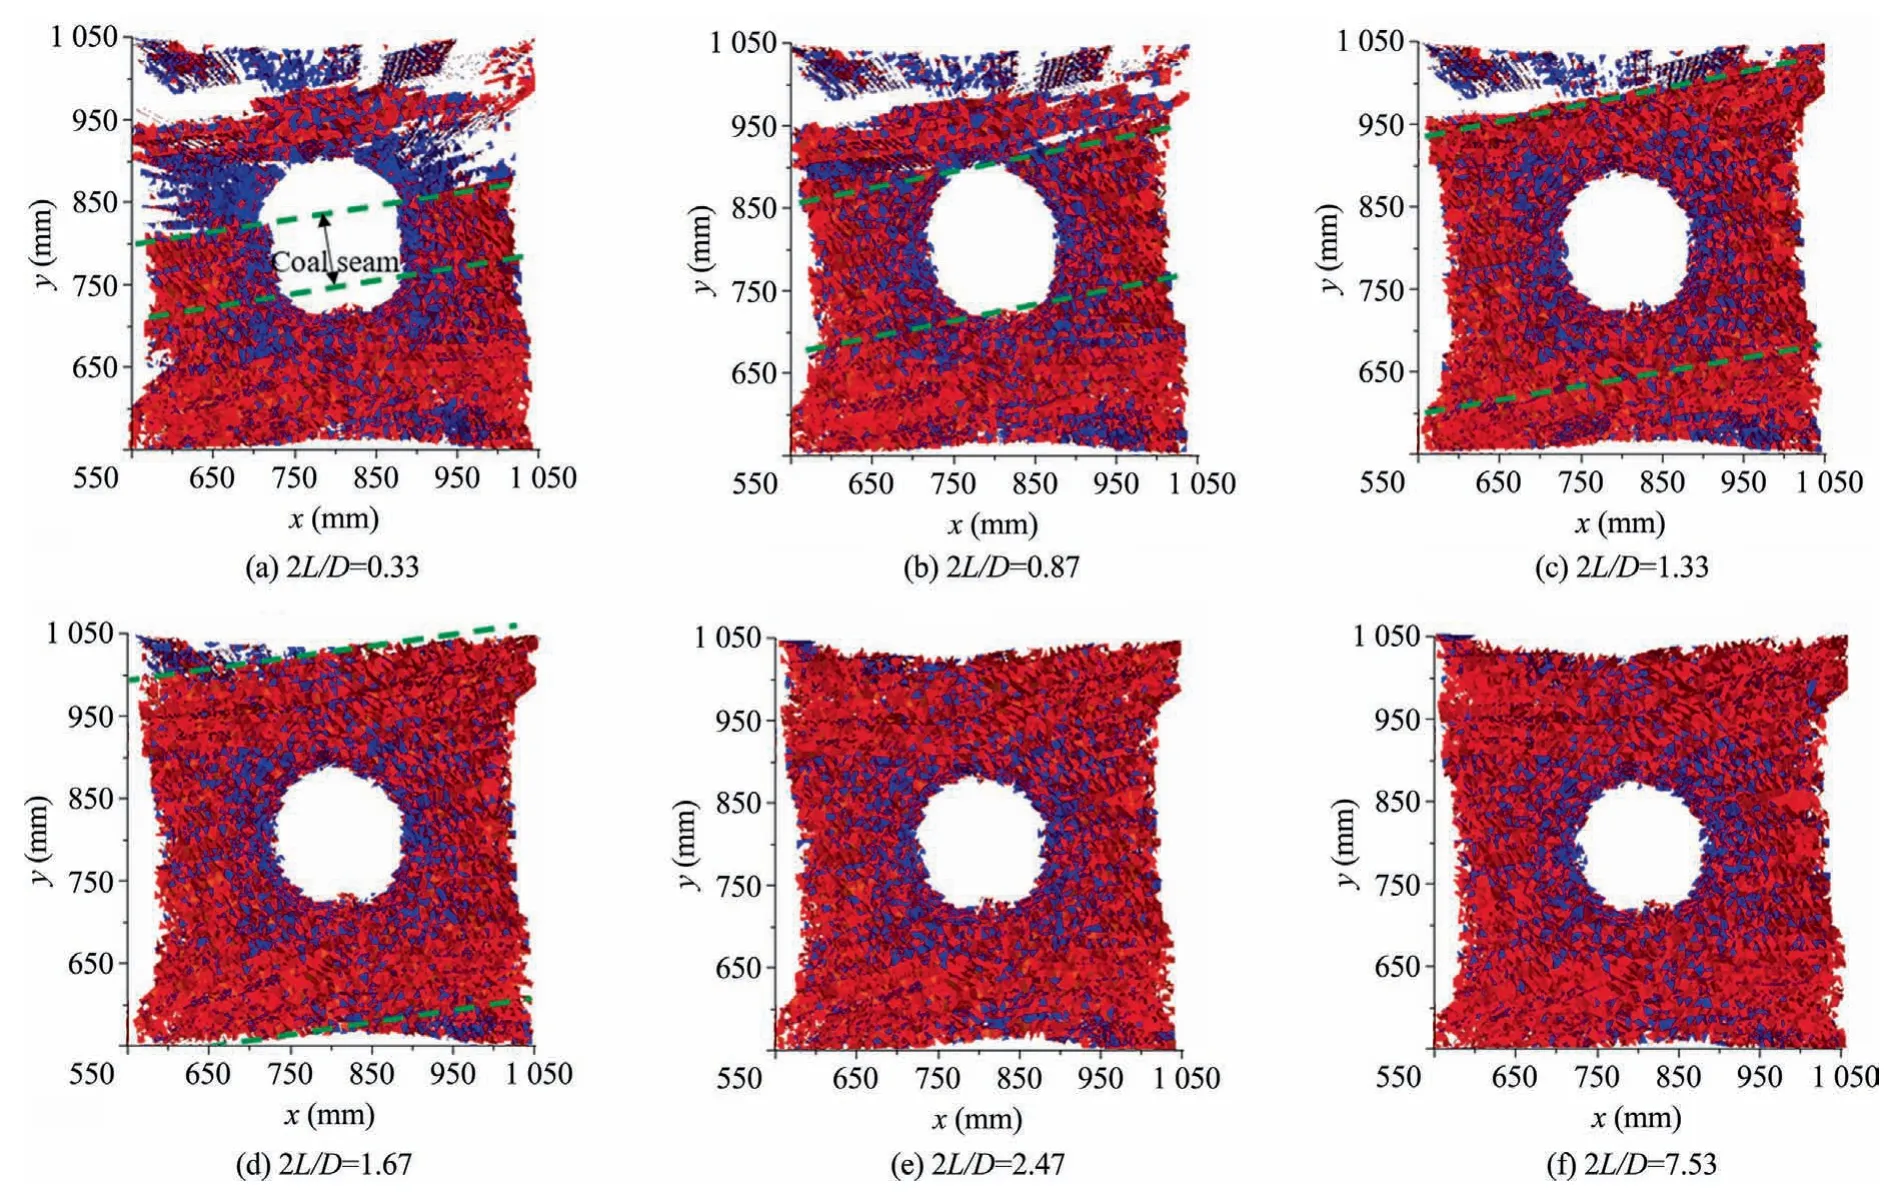
Fig.23.Crack development of roadway under different ratios.
Fig.23 shows the crack development under different ratios.At a ratio of 0.33,the cracks mainly occurred in the coal seam and mudstone,which was associated with part of the concentrated crack areas in the sandstone.It should be noted that a large number of tensile cracks were distributed in the ribs of sandstone (Fig.23a).At a ratio of 0.87,the roadway passed through the whole seam and a small part of mudstone and sandstone.At this ratio,the coal seam and mudstone were filled with cracks and a small part of the concentrated crack area was distributed in the sandstone(Fig.23b).The cracks continued to increase when the roadway was completely in the coal seam.Similarly,cracks mainly occurred in the coal seam and mudstone,while little cracks occurred in the sandstone due to its greater strength and long distance from the roadway (Fig.23c and d).
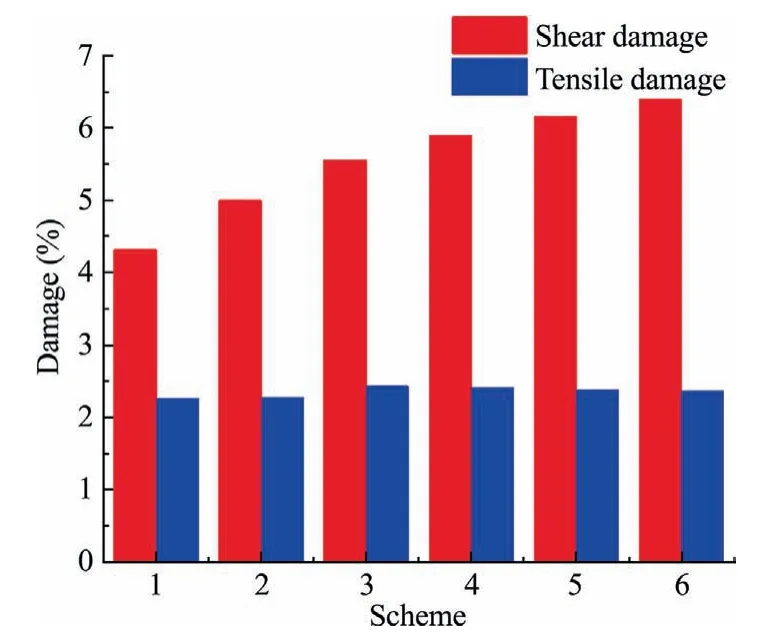
Fig.24.Damage under different ratios.
As the ratio continued to increase,the sandstone and mudstone were far from the roadway and the cracks increased obviously(Fig.23e and f).In the six schemes,shear damage increased gradually with the increased ratio,while the change of tensile damage was not obvious.The shear damage was more than the tensile damage and both shear and tensile cracks resulted in the roadway failure,as shown in Fig.24.
6.Conclusions
In this study,based on the background of the Xin’an coal mine,a physical model test with the PFESA approach and a 3DEC model with tetrahedral blocks were conducted to investigate the failure mechanism of roadway in layered soft rocks.The characteristics of the failure process were captured in physical model test and numerical simulation during the layered soft roadway failure.The results showed two failure patterns,layer bending fracture and layer slipping after excavation.The layer bending fracture occurred at positions where the normal direction of layers pointed to the inside of the roadway and the layer slipping occurred in the ribs.The failure mechanism was seriously influenced by the thickness of layered soft rocks.Six schemes with different ratios of layered soft rock thickness to roadway diameter were used to investigate the effect of layered soft rocks.The main conclusions can be summarized as follows.
(1) During the failure of layered soft rocks roadway,the roof and floor suffered from serious bending fracture,which was also observed from the temperature change.The deformation of ribs was larger than that of roof and floor due to the slipping.The maximum displacement of roof,floor,left rib,and right rib was 31,34,38,and 42 mm,respectively.The whole roadway suffered from asymmetric large deformation with floor heave,roof separation,and rib shrinkage.
(2) In the numerical simulation,the characteristics of deformation,stress,and cracks were consistent with the physical model test.The maximum displacement was 42 mm in the right rib and the minimum displacement was 28 mm in the roof.When the magnitude of concentrated stress increased to 2.4 times the vertical stress,the roof and floor began to bend fracture.There was obvious compressive stress in the ribs,indicating that the ribs suffered from serious shear failure.The failure mainly occurred in the coal seam and mudstone,with a small part of the failure in the sandstone due to its greater strength.The shear failure with the shear damage of 5.76% was higher than the tensile failure with the tensile damage of 2.62%.
(3) The thickness of layered soft rocks had a great effect on the failure mechanisms of the roadway.When the ratio was 0.33,the roadway passed through the sandstone,coal seam,and mudstone.The maximum displacement was 41 mm in the right ribs,while the minimum displacement was 16 mm in roof.When the ratio was 2.47,the roadway was completely in the coal seam.The maximum displacement was 49 mm in the roof,while the minimum displacement was 38 mm in the floor.When the ratio reached 7.53,the deformation of the roof and floor continued to increase.The maximum displacement was 51 mm in the roof,while the minimum displacement was 38 mm in the left rib.The change of deformation in the ribs was not obvious.In the six schemes,Shear damage ranged from 4.31%to 6.38%with the increased ratio,while the change of tensile failure was not obvious.
Acknowledgements
This work was supported by the National Key Research and Development Plan of China (No.2016YFC0600901),the National Natural Science Foundation of China(No.51874311),and the Natural Science Foundation of China (No.51904306).
杂志排行
矿业科学技术学报的其它文章
- Evaluation of the use of sublevel open stoping in the mining of moderately dipping medium-thick orebodies
- Stability control of gob-side entry retained under the gob with close distance coal seams
- A novel coating technology for fast sealing of air leakage in underground coal mines
- A robust approach to identify roof bolts in 3D point cloud data captured from a mobile laser scanner
- Deformation response of roof in solid backfilling coal mining based on viscoelastic properties of waste gangue
- Blast-induced ground vibration prediction in granite quarries:Anapplication of gene expression programming,ANFIS,and sine cosine algorithm optimized ANN
