Blast-induced ground vibration prediction in granite quarries:Anapplication of gene expression programming,ANFIS,and sine cosine algorithm optimized ANN
2021-04-08AbiodunIsmailLawalSangkiKwonOlaideSakiruHammedMusaAdebayoIdris
Abiodun Ismail Lawal,Sangki Kwon,Olaide Sakiru Hammed,Musa Adebayo Idris
a Department of Energy Resources Engineering,Inha University,Incheon 22212,Republic of Korea
b Department of Mining Engineering,Federal University of Technology,Akure,Nigeria
c Department of Physics,Federal University,Oye-Ekiti,Nigeria
d Division of Mining and Geotechnical Engineering,Department of Civil,Environmental and Natural Resources Engineering,Luleå University of Technology,97187 Luleå,Sweden
Keywords:Artificial intelligence Blasting Rock density Comminution Environmental impacts Sensitivity analysis
ABSTRACT Blasting of rocks has intrinsic environmental impacts such as ground vibration,which can interfere with the safety of lives and property.Hence,accurate prediction of the environmental impacts of blasting is imperative as the empirical models are not accurate as evident in the literature.Therefore,there is need to consider some robust predictive models for accurate prediction results.Gene expression programming(GEP),adaptive neuro-fuzzy inference system(ANFIS),and sine cosine algorithm optimized artificial neural network (SCA-ANN) models are proposed for predicting the blast-initiated ground vibration in five granite quarries.The input parameters into the models are the distance from the point of blasting to the point of measurement (D),the weight of charge per delay (W),rock density (ρ),and the Schmidt rebound hardness (SRH) value while peak particle velocity (PPV) is the targeted output.100 datasets were used in developing the proposed models.The performance of the proposed models was examined using the coefficient of determination (R2) and error analysis.The R2 values obtained for the GEP,ANFIS,and SCA-ANN models are 0.989,0.997,and 0.999,respectively,while their errors are close to zero.The proposed models are compared with an empirical model and are found to outperform the empirical model.
1.Introduction
Blast-initiated ground vibration is one of the environmental impacts of blasting.This is because blast-induced ground vibration can affect the structural integrity of the far and near structures and can lead to court cases.The complaint from the owners of the nearby structures could lead to the government closure or suspension of the operations in the quarries thereby leading to the job loss and stoppage of the cash inflow into the investor’s account.Owing to the adverse effects of the blast-induced ground vibration,researchers[1-6]have used various methods to quantify the magnitude of the blast-initiated ground vibration using the peak particle velocity(PPV)as the indicator.The field measurement with the aid of seismograph remains the most accurate means of measuring the blast-induced ground vibration nevertheless;the method is costly,time-consuming,and requires some level of expertise to calibrate and use the equipment correctly.Hence,the empirical method proposed by United States Bureau of Mining (USBM)remains the commonly adopted method for estimating the blastinduced ground vibration.However,this method has been adjudged inaccurate and also neglects the rock properties as evident in the literature [6-8].
The artificial intelligence (AI) technique,which is a science of mimicking the animate behaviour in recent decades has significantly improved the accuracy of PPV predictions as observed in the comparison of the AI methods with the empirical methods in the literature.Khandelwal and Singh[6]used artificial neural network(ANN)to predicted PPV and frequency in an opencast mine in India.The output of their model was compared with the regression analysis and the empirical models.The ANN model was found to give the most realistic prediction of the PPV.Nguyen et al.[8]predicted the PPV in an open-pit coal mine using 68 observed blasting events.Their proposed PPV was also compared with the predictions of five empirical models and ANN was found to be more accurate.Abbaszadeh Shahri and Asheghi[9],Lawal and Idris[10],and Saadat et al.[11]among others have also used the ANN approach to predict blast-induced ground vibration.
Adaptive neuro-fuzzy inference system (ANFIS) has also been employed to predict the blast-initiated ground vibration by some researchers.Iphar et al.[12]predicted the blast-initiated ground vibration in a surface mine using ANFIS.The model was built using 44 blasting cases comprising the distance from the blasting location to the equipment location and the weights of charge per delay as the input parameters while the PPV was the targeted output.The prediction of their model was also compared with the regression model prediction and the ANFIS performed better than the regression model.Jahed Armaghani et al.[13,14]predicted the blast-induced ground vibration using ANFIS.Their proposed ANFIS model was compared with the ANN model prediction in both cases and with the empirical model in Jahed Armaghani et al.[14].The outcome of their comparison showed that ANFIS models outperformed the ANN and empirical models in both cases.Other AI methods that have been used to predict the blast-induced ground vibration are PSO (particle swarm optimization),SVM/SVR (support vector machine/support vector regression),ICA (imperial competitive algorithm)-ANN,ANN-PSO,FFA (fireflies algorithm)-ANN,FFA-SVR,GA (genetic algorithm)-SVR,ANFIS-PSO,ANFISGA,ANN-KNN (k-nearest neighbours),IM (itemset mining)-ANN,BSVR (bagged SVR)-FFA,FS (fuzzy system)-ICA etc.[15-25]but SCA-ANN has never been used for the PPV prediction to the best of the knowledge of the authors.In addition,the gene expression programming (GEP)model has not been widely used in predicting the PPV and has an advantage over the PSO model because it does not require prior expression of the model in the form of mathematical equation.
As evident from the previous paragraphs,an ocean of researches has been conducted on the prediction of blast-induced ground vibration using AI techniques.The performances of the AI methods that have been used are far better than those of empirical and regression models.However,in practice,the empirical models still attract attention.This is because the empirical model is simple to implement unlike the majority of the AI models which are not practically implementable.This is because AI models discussed above apart from the PSO [26]and GEP [27]models,are not in the form of a usable mathematical form or simple graphic user interface form hence they are only good for theoretical purpose as the intending users are required to have the sound knowledge of AI to perform the AI simulation.Based on the no free lunch(NFL) theorem of Wolpert and Macready [28]also,the PSO model cannot be a general algorithm for solving all the PPV problem[29].It is therefore imperative to direct the research efforts toward the possibility of the practical implementation of the AI methods and explore more hybrid forms of AI.This is hitherto demonstrated in this study with the proposed GEP,ANFIS,and SCA-ANN models.
GEP,ANFIS,and SCA-ANN models are proposed in this study for predicting the blast-initiated ground vibrations in granite quarries in Ogun State,Nigeria.The choice of these three approaches was born out of the desire to propose more accurate and implementable models for the blast-induced ground vibration prediction.Hence,the novelty in the proposed study includes the use of the GEP,ANFIS,and SCA-ANN models for the PPV predictions in the selected granite quarries in addition to the simplification and transformation of the ANFIS model into a graphic user interface form in the Microsoft Excel file using the visual basic programming.Previous works have shown that no existing study to predict the PPV has practically demonstrated the ANFIS in the form presented in this study.Therefore,the novelty of the proposed models will be of practical interest and prevent the dependence on the inaccurate empirical and regression models for the blast-induced ground vibration predictions.
1.1.Description of the study area
The five locations are in Ogun State,south-western Nigeria.Ogun State shares boundary with the Benin Republic in the West and three states,Lagos,Oyo,and Ondo States in the South,North,and East,respectively.Three of the locations,Equation,Verytaces,and Phoenix quarries lie between latitude 7°0′0′′N and 7°15′0′′N and longitude 3°30′0′′E and 3°45′0′′E while the Associated and United quarries lie between latitude 7°0′0′′N and 7°15′0′′N and longitude 3°15′0′′E and 3°30′0′′E.Only the Phoenix quarry is located in the Odeda region of the state while the remaining quarries are within the Obafemi-Owode area of the state as shown in Fig.1.
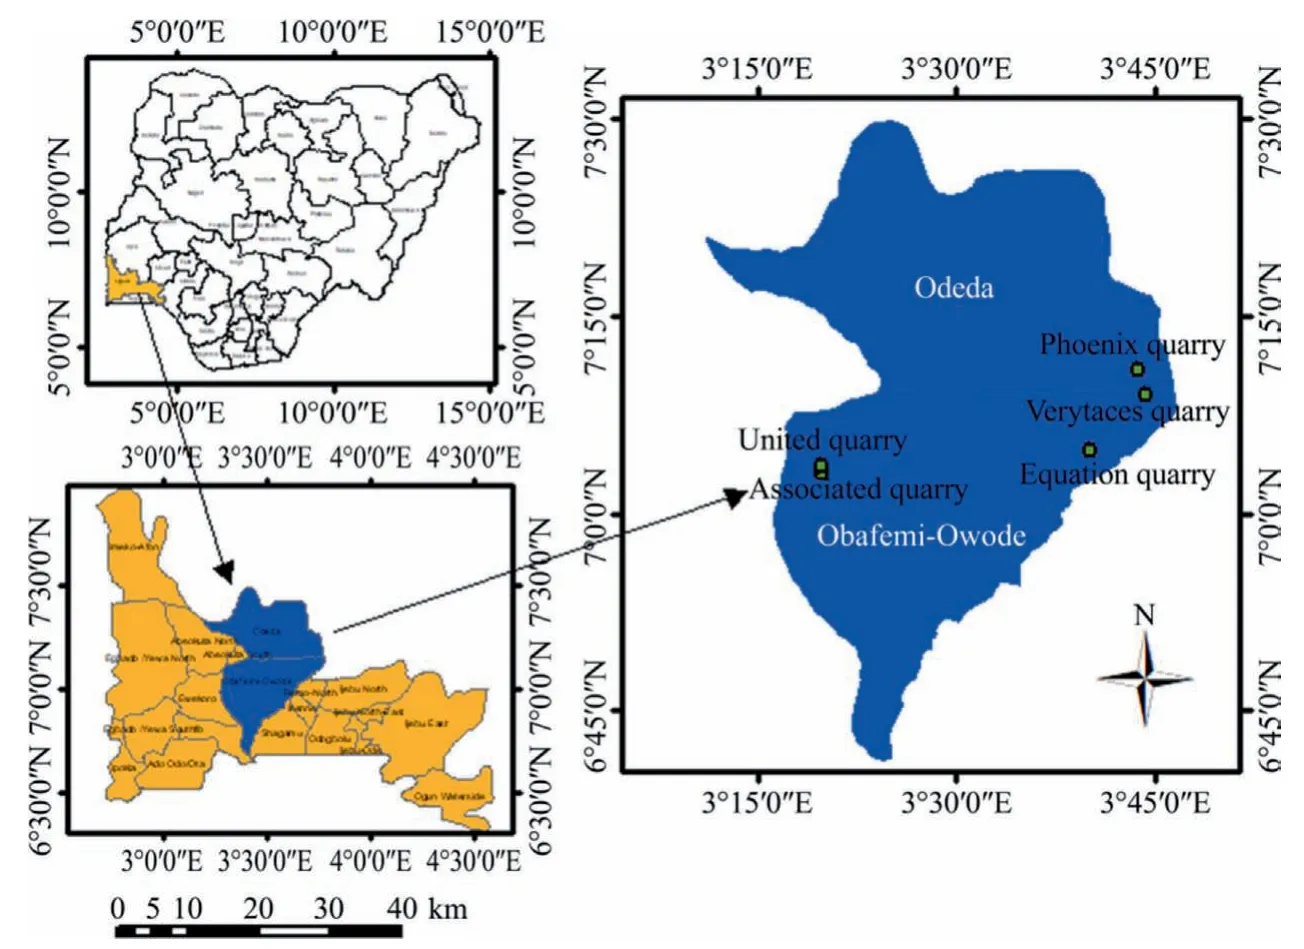
Fig.1.Location map of the five quarries.
Geologically,about three-quarters of the surface area of Ogun State is embedded with the sedimentary rocks while the remaining part of the surface area is embedded with the basement complex rocks [30].The sedimentary rocks span from the northwest to the southeast.The Ogun State basement complex consists of migmatite-gneiss complex,the schist belt,and the older granites which are averagely 650 million years in age[31].These basement complex rocks outcrop massively in the locations of the quarries considered in this study.
1.2.Data collection
The quarries are into the production of granite aggregates for various construction purposes such as road and building constructions.The blasting operations are carried out in the quarries using ammonium nitrate fuel oil (ANFO) as the major explosive coupled with the Magnadet detonator.The blast-induced ground vibrations for 20 blasting cases were measured in each quarry using the V9000 Seismograph situated at the station point and the distance from the blasting point to the instrument location was measured using GPS.The blast-induced ground vibration datasets used have been previously reported by Hammed et al.[32].
Asides the measured blast-initiated ground vibration,the weights of charge per delay,and the measuring distance,the laboratory tests were conducted on the intact rock samples for the determination of rock density and Schmidt rebound hardness(SRH) values for each of the locations.In determining the density of the rock,the saturation and buoyancy method for the irregular rock samples was used,while the SRH value was determined using type N Schmidt hammer to perform the test on lump samples.The test procedures are as recommended by ISRM [33]and conformed to the ASTM [34]procedures.The main reason behind these two properties is to keep the proposed model practically simple to implement while the uncontrollable parameters are also represented.Therefore,in the proposed GEP,ANFIS,and SCA-ANN models,four input parameters comprising the measuring distance,the weights of charge per delay,density of rock,and SRH values were used while the single targeted variable was the PPV.
The summary of the statistics of the adopted datasets is presented in Table 1.From Table 1,the standard deviation of the rock density is close to zero.This could be because the quartz content of the granite largely dictates the property of the rock hence there are usually no wide variations in the values of the density of the same or similar rock types.Similarly,the standard deviation of SRH is also small as compared to other model parameters.Hence,there is no wide variation in the properties of the rocks in the selected quarries.
2.Model development
2.1.Gene expression programming (GEP)
2.1.1.Brief overview
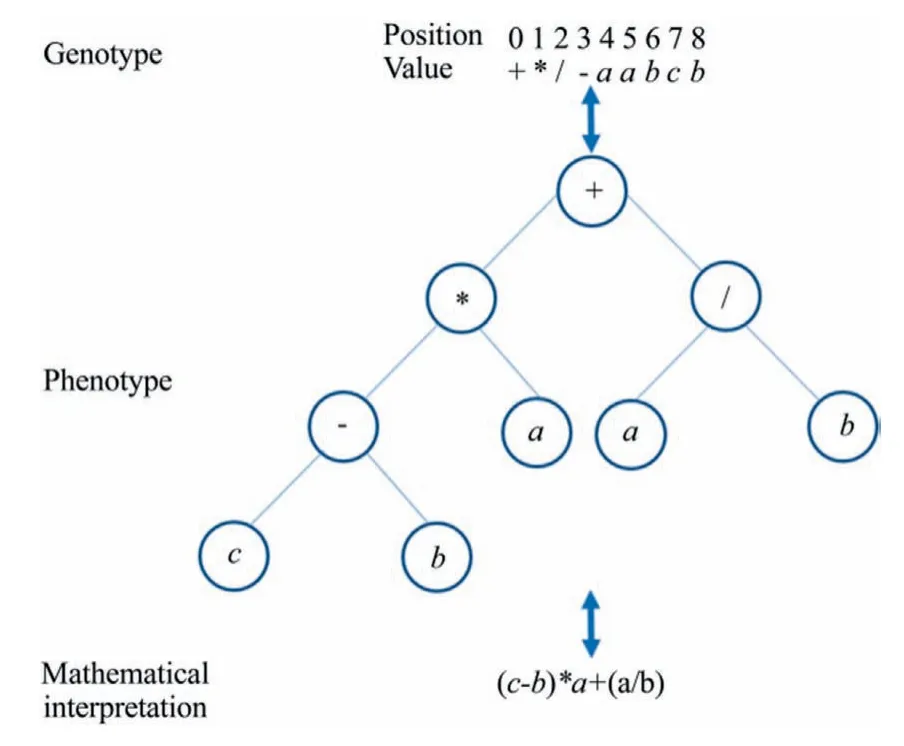
Fig.2.Gene transformation process.
Gene expression programming (GEP) is an evolutionary-based AI which explores the advantages of the genetic programming and genetic algorithm with a clear classification of the individual genotype and phenotype.GEP was proposed by Ferreira [35]and has since been used in various fields such as function finding,symbolic regression,rule mining,data classification,and time series forecasting [36].The GA,genetic programming (GP),and GEP are based on Darwinian natural selection principle with similar biological evolution criteria to evolve and encode a computer programming but exhibit some characteristics differences.For instance,in chromosome representation,GEP differentiates the genotype from the phenotype of the chromosomes[37],which is one of the inherent limitations of GA and GP [38,39].In GEP,the linear strings called chromosomes are used to represent individuals.The genes are present in chromosomes which are linked together by link operators which can be in form of arithmetic symbols (+,-,*,/)or trigonometric functions (sine,cosine,tangent).The GEP genes can be classified into two viz.genotype and phenotype.The code of the genes is the genotype which is analogous to that of GA while the phenotype is the decoding of the genes as typically shown in Fig.2.The easy of the transformation of the genotype to the phenotype of the chromosome is one of the key advantages of the GEP together with the easy and compact chromosome representation.The implementation of the operators is also simple and therefore,the GEP can handle the complex problem [36].
The GEP gene also contains head and tail.The head contains two symbols which are functional symbols and exit symbols;however,the tail only has exit symbols.Also,the head length lhis userdefined based on the problem under consideration while the tail length ltis lhand n dependent.Where n denotes the number of arguments in relation to the function that possesses the most arguments.The tail length ltmust satisfy Eq.(1).

Another operator of interest in the GEP,is the genetic operators including mutation,inversion,function insertion,permutation,and recombination among others.The genetic operators must satisfy the length of head and tail conditions.The fitness function is also imperative in GEP.This is because the fitness functions may have a direct influence on the convergence speed and the solution quality.Many fitness functions can be specified while performing the GEP such as root-mean-squared error(RMSE),mean-squared error(MSE),mean absolute error,a trend with punishment,R-square,bounded R-square,and relative absolute error.Further explanations on the GEP can be found in Ferreira [35,40]and Guo et al.[36].

Table 1 Summary of the statistics of the model parameters.
2.1.2.GEP model for the prediction of PPV
The described GEP was developed in this study for the prediction of PPV using GeneXpro©tools 5.0 software.100 datasets comprising the D,W,ρ,and SRH were loaded into the software,which was automatically cleft into the training and testing or validation datasets.The datasets were normalized within the range of 0 and 1 before loading to the software using Eq.(2) to eliminate dimensional dissimilarity between the model parameters.

where Xnormis the normalized value of the datasets;X the datasets to be normalized;and Xminand Xmaxthe minimum and maximum values of X,respectively.
Upon loading the datasets,the number of chromosomes was defined to be 30 while the head size was taken to be 8 and the number of genes was defined to be 4 while the linking function was multiplication.After the general settings,the fitness function was selected which is the RMSE.The strategy of the genetic operators is the optimal evolution while the default settings of the genetic operators such as mutation,inversion,fixed-root mutation,function insertion among others were used.Afterward,the simulation was ran and the stopping criterion was the max fitness function.At the end of the simulation,the average fitness,best fitness,and best R-square obtained are as plotted in Fig.3.
Furthermore,the outcome of the simulation is displayed by plotting the normalized targeted values and model or experimental values as presented in Figs.4 and 5,respectively.Figs.4 and 5 show that the presented GEP model gives a similar prediction to the measured values for both the training (Fig.4) and testing/validation(Fig.5).The errors associated with the normalized training and testing datasets are also displayed in Figs.4 and 5.The mean error,RMSE,and standard deviation for the training are -0.0021,0.0255,and 0.0256 while for the testing,they are -0.008,0.027,and 0.026,respectively.The errors associated with the training and testing together with their respective standard deviations are close to zero,indicating that the model can suitably predict the PPV.
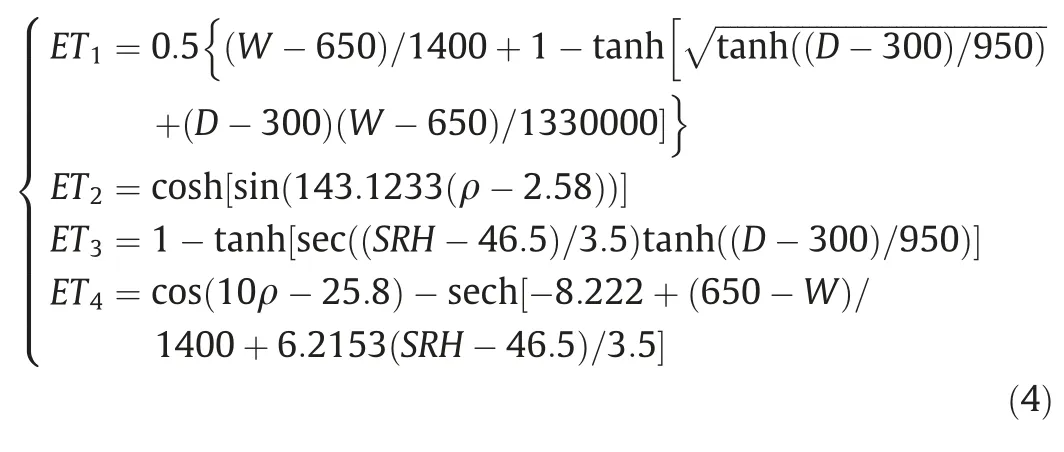
Finally,the developed model in terms of the expression tree(ET)language is as presented in Fig.6.In the model,there are four sub-ETs as shown in Fig.6.The d0 to d3 in Fig.6 represent the D,W,ρ,and SRH value,respectively.The c0,c5,and c9 are constants,which are presented in Table 2.The mathematical transformation of the phenotype is presented in Eq.(3).

where m is the number of the ETs;and ETithe i-th ET value as presented in Eq.(4).
2.2.Adaptive neuro-fuzzy inference system (ANFIS)
2.2.1.Brief explanation

Fig.3.Fitness and R-square value at the end of model simulation.
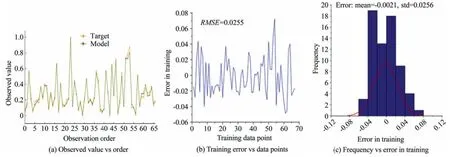
Fig.4.Performance of the training datasets of GEP model.
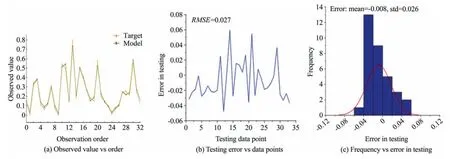
Fig.5.Performance of the testing datasets of GEP model.
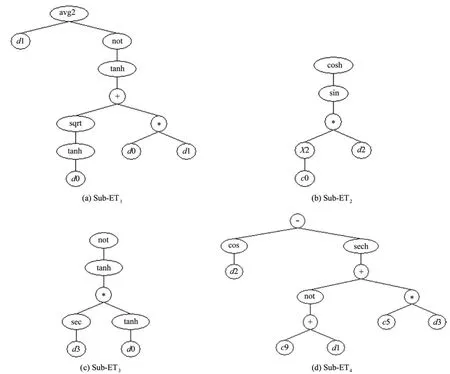
Fig.6.ETs of the GEP model.
Adaptive neuro-fuzzy inference system (ANFIS) combined the merits of both ANN and fuzzy logic which offers the merit of allowing the expression of the final system into if-then rules and the presentation of the fuzzy system in the form of the neural network architecture with the distributed knowledge over the connection firing strengths [41,42].ANFIS has been employed in solving various problems in the field of engineering including mining and geotechnical engineering [43-48].It has also been used to predict the PPV by Iphar et al.[12]and Jahed Armaghani et al.[13,14].However,the presented ANFIS in this study offers a unique advantage over the previous applications of ANFIS in that ANFIS has been presented with practical application examples and a simple graphic user interface.The procedures involved in the ANFIS models can be explained using the structure for the two inputs and two membership functions as presented in Fig.7.
The ANFIS architecture has five layers[41]and what takes place in each layer is explained in what follows.

Table 2 Values of the constants in the ET.
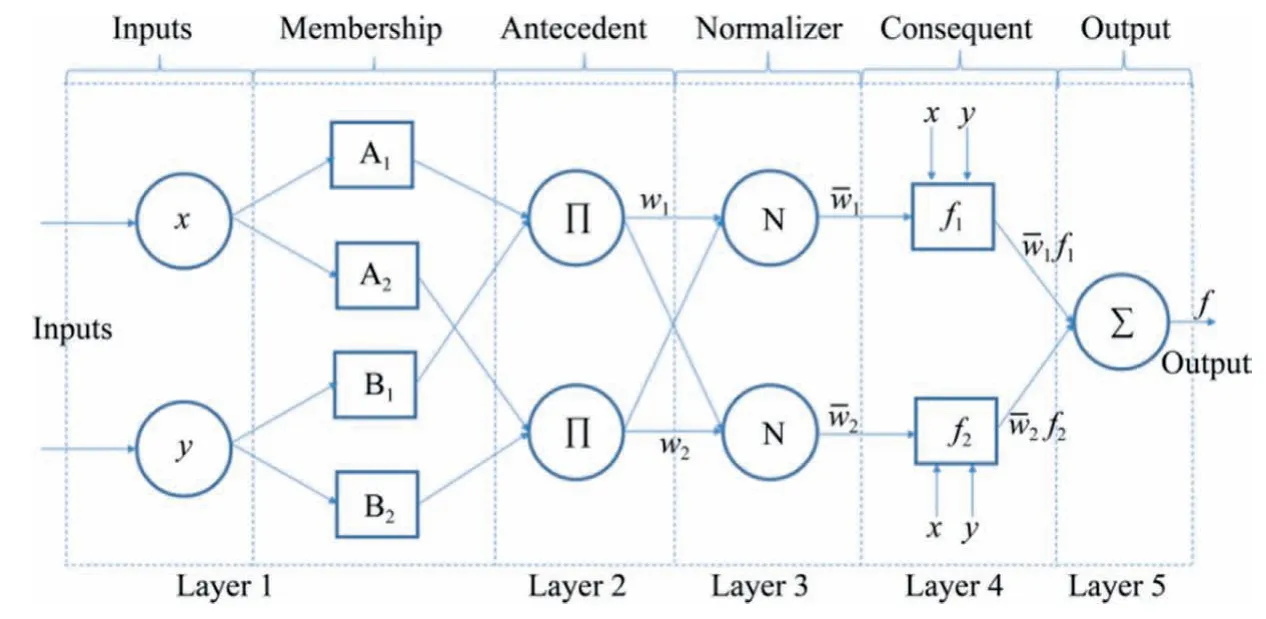
Fig.7.A typical two input parameters ANFIS structure.
In the layer 1 which is also known as the fuzzification layer,the membership grades of all the input variables are obtained in this layer.For a typical example depicted in Fig.7,the input and output of the layer 1 for a typical linguistic variable are presented in Eq.(5).

where O1,iand O1,jare the i-th and j-th nodes output of the layer 1;and μA,iand μB,jthe membership function which could be triangular,trapezoidal,bell,and Gaussian,etc.The triangular membership function,for example,is as presented in Eq.(6).

where ai,bi,ciare the triangular membership function parameters for the linear output membership function type while for the constant output membership function type,the triangular membership function parameters will reduce to ciwhile aiand biwill be zero.The membership function parameters are also known as premise parameters.
In the layer 2 which is the multiplication layer,the output signal obtained from the layer 1 is multiplied based on the set rules to obtain the firing strength.The output of this layer can be as presented in Eq.(7).

In the layer 3,the normalization of the obtained firing strengths in the layer 2 takes place.Assuming we have two rules,the output of this layer will be as presented in Eq.(8).

In the layer 4,the firing rule strength obtained in layer 3 is multiplied with the first-order polynomial equation as presented in Eq.(9).

where fiis given as in Eq.(10) for the typical two input variables.

where p,q,and r are the consequent parameters.Depending on the number of input variables,the consequent parameters can be more than three.For instance in this study where there are four input parameters,Eq.(10) will be fi=pix+qiy+riz+siw+g,where p,q,r,s,and g are the consequent parameters.
Finally,the summation of outputs signal from the layer 4 gives the final prediction of the ANFIS model,which is typically presented in Eq.(11).

2.2.2.ANFIS model for the prediction of PPV
The ANFIS model as presented in Section 2.2.1 is implemented in this study for predicting the blast-initiated ground vibration.The ANFIS model is implemented in the MATLAB©code.100 datasets were used in the model development and the datasets were split into training and testing datasets.It is important to mention here that equal number of datasets used in training and testing/-validation in the case of the GEP model was also used in the ANFIS model.The input datasets were normalized within the range of 0 and 1 using Eq.(2).Three membership functions were defined in the form of the linguistic variables for each of the input parameters.The input membership function type adopted is the triangular membership function while the output membership function is linear.The ANFIS is then trained using the genfis command in the MATLAB©code.The maximum epoch was set to 100 while the initial step size,decrease rate,and increase rate of step size were respectively set to 0.01,0.90,and 1.10.The hybrid optimization method was used.81 rules in total were automatically generated during the training.The correlation between the target normalized PPV and output normalized PPV for the training datasets after the training and the error in the training datasets are as shown in Fig.8 while those of testing datasets are shown in Fig.9.It is important to state that the PPV predicted with the trained ANFIS is almost identical to the targeted PPV.The RMSE,the mean error,and the standard deviation of the error are very close to zero.For the normalized testing datasets however,the ANFIS model still shows encouraging performance as the predicted PPV is also close to the targeted PPV as shown in Figs.8 and 9.The RMSE,mean error,and the standard deviation of the testing datasets are 0.020315,-0.0063142,and 0.019608.
2.2.3.Sine cosine algorithm optimized ANN (SCA-ANN)
An ANN is a commonly used AI technique for the predictions of blast-initiated ground vibration as delineated in Section 1.However,the lower convergence speed and the possibility of falling into the local minimum of ANN lead to the use of a hybrid form of ANN[49].Amongst the hybrid ANN which has been used including ANN-PSO,ICA-ANN,ANN-KNN,BBO (biogeography-based optimization)-ANN,etc.[16,18,19,49].Based on the NFL theorem of Wolpert and Macready [28],there can be no general algorithm for solving optimization problems in a whole hence,researchers could propose new optimization algorithms or modify existing algorithms [29].Therefore,the SCA has been used in this study to optimize the ANN and to the best of the knowledge of the authors,no one has used this method to solve the blast-induced ground vibration problems.

Fig.8.Performance evaluation of the training datasets of ANFIS model.

Fig.9.Performance evaluation of the testing datasets of ANFIS model.
The SCA was first proposed by Mirjalili[29]for the 2D shape of an airfoil in the wings of aircraft.The SCA is based on the mathematical function that locates the optimum solution in the loop of the two curves.Like other population-based optimization algorithms,the SCA also comprises of two phases,which are exploration and exploitation phases.These two phases can simply be differentiated by the degree of randomness in each phase for locating the possible best solution.The random rate required in the development phase is lower than that in the exploration phase[29].The position updates can be expressed in Eq.(12) [29].

The pseudo-code for the implementation of the SCA as proposed by Mirjalili [29]is as presented below.
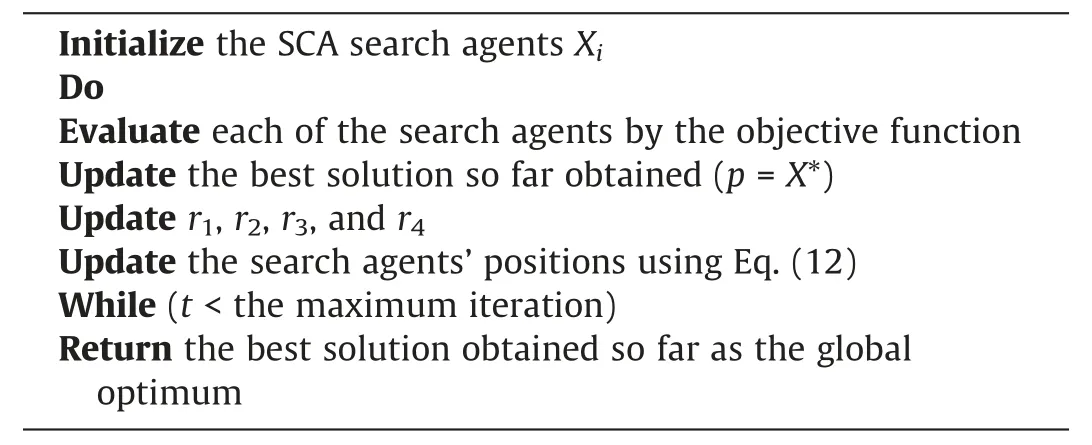
Since the SCA does not generate neural network architecture itself,the SCA is only used to optimize the weights and biases obtained from the ANN.The feedforward backpropagation neural network used was trained with Levenberg-Marquardt algorithm.The transfer functions in the two hidden layers are hyperbolic tangent while purelin was used in the output layer.Hence,to implement the SCA-ANN,the ANN network was first initiated followed by the application of the SCA based on the pseudo-code presented above for the weights and biases optimization.In doing this,the same number of datasets used for the GEP and ANFIS models were also used but in this case,the datasets were divided into three viz.training,testing,and validation.The search agents were set to 30 while the maximum iteration was set to 1000 for the SCA.The optimum SCA-ANN architecture (4-5-1-1) obtained after several trials and the overall performance of the SCA-ANN model as obtained from the MATLAB code is as presented in Fig.10.Fig.11 shows the convergence curves of the proposed models.Fig.11a shows that the training,testing,and validation curves follow the same pattern and hence the proposed model is suitable for the prediction of the PPV while Fig.11b presents the number of iterations in the optimization process by the SCA algorithm.It can be seen in Figs.12 and 13 that the RMSE for the training and testing datasets are 0.0051398 and 0.009389 while the mean error is 0.00011646 and-0.0018851 and standard deviations for the training and testing are 0.0051755 and 0.0095206,indicating the model can give a realistic prediction of the PPV with minimal error.
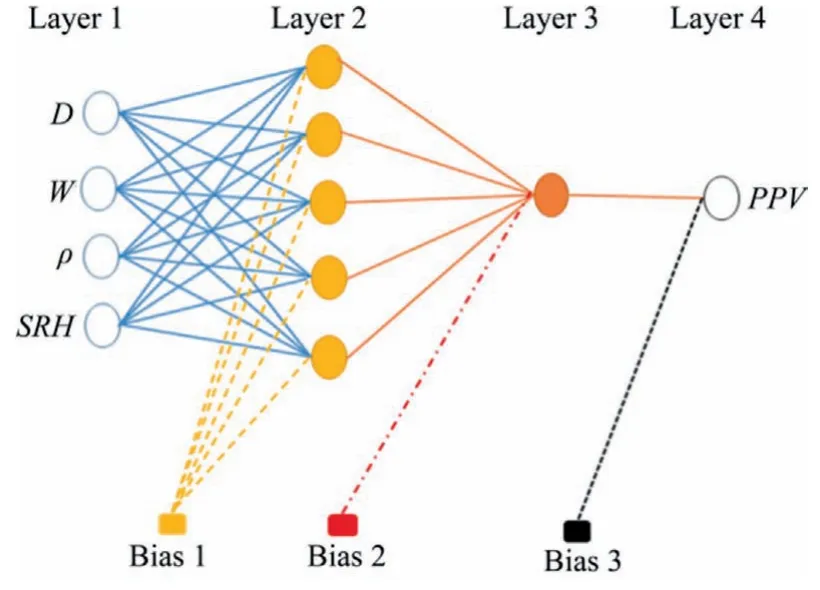
Fig.10.Optimum SCA-ANN architecture.
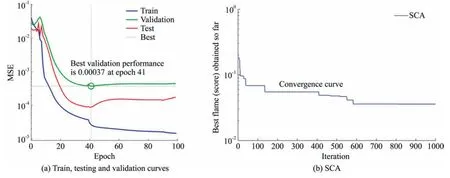
Fig.11.Convergence curves of the proposed SCA-ANN model.

Fig.12.Performance evaluation of the training datasets of SCA-ANN model.

Fig.13.Performance evaluation of the testing datasets of SCA-ANN model.
3.Results
3.1.Comparison of the proposed models with an empirical model
Several empirical models are available in the literature[1,2,50-52]for the prediction of the PPV in the absence of the field monitoring.However,the most commonly used among them is that of the USBM by Duvall and Fogelson [1].The USBM method[1]and the majority of the empirical models are developed using the scaled distance approach.The mathematical equation for the scaled distance is given in Eq.(13).The PPV empirical model proposed by Duvall and Fogelson [1]is therefore as presented in Eq.(14).

where SD is the scale distance while κ and β are the field constants which are computed using the measured datasets used in developing the proposed models in this study.The analysis to determine the field constants was carried out in the OriginPro©software using the non-linear curve fitting with the allometric function and Levenberg-Marquardt iteration algorithm.The respective obtained values for κ and β are 1520.89658 and -1.26218,respectively.Therefore,Eq.(14) becomes Eq.(15).The predictions of the proposed models and that of Eq.(15)were compared to establish which of the models is most suitable for the prediction of the PPV.The output of the comparison is presented in Fig.14.The coefficient of determination for the USBM model is 0.679,while that of GEP,ANFIS,and SCA-ANN are 0.989,0.997,and 0.9995,respectively.The SCA-ANN model has the highest value of the coefficient of determination follow by ANFIS and then GEP while USBM has the least R2value.Hence,using the empirical model when the field monitoring/measurement of the blast-induced ground vibration is not available or not achievable may lead to an unrealistic estimation of the ground vibration.Therefore,the proposed SCA-ANN,ANFIS,and GEP models could be a good means for the estimation of the PPV.

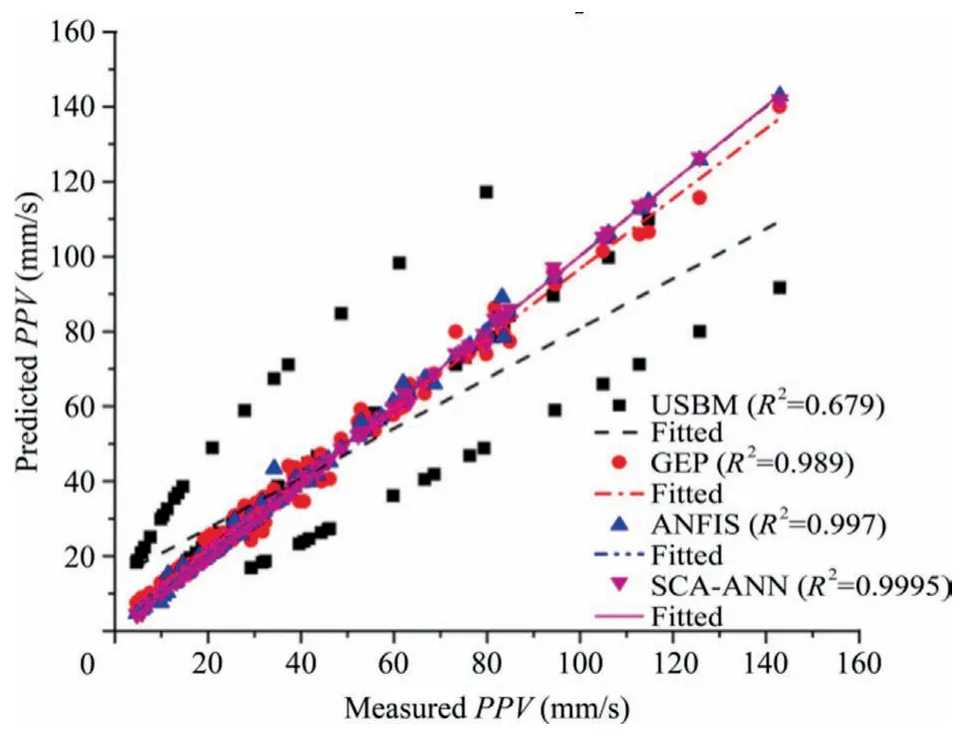
Fig.14.Comparison of the model predictions.
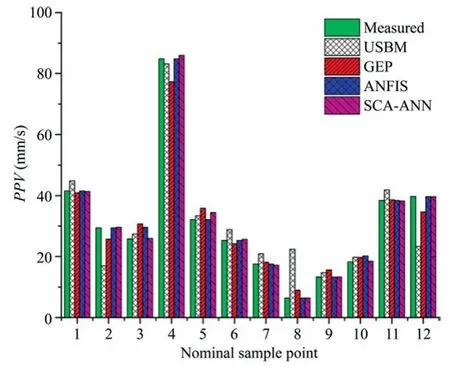
Fig.15.Model validation against the targeted values.
3.2.Validation of the model
The proposed models were validated using some randomly selected blasting datasets among the overall datasets used in developing the models.The outcome of the validation is presented in Fig.15.From Fig.15,the predicted PPVs using ANFIS are closer to the measured PPV at points 4,5,and 7 while the SCA-ANN are closer at points 3,6,and 10 while both ANFIS and SCA-ANN gave similar predictions at points 1,2,8,9,11,and 12.The ANFIS and SCAANN predictions are closer to the measured PPV at many points as compared with USBM and GEP models.The associated RMSE and standard deviation for the USBM model,GEP,ANFIS,and SCAANN models are 7.85 and 8.19,3.54 and 3.69,1.24 and 1.19,and 0.76 and 0.74,respectively.Hence,the ANFIS and SCA-ANN models are the best performing models as indicated in Fig.14 and the RMSEs and standard deviations,followed by the GEP model and then the USBM model.
3.3.Example of the practical application of the ANFIS model
The implementation of the presented ANFIS model in this study is practical demonstration.This is one of the novelties of the proposed study as none of the previously reported ANFIS based models for the predictions of blast-induced ground vibration included the practical demonstration in their models and that limits the applicability of their models.For a set of given input parameters D=400 m,W=1800 kg,ρ=2.6 g/cm3,and SRH=48.3,the membership function parameters and the consequent parameters are as presented in Tables 3 and 4,respectively.Following the steps presented in Eqs.(7)-(11),Table 5 is obtained which showed the predicted PPV.
However,it is obvious that Tables 4 and 5 look tedious and may not be easy to apply practically.Hence,the visual basic programming code implementable in the common Microsoft Excel files has been prepared in the form of the graphic user interface.For the given parameters in the example presented in the Table 5,the interface of the excel GUI is given as presented in Fig.16.It is obvious that the manual calculation presented in Tables 3-5 and the excel GUI presented in Fig.16 produced the same results.
3.4.Sensitivity analysis
Sensitivity analysis is a means of establishing the contribution of each of the model input parameters to the predicted output parameters.For this purpose,Yang and Zhang [53]proposed the cosine amplitude method for assessing how sensitive the predicted output is to the independent variables.The cosine amplitude method was adopted in this study as it has been adjudged suitable for the assessment of sensitivity analysis by Jong and Lee[54].The sensitivity analysis equation proposed by Yang and Zhang[53]is as presented in Eq.(16).

where Rijis the strength of each of the input parameter;Iithe input parameter;Oithe model output;and n the number of the data points.
The result of the sensitivity analysis conducted using Eq.(16)for the ANFIS model only as an example is presented in Fig.17.The I1,I2,I3,and I4on the horizontal axis represent the distance,charge weight per delay,density,and Schmidt rebound hardness,respectively.The order of the strengths of the predictors as presented in the Pareto chart (Fig.17) is I2>I3>I4>I1.The charge per delay and density have a slightly greater influence on the pre-dicted PPV.However,the Pareto chart cumulative percentage line is straight indicating that the contributions of each of the input parameters is just slightly different.

Table 3 Membership function parameters.
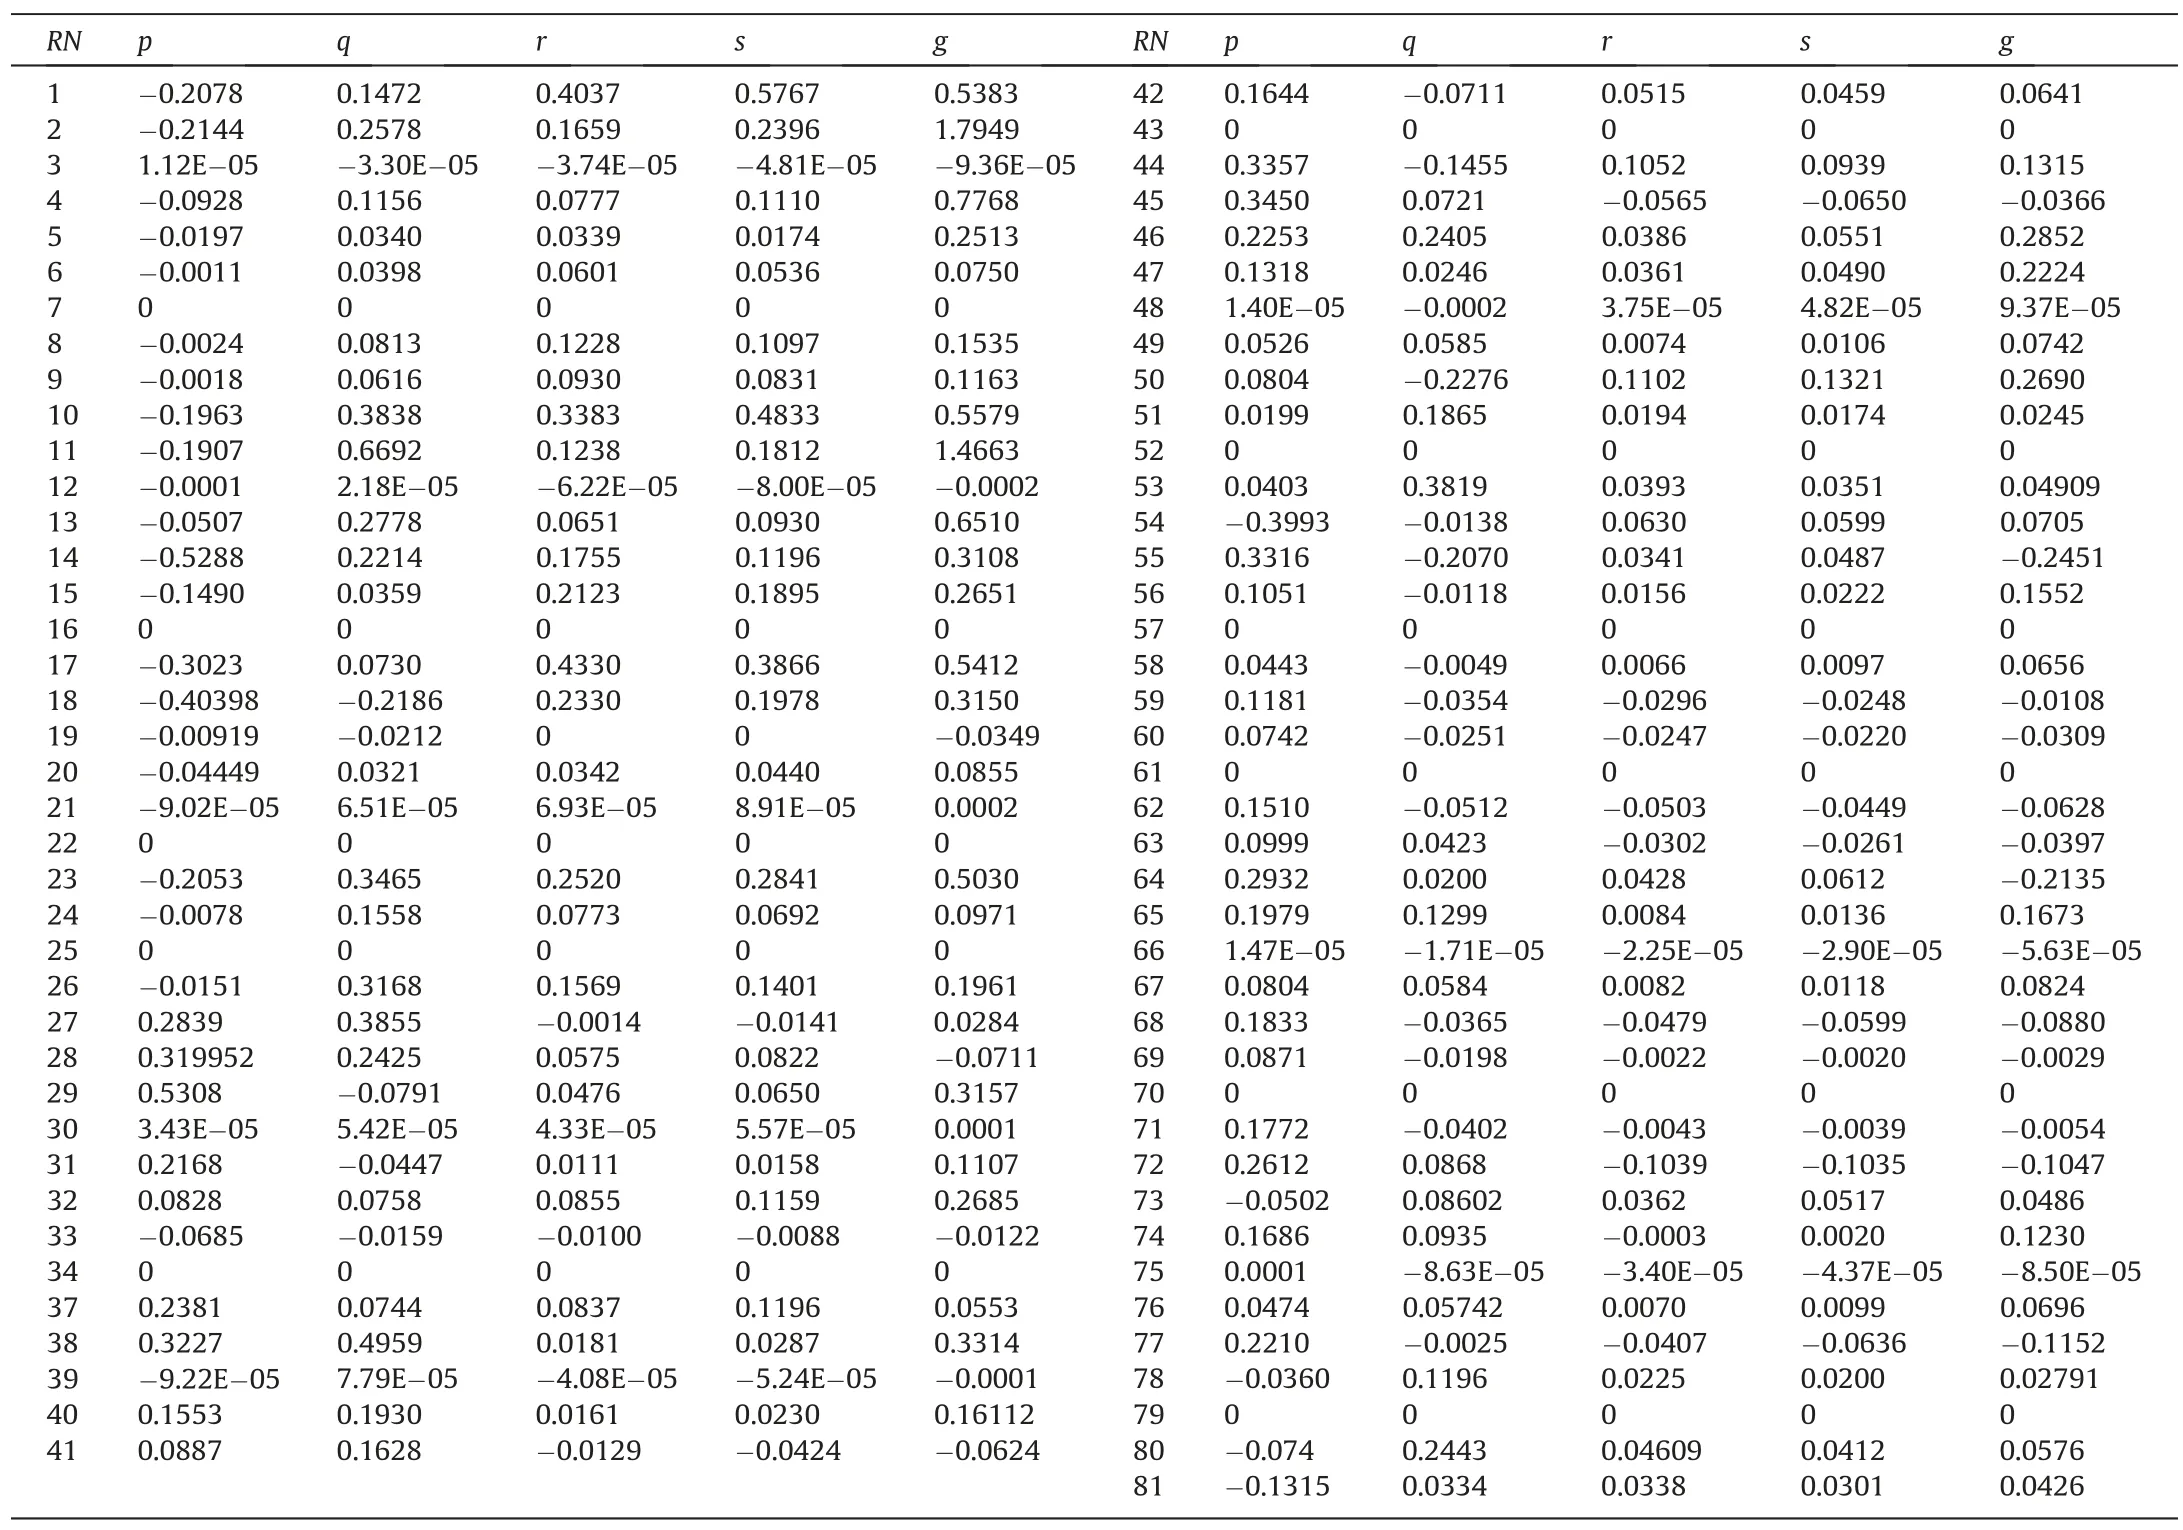
Table 4 Consequent parameters.
4.Conclusions
Blast-initiated ground vibration is one of the imperative environmental effects of blasting operation.As the blasting operation is an important component of the size reduction process,the prediction of blast-initiated ground vibration has attracted attention since the early 1960s and more attention in recent decades as the quarries are getting closer to the residential buildings due to the increase in population.The empirical models are the traditional method of estimating blast-induced ground vibration since they are simple to implement but they are not accurate.However,in recent decades,the AI method has been used to accurately predict the blast-initiated ground vibration but the practical applicability of the available AI methods is not guaranteed,as they are not in the form of a simple mathematical model.Hence,in this study,accurate and practically applicable AI models have been proposed using the GEP,ANFIS,and hybrid ANN.The 100 datasets measured from the five selected locations in Ogun State,Nigeria,were used for the model developments.The GEP model was implemented in GeneXpro tools 5.0 software while the ANFIS model was implemented in MATLAB code.The performances of the presented models were examined using some statistical parameters such as mean error,RMSE,R2,and standard deviation.Therefore,from the outcomes of the analyses,the following conclusions can be delineated.
(1) The error values of the proposed models are close to zero while their coefficients of determination are about 99%.
(2) The SCA-ANN and ANFIS models gave the best performance followed by the GEP model.
(3) The RMSE and standard deviation showed similar values depicting that the standard deviation is also an error indicator.
(4) The rock properties influence the blast-induced ground vibration.
(5) The proposed models established in this study will be more effective in predicting the PPV for datasets that fall within the range of those used in developing the predictive models and with similar rock properties.The models can as well be improved by considering datasets from other rock types.Another metaheuristic method can also be tried to assess its effectiveness in PPV prediction.
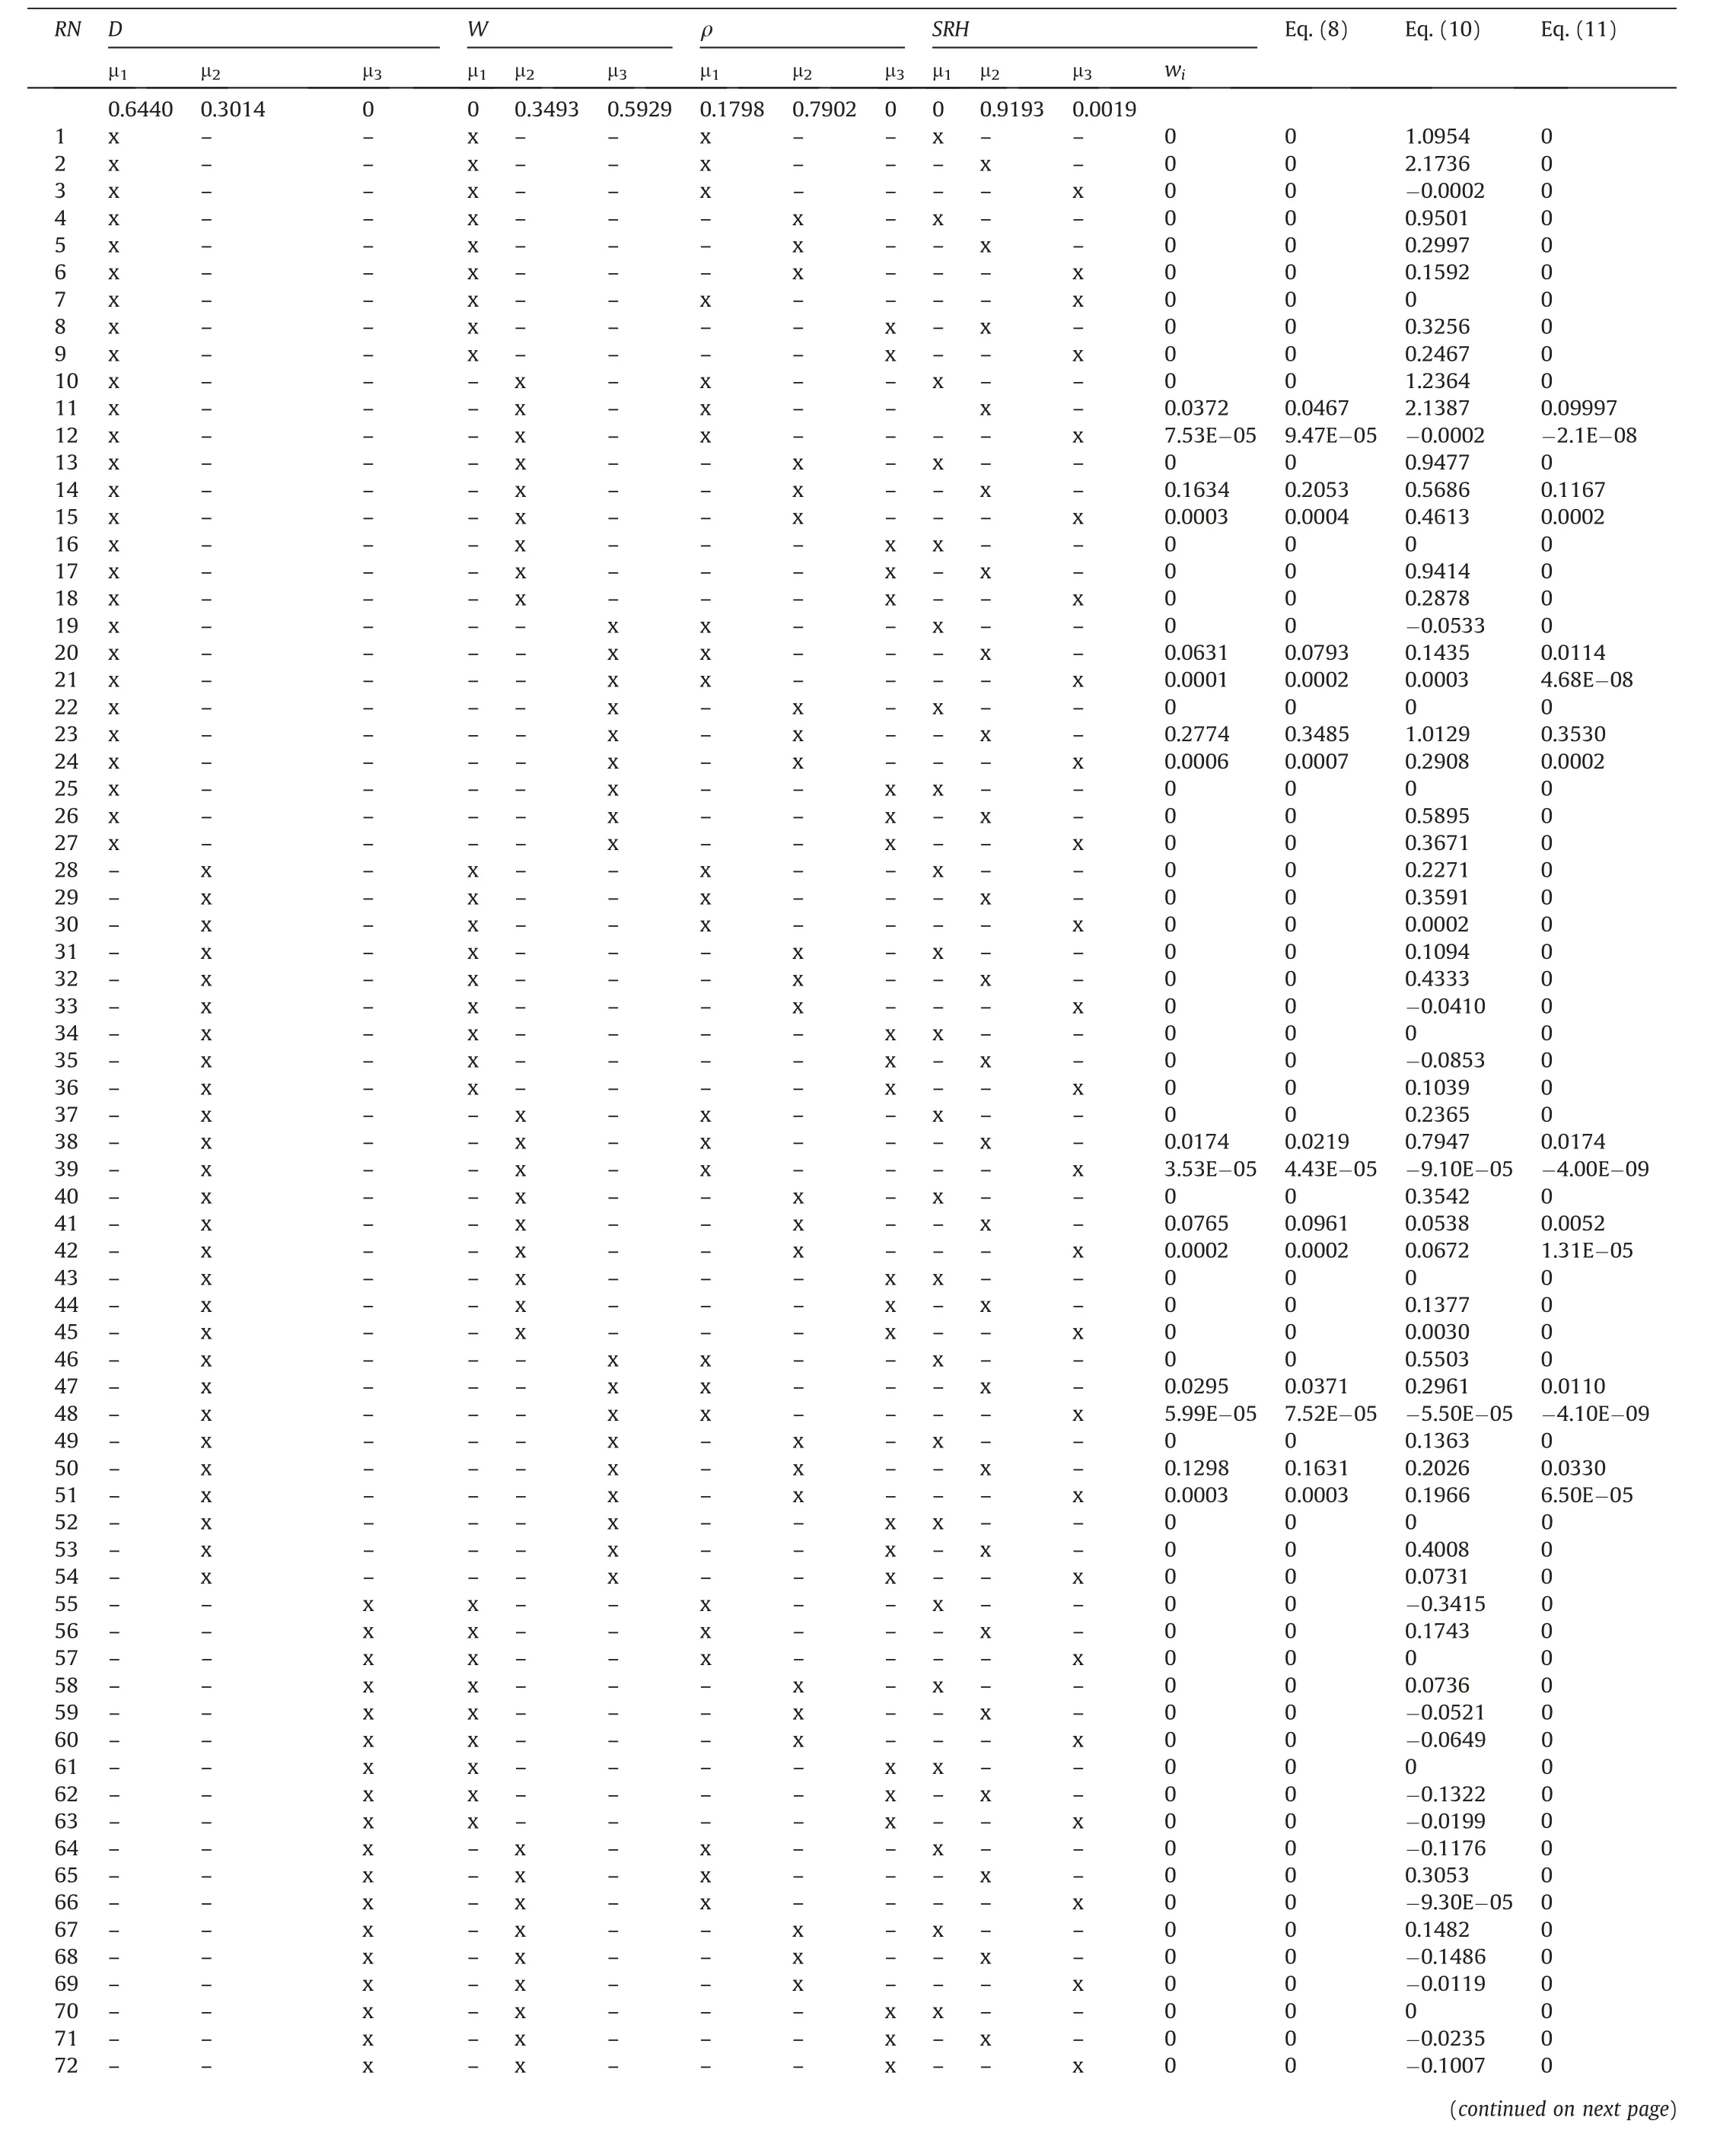
Table 5 Demonstration of the use of ANFIS.

Table 5(continued)
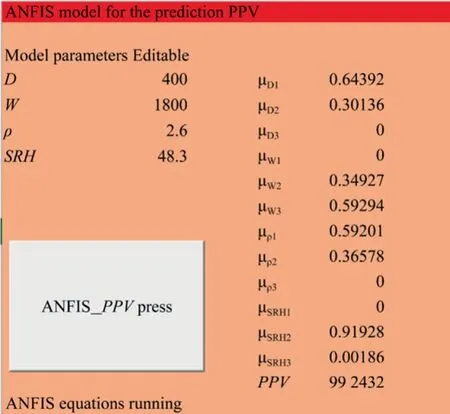
Fig.16.Visual basic programming based GUI.
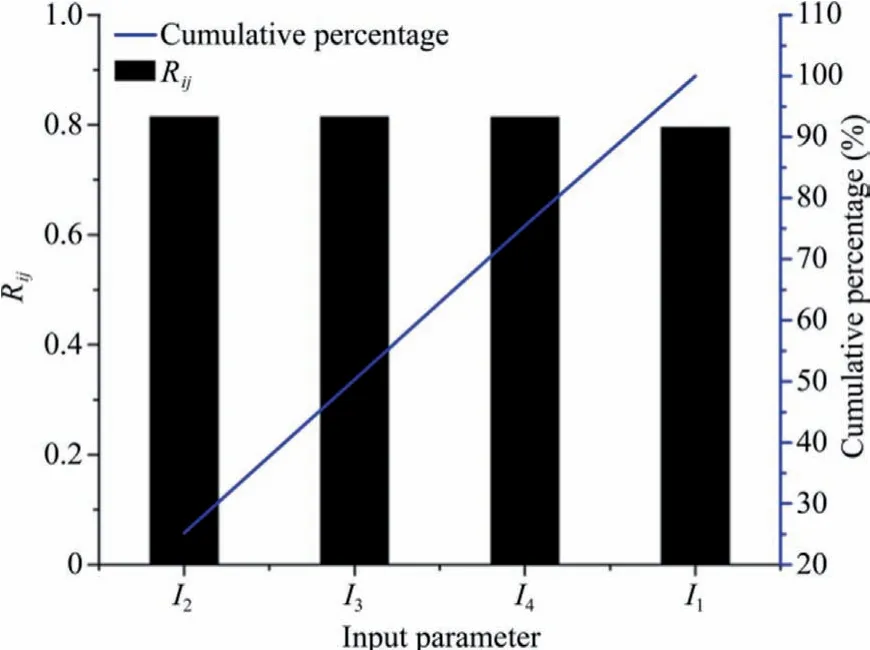
Fig.17.Sensitivity analysis of the proposed models.
Acknowledgement
This work was supported by Korea Research Fellowship Program through the National Research Foundation of Korea (NRF)fundedbytheMinistryofScienceandICT(2019H1D3A1A01102993).
杂志排行
矿业科学技术学报的其它文章
- Development of ensemble learning models to evaluate the strength of coal-grout materials
- An updated empirical model for ground control in U.S.multiseam coal mines
- Study on seepage and deformation characteristics of coal microstructure by 3D reconstruction of CT images at high temperatures
- Drilling signals analysis for tricone bit condition monitoring
- The influence of borehole arrangement of soundless cracking demolition agents (SCDAs) on weakening the hard rock
- Numerical assessment of the influence of former mining activities and plasticity of rock mass on deformations of terrain surface
