Numerical assessment of the influence of former mining activities and plasticity of rock mass on deformations of terrain surface
2021-04-08PaweSikoraMarekWesoowski
Paweł Sikora,Marek Wesołowski
Department of Mining,Faculty of Mining,Safety Engineering and Industrial Automation,Silesian University of Technology,44-100 Gliwice,Poland
Keywords:Rock mass Numerical modeling Post-mining Goafs Land surface deformations
ABSTRACT This paper presents the results of numerical simulations carried out to confirm the influence of former mining activities on deformation of the mining terrain.The assessment of deformation changes was carried out with the use of FLAC3D program based on the finite difference method.Numerical calculations were carried out for the example of actual mining operations in seams 703/1-2 and 707/2 of ‘‘Marcel”Coal Mine.Taking into account the influence of the model’s plastic features and the so-called activation of a higher occurring seam in conducted simulations enabled obtaining a very good description of the measured subsidence.Based on the results one may state that numerical model can be used to assess the influence of former mining activities and the direction of conducted exploitation on deformations of the mining terrain.These factors are not recognized by geometric-integral theories commonly used for predicting the influence of mining operations on the surface.The results presented in this paper confirm that the applied method of simulating the phenomenon of reactivation of post-mining goafs is correct.
1.Introduction
The issue of land surface subsidence caused by underground mining operations is an important problem in mining engineering[1].This applies in particular to built-up areas.The systematic extraction of seam deposits at continually greater depths means that current mining exploitation is carried out in conditions of rock mass that is heavily affected by previously conducted mining works [2,3].It fosters the phenomenon of the so-called activation of old goafs and thus leads to the resumption of exploitation influences after a period of their earlier stabilization[4,5].Activation of old goafs has a great influence on the course of rock mass deformation process causing the formation of additional subsidence of the terrain surface.The observed influences of exploitation conducted in such conditions show significant differences in relation to forecasts that do not take into account the presence of old goafs.The good example of this,described in more detail in this paper,may be the noticeable influence of old goafs activation observed by cyclical geodetic levelling on the measuring line stabilized at Górnos´la˛ska Street (Fig.1).
Of note here is much higher value of measured subsidence—versus the ones that result from re-prognosis—on the entire section of the measuring line.The additional influences observed on this section are too big to be an effect of the analyzed exploitation in seam 707/2.The comparison of maximum measured subsidence and the thickness of seam shows that the value of exploitation coefficient,a,should be 1.34(under the assumption that subsidence describes a full trough).Therefore,these influences are the results of activation of goafs of previously extracted seams and the unfinished influences of earlier exploitation.The deformations measured on this line illustrate the effects of mining operations in conditions of rock mass affected by earlier mining exploitation.
This paper attempts to determine the impact of former mining activities on the size and distribution of mining terrain deformations.The evaluation of deformation changes caused by the possible activation of old goafs was carried out through numerical modeling with the use of finite difference method (FDM) and FLAC3Dcomputer program.The theoretical usefulness of the method to describe the presented phenomenon has been demonstrated in a previous work of Wesołowski [4].
2.Conditions of conducted exploitation
The deposit of the mining area in question is located in the western part of the Upper Silesian Coal Basin,on the eastern and southern wing of the Jejkowice Basin.The geological structure of the deposit up to a depth constitutes the deposit itself.The overburden thickness is variable and reaches 50 m.In the exploitation area the overburden thickness is about 28 m.
The Carboniferous rock mass was developed in the form of layers of clay and sandy shales with fine and medium grained sandstones.The quantitative share of these layers is more or less the same.Thicker sandstone layers (up to about 20-25 m) are found only in the vicinity of seam 703/1-2.In the discussed area the deposit shows monoclinal occurrence of layers in a westerly direction and in the range of slopes up to about 3°.
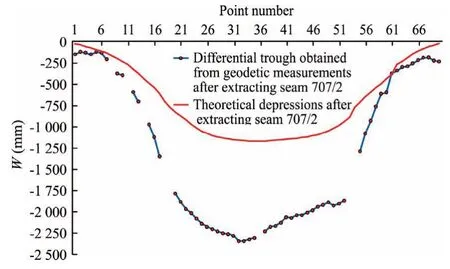
Fig.1.Matching of the theoretical subsidence (W) trough profile to differential geodetic measurements carried out on a line stabilized at Górnos´la˛ska Street.
The exploitation of seam 707/2 (see Fig.2) was conducted in January 2002 to March 2003 and September 2003 to July 2004 for longwalls M-6 and M-7,respectively.In both cases it was carried out in a longwall system with roof caving.The average exploitation thickness was 1.7 m.The panel length of M-6 longwall was 1050 m while its average length added up to 210 m.The exploitation began at an average depth of about 697 m and ended at 659 m.In the case of M-7 longwall,the parameters were similar,its panel length was about 1050 m and its length about 200 m.The exploitation began at an average depth of 690 m and ended at a depth of about 665 m.Both longwalls were exploited from north-east towards south-west.
In the case of seam 703/1-2 (see Fig.2),exploitation was conducted in September 1995 to July 1996 and September 1996 to November 1998 for longwalls M-5 and M-6,respectively.Also,in these cases exploitation was carried out in a longwall system with roof caving.The average height of the extracted M-5 longwall was 2.5 m,while for the second longwall it was 2.4 m.The panel length of M-5 longwall was on average 550 m,and its average length did not exceed 300 m.The exploitation of the parcel began at an average depth of about 627 m and ended at a depth of about 660 m.In the case of M-6 longwall its average panel length was 1610 m.In the range adopted for analysis the length of longwall was on average 200 m in the initial course of longwall up to 300 m.Exploitation began at an average depth of about 635 m and ended at an average depth of 674 m.The M-6 longwall was exploited from north-east to south-west and the M-5 longwall in the opposite direction.
On the surface of mining terrain,the measuring line was set up and became subjected to cyclical measurements.The distances between neighboring points were on average 23 and 27 m in the area above the extracted M-5 longwall in seam 703/1-2.The direction of the measuring line is approximately parallel to the longwall’s panel length but in the northern part,near the exploitation edges of M-6 and M-7 longwalls in seam 707/2,it changes direction and on a short section runs perpendicularly to panel lengths of longwalls,which causes difficulties in mapping the whole situation in the adopted rock mass model.
In order to compare the results of simulation with geodetic observations it was decided to choose the profile of subsidence line measured on November 25,2004 (see Fig.2),which was the last measurement carried out to capture changes in the mining area subsidence for the described exploitation.

Fig.2.Scheme of seams 707/2 and 703/1-2 exploitation in relation to the measuring line on the surface of mining terrain.
3.Calculation method
Numerical calculations were made using the FLAC3Dprogram,in which the FDM was implemented [6].A distinctive feature of the method is the ability to perform simulations using a grid with rectangular shaped elements.This results in a significant increase in the computational efficiency of the method compared to the finite element method [7].
In engineering practice,the FLAC3Dprogram is used to create rock mass models and to simulate the behavior of soil and rock mediums that experience plastic flow or brittle fracture after reaching the yield point or strength limit.The software is used to perform numerical calculations relating to both the immediate surroundings of mining excavations and much larger spaces.In addition,the program allows you to model the impact of discontinuities in the rock mass on the distribution of deformation as well as to simulate the behavior of rock mass and buildings during dynamic excitations.
The plasticity feature of the rock mass in the model results from the assumption that in a limited area of the rock mass it behaves linearly elastically and outside it behaves plastically.In FLAC3D,the plasticity condition is based on the assumption that the total increase of deformation is divided into increase of elastic deformation and increase of plastic deformation.
The numerical procedure first consists of calculating the increase in deformation resulting from the application of Hooke’s law.Then,based on the deformation values,stress values are determined.If the stresses obtained are outside the boundary surface(defined as the strength criterion),it is assumed that there are plastic deformations.In this case,only elastic deformations participate in the procedure of subsequent calculations of stress increments.
4.Calculation model
The numerical model of rock mass was built in accordance with the mining and geological conditions described above.This model shows a spatial body whose base has dimensions of 2975 m×2025 m and its height equals to 1500 m(Fig.3).The size of thegridhas beenadopted insuch a way that numerical calculations are unfettered and on the other hand optimized for computational performance.On the surface of the model,the locations of measuring points on the line stabilized along Górnos´la˛ska Street were mapped.
Mathematically,it was assumed that all layers constituting the model of rock mass were described by the ubiquitous joint medium.This model is an anisotropic elastic-plastic medium that contains weakness planes of a given orientation[4].The model has strength(plasticization)condition of Mohr-Coulomb implemented[8].Plasticization may occur both within weakness planes and rock mass.Weakness planes may be inclined at any angle α to the XY plane[6].
Strength and deformation parameters of layers were adopted on the basis of the lithological profile determined from the test bore hole.The borehole,classified as exploratory,was made by the ‘‘Marcel”Coal Mine.Parameters of the remaining part of the model (below 1000 m) were adopted as a homogeneous floor structure with an averaged value representing the substitute Carboniferous medium.Parameters of weakness planes were determined with the use of a case described in [9].The variability range of material parameters of ubiquitous joint model rock layers adopted for calculations is shown in Table 1.The detailed scheme of the selection of deformation parameters is presented in the article of Kołodziejczyk and Wesołowski [10].
The presented model was divided using a difference mesh with zones similar to cuboids.It was assumed that the value of primary stresses in rock mass comes only from gravitational forces[11,12].The horizontal primary stresses σxand σywere determined in the process of initial numerical calculations [13,14].
The central part of the model encompassed the simulation of mining exploitation of longwall excavations with roof caving.The simulation of exploitation was based on cyclical removal of individual zones of the finite difference mesh in the order corresponding with the progress of longwall excavation.At the same time,contact elements (separation plane) have been introduced between the roof and floor layers to prevent mutual penetration of the seam’s roof and floor.This method of simulating mining exploitation eliminates the need to introduce additional parameters assigned to caving zones [4].
According to the analyzes of geodetic observations [15-17]the disclosure of the influence of exploitation over time takes place extremely fast.It is evidenced by the high values of parameter c of the Knothe’s equation (c is the surface subsidence speed rate)and very small values of subsidence increments observed after stopping the exploitation front.Therefore,in the conducted simulation it was possible to adopt a simplified quasi-static model of rock mass in which the effects caused by the exploitation (removal) of subsequent difference mesh belonging to seam are revealed immediately [18,19].There are no viscous parameters here and there is no concept of a time factor.However,the order of removal(exploitation)of respective zones of mesh is important.
5.Verification of parameters of the calculation model
To verify the calculation model and the correctness of its adopted parameters,the results of numerical calculations were compared with geodetic measurements carried out on the measuring line.The analysis was based on observational cycle from December 15,1996 basically presenting a static subsidence trough that appeared on the terrain surface after extracting the M-5 and M-6 longwalls in seam 703/1-2.The matching of modeling results to geodetic measurements is shown in Fig.4.
The results of computer simulation carried out with the use of FLAC3Dprogram were checked by comparing the subsidence obtained from numerical modeling with the measured one that appeared after extracting the deposit in the longwall panel.The results of this comparison are shown in Fig.5.It was assumed that there should be a regressive relationship between the analyzed subsidences.
where Wmodelis the subsidences obtained from numerical modeling;Wmeasuredthe measured subsidences;and m and n the parameters.
Using the relationship (Eq.(1)),one obtains

The obtained results are characterized by a very high degree of match.Coefficient of determination R2=0.984.The average error for this relationship reaches the value of 85.56 mm and the corresponding coefficient of variation Mw=100% × 85.56 mm/1959 m m=4.367%.
Theoretical trough profiles along the measuring line obtained through numerical modeling are characterized by high accuracy of match to the profile of trough determined by means of geodetic measurements.The difference between the maximum theoretical subsidence and the results of geodetic measurements does not exceed 5% in relation to the maximum values of subsidences.
The largest differences between the calculated and measured subsidences appeared in the marginal part of the trough,near the edge closing mining exploitation in seam 703/1-2.One can only speculate that the discrepancies in this part of the trough result from factors that were not taken into account in the process of building the calculation model.
The comparative analysis of the results of numerical modeling and geodetic measurements carried out during the exploitation of the M-5 and M-4 longwalls shows that the strength and deformation parameters of the model were selected correctly.A very good description of the measured subsidences obtained by the FDM confirmed the correctness of the adopted method of simulating mining exploitation.
The presented results of computer simulations indicate that it is possible to describe the effects of the direction of exploitation influence on the shape of the profile of incomplete subsidence trough formed over the progressing longwall front(over the panel of M-6 longwall) very accurately.This effect is particularly visible on the map of model subsidences shown in Fig.6.
As the results of computer simulation have shown,the largest plasticization zones appeared in layers constituting the direct vicinity of the exploited coal seam (Fig.7).In the area of the start-up edge of mining exploitation appeared plasticization zones practically reaching the surface of the model.Plasticization of this part of the model is the reason for larger settlements in the bottom part of the subsidence trough.In subsoil layers the plasticization of rock layers is caused by stresses exceeding the strength parameters of weakness planes.These zones are the main reason for the asymmetry of model surface depressions in the areas of the beginning and end of exploitation.
The numerical model constructed and verified this way became a basis for further simulations of the influence of the M-6 and M-7 longwalls exploitation in seam 707/2 under goafs of seam 703/1-2.
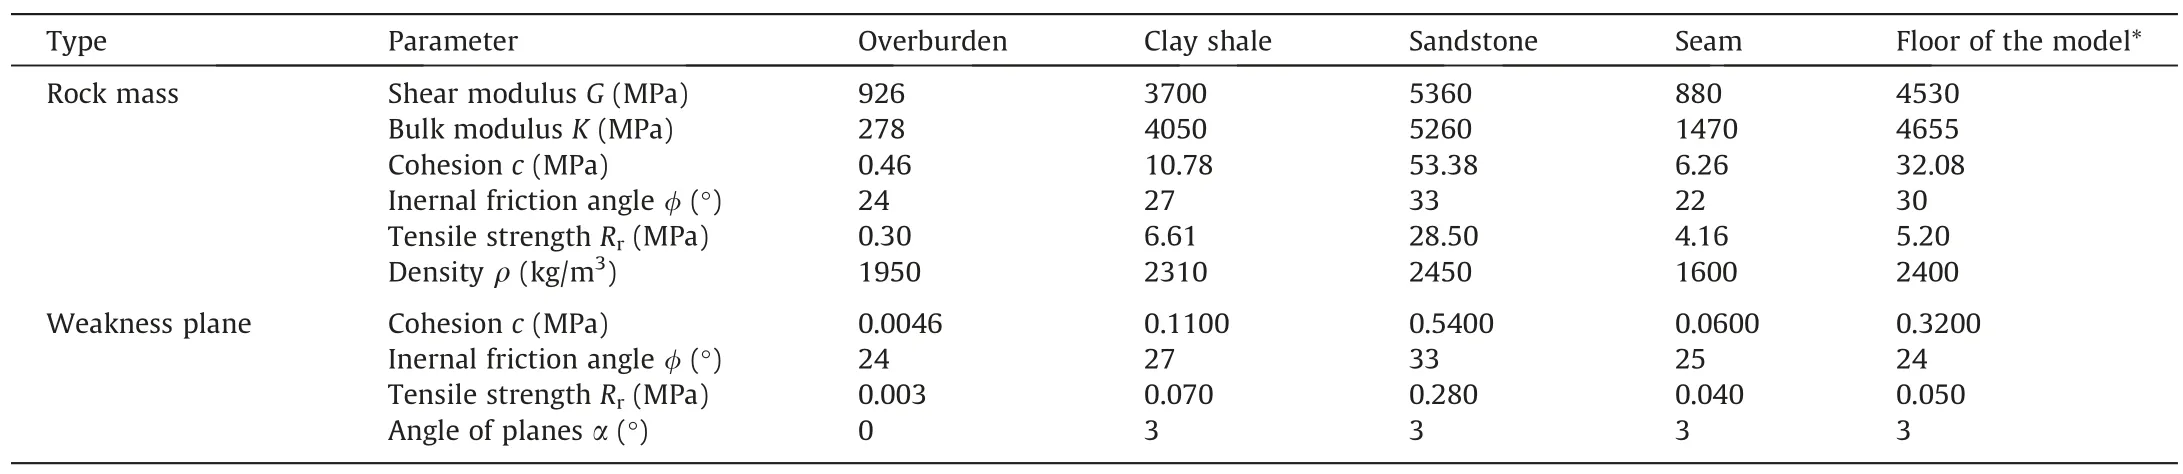
Table 1 Values of rock layers parameters adopted for calculations.

Fig.4.Measured and calculated subsidences(W)on the measuring line determined after the end of exploitation in the first seam 703/1-2.

Fig.5.Results of the comparison of model subsidences Wmodel and geodetic measurements Wmeasured from the measuring line.
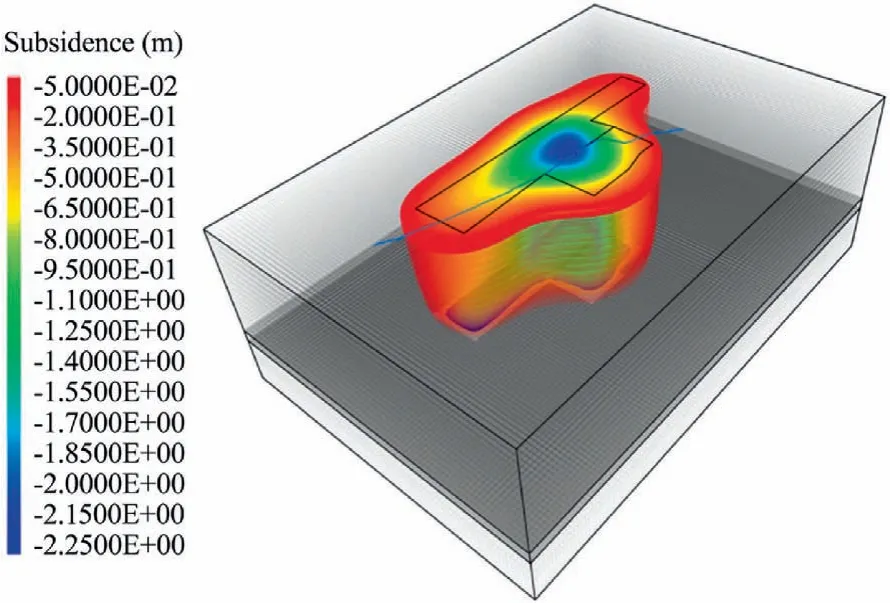
Fig.6.Map of depressions determined after extracting the M-5 and M-6 longwalls in seam 703/1-2.
6.Numerical analysis of the activation of gobs in seam 703/1-2
The next stage of numerical calculations was the simulation of mining exploitation in seam 707/2 with the M-6 and M-7 longwalls in the circumstances of rock mass affected by earlier exploitation in seam 703/1-2.For this purpose,after the end of the course of M-5 and M-6 longwalls in seam 703/1-2 the displacements of nodal points were zeroed while the state of stresses and plasticization in the model was retained.An additional comparative simulation was performed to determine in detail the influence of former mining activities on the deformations of model’s surface.In the case of this simulation the effects of former mining activities in seam 703/1-2 and structural changes caused by this exploitation were omitted.

Fig.7.Plasticization zones of rock mass determined after extracting the M-5 and M-6 longwalls in seam 703/1-2.

Fig.8.Calculated subsidences (W)on the measuring line determined after the end of exploitation in seam 707/2.
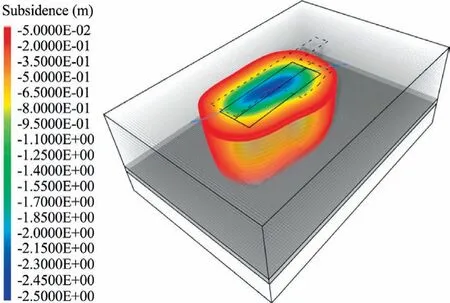
Fig.9.Map of subsidences determined after extracting seam 707/2 with inclusion of goafs in seam 703/1-2.
The results of numerical calculations performed for individual stages of computer simulation are presented in Fig.7.Additionally,Figs.8-10 show maps of depressions and damage zones in the model.Based on the results of calculations it can be stated that:

Fig.10.Plasticization zones determined after extraction of seam 707/2 with inclusion of goafs in seam 703/1-2.
(1) The effect of mining exploitation in seam 707/2 conducted with the M-6 and M-7 longwalls under post-extraction goafs in seam 703/1-2 simulated with the use of FDM is the formation of an incomplete subsidence trough on the model’s surface,for which the maximum subsidence value is Wmax=2415 mm (Fig.8).Upon comparting this value of maximum subsidence with the average height of longwalls exploited in seam 707/2—which amounts to 1.7 m—the authors obtain a relatively high value of the exploitation factor a=1.42.The reasons for such significant increase in subsidences are the volumetric changes in rocks and goafs resulting from the plasticization of the model and the fact of two incomplete subsidence troughs resulting from the extraction of seams 703/1-2 and 707/2 overlap.Some irrelevant due to the main issue but noticeable slight differences in subsidences at the beginning and end of the measuring line may result from the so-called distant influence of mining exploitation carried out by the coal mine in the described region.They were recorded with geodetic measurements,while they were not included in the numerical calculations.
(2) The result of the simulation of subsidences caused by exploitation of the M-6 and M-7 longwalls in seam 707/2 without taking into account the presence of goafs in seam 703/1-2 significantly differs from the differential subsidences resulting from geodetic measurements.The distinctive feature of the theoretical trough is its inordinately shallow profile with subsidence amounting to only 1260 mm.This value is smaller than the maximum differential subsidence by approximately 47%.The largest difference between measured and calculated subsidences occurs in the area of the end of course of the M-5 and M-6 longwalls in seam 703/1-2 (Fig.8).The inclusion of the activation of old goafs in the upper occurring seam 703/1-2 in the computer simulation radically improved its results.Both the maximum values of the measured and calculated subsidences and places of their occurrence are characterized by high compliance that evidences the correctness of the adopted method of simulating old goafs activation.
(3) Upon assessing the subsidence trough that appeared on the surface of the model (Fig.9) one can notice the influence of post-extraction goafs in seam 703/1-2 which is manifested in the shift of maximum subsidences in regard to the edge of exploitation in seam 707/2.Here one can observe the phenomenon of twisting the subsidence trough in regard to the direction of the mining exploitation.This twisting is partly the effect of location and shape of the post-extraction goafs in seam 703/1-2.
(4) The simulated mining exploitation of the M-6 and M-7 longwalls in seam 707/2 caused a significant increase of damage zones in the model of rock mass (plasticization of the zones of difference mesh).At the current stage of numerical calculations,the plasticization zones basically encompass the entire rock mass over the contours of the conducted mining exploitation (Fig.10).Of note here is the effect of the direction and order of longwall panels in both seams.The main plasticization area encompasses the part of rock mass above the panels of M-5 and M-6 longwalls in seam 703/1-2.Further mining exploitation of the M-6 and M-7 longwalls in seam 707/2 resulted in the propagation of the existing plasticization zones determined in the previous stage of computer simulation.The area of such plasticizations which appeared after terminating the exploitation in seam 703/1-2 was at the same time an additional slip zone for displacements in the model resulting from the exploitation of seam 707/2.This slip is also responsible for the effect of uneven displacement(twisting)of the subsidence trough in relation to the course of the exploited longwalls.
(5) In the case of the comparative model in which the former mining activities in seam 703/1-2 and structural changes in the model caused by this exploitation were not taken into account,the resulting subsidence trough is asymmetrical in relation to the edges of the beginning and end of exploitation (Fig.11).No twisting effects relative to the course of the M-6 and M-7 longwalls in seam 707/2 were found here.In the floor parts of the subsidence trough there is a visible diversity of subsidence and gradual shallowing of the floor from the slope side over the places where the wall course ends.In all probability the observed disturbance in the shape of the floor part of the subsidence trough is the result of abrupt increases of subsidences and plastic deformations inside rock mass [20,21].
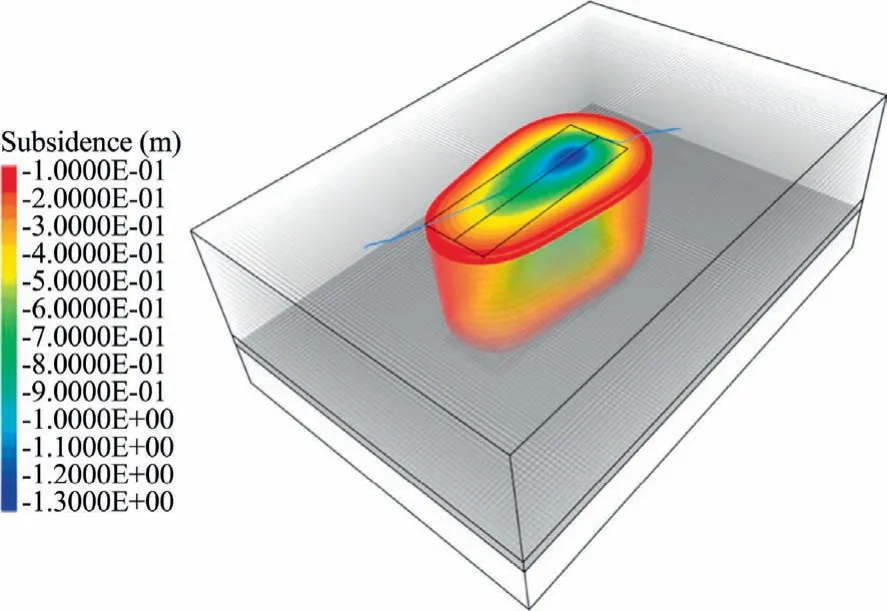
Fig.11.Map of subsidences determined after extracting the M-6 and M-7 longwalls in seam 707/2 without taking into account gobs of seam 703/1-2.
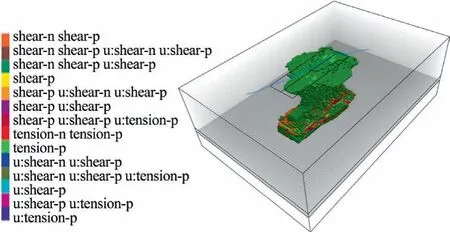
Fig.12.Plasticization zones determined after extracting the M-6 and M-7 longwalls in seam 707/2 without taking into account goafs in seam 703/1-2.
(6) The numerical calculations carried out for the comparative model (Fig.12) show that the lack of additional influences resulting from former exploitation in seam 703/1-2 would cause a significantly smaller range of plasticization zones.The largest plasticization zones appeared in layers constituting the direct vicinity of the exploited coal seam.This applies to both the roof and floor layers.In the area of the beginning of longwall exploitation appeared plasticization zones reaching practically the surface of the model.The plasticization of this part of the model is the reason for larger settlements in the floor part of the subsidence trough.These zones are the main reason for the asymmetry of the subsidences of the model surface in the areas of the beginning and end of exploitation.The uneven distribution of subsidences on the surface of the model results from the differences in the states of stresses and deformations that occur during the formation of the subsidence trough.The process of forming the slope of the trough above the point of the beginning of exploitation took place in conditions of significant influences of close exploitation (resulting from the vicinity of both edges of exploitation).This influence disappears as mining exploitation progresses.This is particularly evident in the final sections of the longwall panel length,in the area where the plasticization zones are the result of stresses arising in the vicinity of one (movable) edge of exploitation.
7.Summary and final conclusions
This paper presents the results of numerical simulation of the influence of former mining activities on deformations of the mining area.Numerical calculations were carried out for the example of actual mining exploitation in seams 703/1-2 and 707/2 of‘‘Marcel”Coal Mine.The influences of this exploitation were covered by geodetic measurements of measuring points on the line stabilized along Górnos´la˛ska Street.Taking into account the influence of the so-called activation of a higher occurring seam allowed obtaining a very good description of the measured subsidences which confirmed the correctness of the adopted method of simulating the phenomenon of old goafs activation.
(1) Based on the comparative analysis of the results of numerical modeling and geodetic measurements carried out during the exploitation of the M-5 and M-4 longwalls in seam 703/1-2 it can be concluded that the strength and deformation parameters of the model were selected correctly.This model was then used to conduct further numerical simulation of the influence of the M-6 and M-7 longwalls exploitation in seam 707/2 under goafs in seam 703/1-2.
(2) The exploitation in seam 707/2 which carried out partly under goafs in seam 703/1-2 caused the deformation of the terrain surface in the form of an incomplete subsidence trough.The significant increase in the maximum subsidence is the result of overlapping the two incomplete troughs that appeared as the result of extraction of seams 703/1-2 and 707/2.
(3) The inclusion of the activation of old goafs in the higher occurring seam 703/1-2 in computer simulation radically improved the results of conducted simulations.Both the maximum values of measured and calculated subsidences and places of their occurrence exhibited a high level of compliance.
(4) The simulated mining exploitation of the M-6 and M-7 longwalls in seam 707/2 caused a significant increase of plasticization zones in the model of rock mass,formed after the exploitation of seam 703/1-2.This area is an additional zone of slip and increase of subsidences resulting from volumetric changes.This slip is also responsible for the effect of twisting the subsidence trough in relation to the course of the exploited longwalls.
(5) The comparative analysis of the results of numerical modeling and geodetic measurements carried out during mining exploitation led to the conclusion that the numerical model can be used to assess the influence of former mining activities and the direction of conducted mining exploitation on deformations of the surface of mining terrain.These factors are not taken into account by the geometric-integral theories commonly used for forecasting [22].
Acknowledgement
The article presented above is based on the results of the prognosis of the impact of underground mining operations in the seam 702 made as part of the work ordered by Marcel Coal Mine.
杂志排行
矿业科学技术学报的其它文章
- Evaluation of the use of sublevel open stoping in the mining of moderately dipping medium-thick orebodies
- Stability control of gob-side entry retained under the gob with close distance coal seams
- A novel coating technology for fast sealing of air leakage in underground coal mines
- A robust approach to identify roof bolts in 3D point cloud data captured from a mobile laser scanner
- Physical model test and numerical simulation on the failure mechanism of the roadway in layered soft rocks
- Deformation response of roof in solid backfilling coal mining based on viscoelastic properties of waste gangue