Study on seepage and deformation characteristics of coal microstructure by 3D reconstruction of CT images at high temperatures
2021-04-08GangWangXiangjieQinDongyangHanZhiyuanLiu
Gang Wang,Xiangjie Qin,Dongyang Han,Zhiyuan Liu
a State Key Laboratory of Mining Disaster Prevention and Control Co-found by Shandong Province and the Ministry Of Science and Technology,Shandong University of Science and Technology,Qingdao 266590,China
b College of Safety and Environmental Engineering,Shandong University of Science and Technology,Qingdao 266590,China
Keywords:Coal Pore-fracture structures Fluid-solid conjugate heat transfer Thermal deformation
ABSTRACT To study the seepage and deformation characteristics of coal at high temperatures,coal samples from six different regions were selected and subjected to computed tomography (CT) scanning studies.In conjunction with ANSYS software,3D reconstruction of CT images was used for the establishment of fluidsolid conjugate heat transfer model and coal thermal deformation model based on the microstructures of coal.In addition,the structure of coal was studied in 2D and 3D perspectives,followed by the analysis of seepage and deformation characteristics of coal at high temperatures.The results of this study indicated that porosity positively correlated with the fractal dimension,and the connectivity and seepage performances were roughly identical from 2D and 3D perspectives.As the porosity increased,the fractal dimension of coal samples became larger and the pore-fracture structures became more complex.As a result,the permeability of coal samples decreased.In the meantime,fluid was fully heated,generating high-temperature water at outlet.However,when the porosity was low,the outlet temperature was very high.The average deformation of coal skeleton with different pore-fracture structures at high temperatures showed a trend of initial increase and subsequent decrease with the increase of porosity and fractal dimension.The maximum deformation of coal skeleton positively correlated with connectivity but negatively correlated with the fractal dimension.
1.Introduction
With the depletion of shallow mineral resources,the mining gradually turns to deep mining [1,2].The mining depths of coal,geothermal resource,and non-ferrous metal mines have reached approximately 1500,5000,and 4500 m,respectively.The increasing mining depth will lead to an increase in the formation temperature [3].For example,when the mining depth is 500 m,the temperature of the coal rock reaches 50.6°C in a typical coal mine in Moramba [4].And the structure and seepage characteristics of coal vary considerably at high temperatures,which will significantly affect the coal seam injection [5-7],hydraulic fracturing[8,9],and geothermal mining [10,11].Therefore,it is necessary to use appropriate means to investigate the conjugate heat transfer and thermal deformation mechanism of coal from the microscopic perspective.
To study the microstructure and seepage characteristics of coal at high temperatures,Liu et al.[12]studied the mechanical and acoustic emission characteristics of coal at different temperatures,as well as the pore-fracture structures characteristics of coal after temperature shock by means of computed tomography(CT),scanning electron microscope(SEM),and mercury intrusion porosimeter (MIP).By using X-ray diffraction (XRD) and Fourier transform infrared spectroscopy (FTIR),Pan et al.[13]investigated the microstructural evolution of coal at different temperatures.Feng et al.[14]simulated the stress environment of anthracite with a depth of 500 m and analyzed the thermal deformation characteristics of anthracite under the stressed environment.In these studies,different observation and experimental methods were employed to investigate the structural characteristics of coal at high temperatures.To study the seepage characteristics of coal at high temperatures,Shang et al.[15]established a permeability model for the thermal fracture process of fractured rock through theoretical analysis,which could adequately describe the permeability evolution with stress and temperature changes.Kumari et al.[16]used experimental equipment to conduct hydraulic fracturing experiments in different temperature environments and combined CT to study the pore-fracture structure change.These studies considerably contributed to the fields of hydraulic fracturing and geothermal extraction.However,the fluid-solid conjugate heat transfer and thermal deformation in the pore-fracture structures of coal have not been directly visualized,neither the effects of different pore-fracture structures on the heat transfer and the thermal deformation of coal.In addition,these methods require a large workload and complicated procedures,which can easily damage coal samples during the experiment and interfere with the experimental results.
Due to the advantages of non-destructive visualization and post-processable data of CT scanning technology [17-19],the digital core technology based on 3D reconstruction of CT images has been widely used in the studies of pore-fracture structures and seepage of coal.Roslin et al.[20]proposed the subvoxel processing method for the volume effect of low-resolution micro-CT and obtained the permeability data by LBM(lattice Boltzmann method)single-phase flow simulation.Zhao et al.[21]studied the characteristics of the micro pore-fracture structures of the coal based on nano-CT method and carried out seepage simulation to verify the anisotropic characteristics of coal.By using micro-CT technology,Schmitt Rahner et al.[22]analyzed the fractal characteristics of the pore-fracture structures of shale and tight sandstone quantitatively and established a relationship model between porosity,permeability,and fractal dimension.These researchers have successfully applied 3D CT reconstruction technology to study the porosity,pore size distribution,connectivity,and fractal dimensions of coal,and analyzed the relationship between pore-fracture structure parameters and permeability.However,the temperature effect was not considered in these studies,so their results cannot accurately describe the structure and seepage characteristics of coal in a deep mining environment.
To overcome the drawbacks in studying the seepage and deformation characteristics of coal in the high-temperature environment with current 3D CT reconstruction technology,a construction method of heat transfer and deformation model of coal structure at high temperatures was proposed in this study.This method accomplished the effective docking of the digital model of coal with the finite element analysis software ANSYS.In this study,pore-fracture structures of the selected six coal samples were built by using 3D CT reconstruction technology,and were further analyzed from the 2D and 3D perspectives.Subsequently,the conjugate heat transfer model and skeleton thermal deformation model were constructed in ANSYS.Finally,the conjugate heat transfer and thermal deformation characteristics of coal were analyzed by using pore-fracture structure parameters such as the porosity and fractal dimension.
2.CT scanning experiment and 3D reconstruction
2.1.Coal sample
In order to study the seepage and deformation characteristics of different pore-fracture structures of coal at high temperatures,six samples from various coal mines were selected for investigation.The information about coal samples is shown in Table 1.Multiple coal samples were taken and extracted in the laboratory by using a small-diameter drill bit.The diameter of the coal samples is 2 mm,and the length is more than two times the diameter.The coal samples with optimal grinding effect were selected and dried for the CT scanning experiment.
2.2.CT scanning experiment and image processing
Xradia 510 Versa high-resolution X-ray scanner manufactured by ZEISS was used for the scanning in this study.This equipment has a two-stage zoom function and can maintain a high resolutionat a large working distance.The resolution of the scanning equipment is related to the size of the coal sample.The larger the size of the coal sample,the lower the scanning resolution.The relationship between the resolution of this device,the size of the coal sample,and the working distance is shown in Fig.1.In this study,1001 2D images were obtained at the equipment scanning resolution of 1 μm with a field view of 1 mm in diameter and 1 mm in height.
Table 1 Coal sample information.
The size of the images obtained after scanning is 1000 × 1000 pixels2,which is too large to use directly for simulation because it will crash the computer during the meshing and solving process.According to the previous studies [23-25],when the size of the research object was 200× 200 × 200 pixels3,the physical properties of the digital core no longer depended on the size of the research object.Therefore,in this study,200 images were selected from a series of CT images,and the image size was cropped to 200 × 200 pixels2from the center of the image.The size of the study object was 200 × 200 × 200 voxels.The cropped images at this time were a series of grayscale images.The larger the grayscale value of the image,the higher the density of the measured object.The black,gray,and white highlight areas in the image represented pore,coal,and high-density mineral,respectively.Since the gray image contains a lot of system noise that affects the reconstruction,these gray images need to be filtered.Conventional filtering methods include Gaussian filtering,median filtering,and mean filtering[26-28],of which median filtering is useful for the effective removal of salt and pepper noise and has been used by many experts [21,29].For these reasons,the median filtering method was used to process the image in this study.After filtering,it is not ready to reconstruct the image directly.Threshold segmentation is needed to distinguish the pore-fracture structures and coal skeleton in the grayscale image.The selection of the threshold is the critical step for threshold segmentation.In this study,a suitable threshold was selected by comparing the calculated porosity by the reconstruction model (the observation scale is 1 μm) with the measured porosity by MIP (AutoPore IV 9500,the measurement range is 0.003-1000 μm).Since the MIP will result in the compaction of tiny pores in the coal during pressure application,the MIP and CT are not ideal for the observation of micropores.In this research,the low-rank coal with undeveloped micropore structure was selected,and the measured porosity of MIP only included pores with a diameter of more than 1 μm,so the MIP can be used as a control to select the threshold.During the model building process,the threshold is adjusted continuously until the modeled porosity is slightly different from the measured porosity,and the optimal threshold is determined.With the selected thresholds,the pore-fracture structures model and the coal skeleton model can be reconstructed for the conjugate heat transfer simulation and deformation simulation.Taking the coal sample S6 as an example,the reconstruction process is shown in Fig.2.
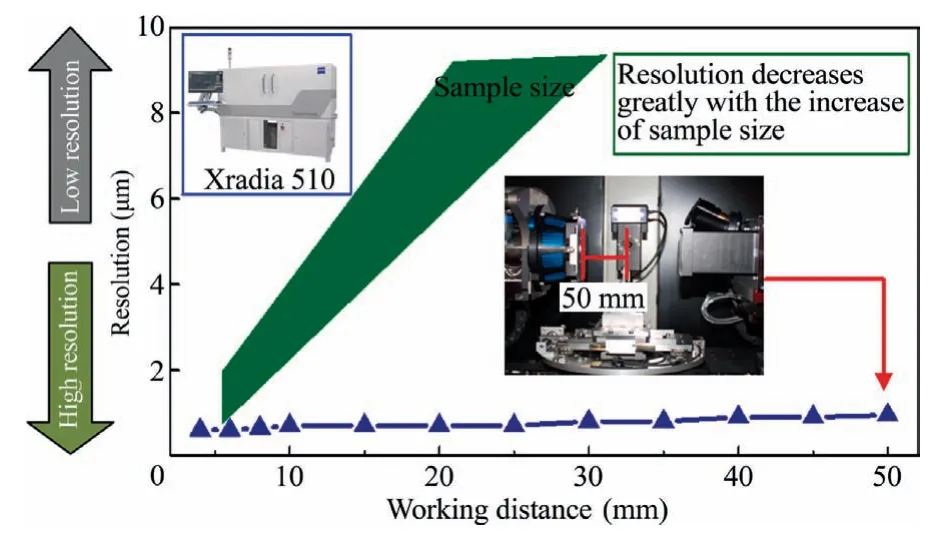
Fig.1.Relationship between equipment resolution,working distance,and coal sample size.
2.3.Calculation of fractal dimension based on CT images
The fractal dimension can be used to describe the complexity of the coal structure quantitatively.The 2D and 3D box dimensions of coal can be calculated according to 2D CT images and 3D porefracture structures model.The definition of box dimension is [29]
where D is the box dimension;ε the minimum side length of the cube box;and N the number of cube boxes required to cover the target structure.
The calculation of the fractal dimension based on CT images is described as follows.Firstly,the target structure is extracted by threshold segmentation.Subsequently,a series of cube boxes(the side length is ε) is built to cover the target structure,and the number of cube boxes N needed to cover the target structure is recorded.As the cube box size continuously changes,the corresponding figure is recorded.Finally,a scatterplot(logN-log(1/ε))is drawn,and the least-squares are used to fit the data.At this time,the slope is the box dimension.According to these principles,the fractal dimension calculation module can be added to the result of the threshold division in the AVIZO software to obtain the 2D and 3D fractal dimensions of the coal.
3.Model construction
The primary purpose of this research is to study the seepage and deformation characteristics of different pore-fracture structures of coal at different temperatures,i.e.the effect of different pore-fracture structures on the conjugate heat transfer and deformation of coal under the same boundary conditions.Therefore,the following assumptions are made during the model construction.(1)The thermal boundary conditions and thermodynamic parameters of all coal samples are set the same.(2)The in-situ stress experienced by the model is not considered in the simulation process.
The process of establishing the following model is described below,taking the coal sample S6 as an example.
3.1.Conjugate heat transfer model
The conjugate heat transfer simulation is currently used in the fields of power engineering,building science,mechanical engineering,and so on[30-32].In this study,on the basis of the ANSYS platform[33,34],the conjugate heat transfer simulation was applied to the microscopic coal model reconstructed by CT images to achieve the coupled fluid heat transfer and solid heat transfer in coal.The ANSYS-CFX uses the latest technology to solve the heat transfer flow in 3D space,by which the built-in implicit GGI (general grid interface) algorithm can accurately simulate complex conjugate heat transfer problems such as the coupled exchange and radiative heat transfer between fluid and solid when the interface mesh does not match.In this simulation,the governing equation of fluid flow is the Navier-Stokes equation.
where μ is the dynamic viscosity;p the pressure;ρ the density;t the time;x,y,and z the axis directions;u,v,and w the velocity components;υ the velocity vector;and Su,Sv,and Swthe generalized source terms.
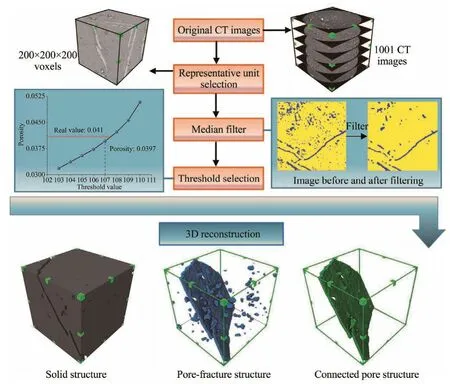
Fig.2.Flow chart of the 3D reconstruction of CT images.
The energy conservation equation that must be satisfied by a flow system with heat exchange is

where T is the temperature;k the heat transfer coefficient of the fluid;cpthe specific heat capacity;and STthe internal heat source of the fluid and the part where the mechanical energy of the fluid is converted into thermal energy due to the viscosity effect.
The steps for construction of the conjugate heat transfer model are divided into three stages,namely building a geometric model,meshing,and setting boundary conditions.
The construction and meshing of geometric model are mainly for the modeling and meshing of fluid and solid domains.(1) ScanIp software was used to select CT images and perform median filtering and threshold selection to construct 3D coal skeleton model and connect pore structure model.(2)The mesh generation for the reconstructed model was performed with a meshing type of tetrahedron,mesh size unit in mm,and wall settings (including inlet,outlet,interface,etc.).After the mesh generation and export of the mesh model,the transition of the divided mesh at the boundary and surface was relatively smooth,and the mesh quality met the analysis requirements.
The fluid domain and solid domain after meshing were imported into ANSYS-CFX for boundary condition settings separately.(1) Fluid domain settings.The connected pore-structure model,fluid medium,flow state,and heat transfer were defined as Fluid Domain,Water,Laminar,and Thermal Energy (which is used to calculate convection heat exchange and thermal conduction),respectively.Since the fluid medium is set as water,fluid compression is not considered in the model.(2) Solid domain settings.The coal skeleton model,heat transfer,and skeleton material were set as Solid Domain,Thermal Energy,and Coal,respectively.The thermodynamic parameters are shown in Table 2.(3) Fluidsolid coupling interface settings.Interface type,connection mode,heat transfer,and wall surface were set as fluid-solid,general connection,conservative interface flux,and non-slip wall,respectively.(4) Inlet-outlet and wall settings.The model pressure gradient,inlet pressure,and outlet pressure were set as 0.5,0.6,and 0.1 MPa (atmospheric pressure),respectively.The model wall surface temperature i.e.the temperature of the deeply buried coal and rock was set to 80°C,while the fluid inlet temperature i.e.the temperature of the water at room temperature was set to 20 °C.The results of meshing and the setting of boundary conditions are shown in Fig.3.
3.2.Thermal deformation model
The thermal deformation simulation of the coal skeleton under temperature load was completed by using the 3D reconstructed surface mesh model of CT images and ANSYS software.Since the calculation only needs to be performed on the solid domain,the setup is relatively simple with a high calculation rate.In this model,only the single-phase deformation of the coal skeleton is considered.Due to the extremely complex conditions for the gas or liquid inside the coal,it is difficult to extract a match with the coal skeleton by using Boolean Operations module and By Caps module in ANSYS.Therefore,the multi-phase coupled deformation between heated gas or liquid in the coal and coal skeleton is not considered in the simulation.
The development protocol of thermal deformation model for coal skeleton also includes three steps i.e.building geometric models,meshing,and setting boundary conditions.
To create a geometric model using AVIZO software,it is necessary to divide the surface mesh and export the surface mesh model in AVIZO because the reconstructed coal skeleton model cannot be directly imported into ANSYS for analysis.Subsequently,the SCDM module in ANSYS was used to convert the surface model into a solid model and check the model for repair.
As for the mesh generation,since the thermal deformation model will expand and deform in the solution process,the quality requirements for the mesh are high.The mesh module in ANSYS was used to set the meshing parameters,refine the mesh quality of the transition part and the surface structures,and simplify the mesh in the simple structures.The quality of the mesh generation was verified to meet the analysis requirements.The results of mesh generation are shown in Fig.4a.
The setting of thermal boundary condition mainly includes applying load and adding constraints,as shown in Fig.4b and c,respectively.By applying a temperature load of 100 ℃to the skeleton model,the deformation volume of the coal skeleton at 20 °C was set as 0,and the base surface of the model was set as a fixed constraint face.The thermal deformation parameters of the coal skeleton were established,as shown in Table 2.
4.Results and discussion
4.1.Structural characteristics of microscopic pore-fracture in coal
After the pore-fracture structures of six coal samples were obtained by 3D CT reconstruction technique,the connected pore structure models of six coal samples were extracted.According to the box-counting algorithm [35,36]in 3D reconstruction software AVIZO,the fractal dimension of the overall pore structures and the connected pore structures were calculated separately to describe the complexity of the microporous pore-fracture structures of coal quantitatively.
Fig.5a and b show the 3D total pore structures and 3D connected pore structures of six coal samples,respectively,as well as the parameters of the pore structures.
As shown in Fig.5,the porosity was proportional to the fractal dimension of the total pore model.With the increase of porosity,the model’s pore-fracture structures tended to be more complex,and the fractal dimension increased linearly.However,due to the concentrated data distribution of the connected pore model,this linear trend was not evident.Fig.5a showed that S3 exhibited the largest porosity and fractal dimension,so its pore-fracture volume was the largest,and the structure was the most complex.The porosity values of S1,S4,and S5 were similar,which were higher than 8.99%.Their pore-fracture structures were more complex,and their corresponding fractal dimension values were above 2.17.The porosity values of S2 and S6 were 6.70% and 3.97%,respectively,which are relatively low.The pore-fracture structures were relatively simple,and their corresponding fractal dimensions were 2.07 and 1.96,respectively.Fig.5b showed that the volume fraction of the connected pore structures model exhibitedpolarization phenomenon,that is,S3,S4,and S5 possessed large connected porosity with a value of about 6%.Their connected pore-fracture structures were more complex,with a fractal dimension of about 2.1.Therefore,their seepage performance was poor.In contrast,S1,S2,and S6 exhibited small connected porosity,all of which are below 4.1%.Their corresponding fractal dimension values were below 2.06 with a simple connected pore-fracture structure,which results in an enhanced seepage performance.

Table 2 Thermodynamic parameter setting of coal.
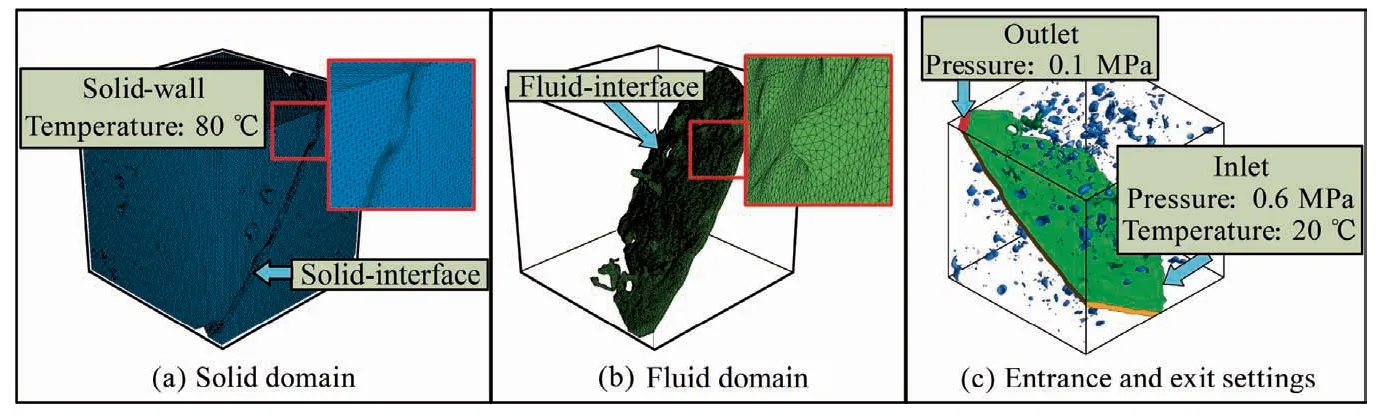
Fig.3.Conjugate heat transfer model settings.

Fig.4.Thermal deformation model settings.
To refine the study of the internal pore-fracture structures of coal,the porosity and fractal dimension values of 2D slices in each scanning coal sample were extracted from a 2D angle,which were used to further study the microporous fracture structures inside the coal sample.Fig.6a and b show the average and standard deviation of the 2D porosities and fractal dimensions of the CT slices of six coal samples,respectively,which reflect the fluctuation of each data set compared with their mean.The heterogeneity of the porefracture structures can be roughly evaluated according to the changes in the porosities and fractal dimensions between the different slices.The 2D average porosity and fractal dimension of S3 are the largest with a relatively large standard deviation.Therefore,their structure difference between different slices of S3 is large,and the seepage performance is poor.The 2D porosity and fractal dimension values of S1 and S5 are insignificantly different from those of S3,but the standard deviation of S1 is less than that of S3 and S5,so the heterogeneity of S1 is lower than that of S3 and S5.In the case of S4,the standard deviation of 2D slice porosity and fractal dimension value are the largest,indicating that the difference between the pore-fracture structures of different slices is the largest with the highest heterogeneity,leading to a poor seepage performance.In contrast,the 2D average porosity and fractal dimension of S6 are the smallest with the smallest standard deviation.Since the difference between the pore-fracture structures in different slices is low,the seepage performance is better.The average porosity and fractal dimension of S2 are slightly higher than those of S6,and the standard deviation is also higher than that of S6,indicating that the heterogeneity of S2 is higher than that of S6.Therefore,it can be concluded that the seepage performances of S6,S2,and S1 are optimal while the seepage performances of S5,S3,and S4 are poor.The results of the analysis are consistent with the results shown in Fig.5b.In addition,from Fig.6a and b,it can be seen that the changes in the 2D average porosity and fractal dimension of the coal samples show an approximate trend.Consequently,the porosity and fractal dimension values of each slice in each coal sample were extracted to study their relationship,as shown in Fig.6c.In Fig.6c,the 2D porosities and fractal dimensions in each coal sample show a linear relationship with a correlation coefficient higher than 0.80.
From the above analysis,it can be concluded that the porosity and fractal dimension show a positive correlation under CT scanning observation.Since the six samples selected in this study are all low-rank coal,and the structural characteristics of different coal rank vary significantly,this conclusion may not apply to all coal rank.
4.2.Seepage characteristics of coal at high temperature
Fig.7 shows the conjugate heat transfer simulation results of the six coal samples,including fluid temperature nephograms,velocity streamline diagrams,and cross-section temperature distribution diagrams.In Fig.7,the left plane is the fluid temperature nephograms,the middle plane is the velocity streamline diagrams,and the right plane is the cross-section temperature distribution diagrams at 2 × 10⁻⁵m away from inlet.The distribution of fluid temperature showed a high temperature in the periphery,but a low temperature in the center,in which the fluid outlet temperature was higher than the inlet temperature.The fluid velocity gradually increased from the inlet to the outlet.When the flow channel became narrow,the streamlines were dense with the high flow velocity.The cross-section temperature distribution diagrams show that the temperature gradually decreased toward the fluid center along the cross-section boundary,and the fluid was gradually heated toward the center along the periphery.At this time,the heat transfer in the solid was heat conduction while the heat transfer was convective heat transfer at the fluid-solid interface.
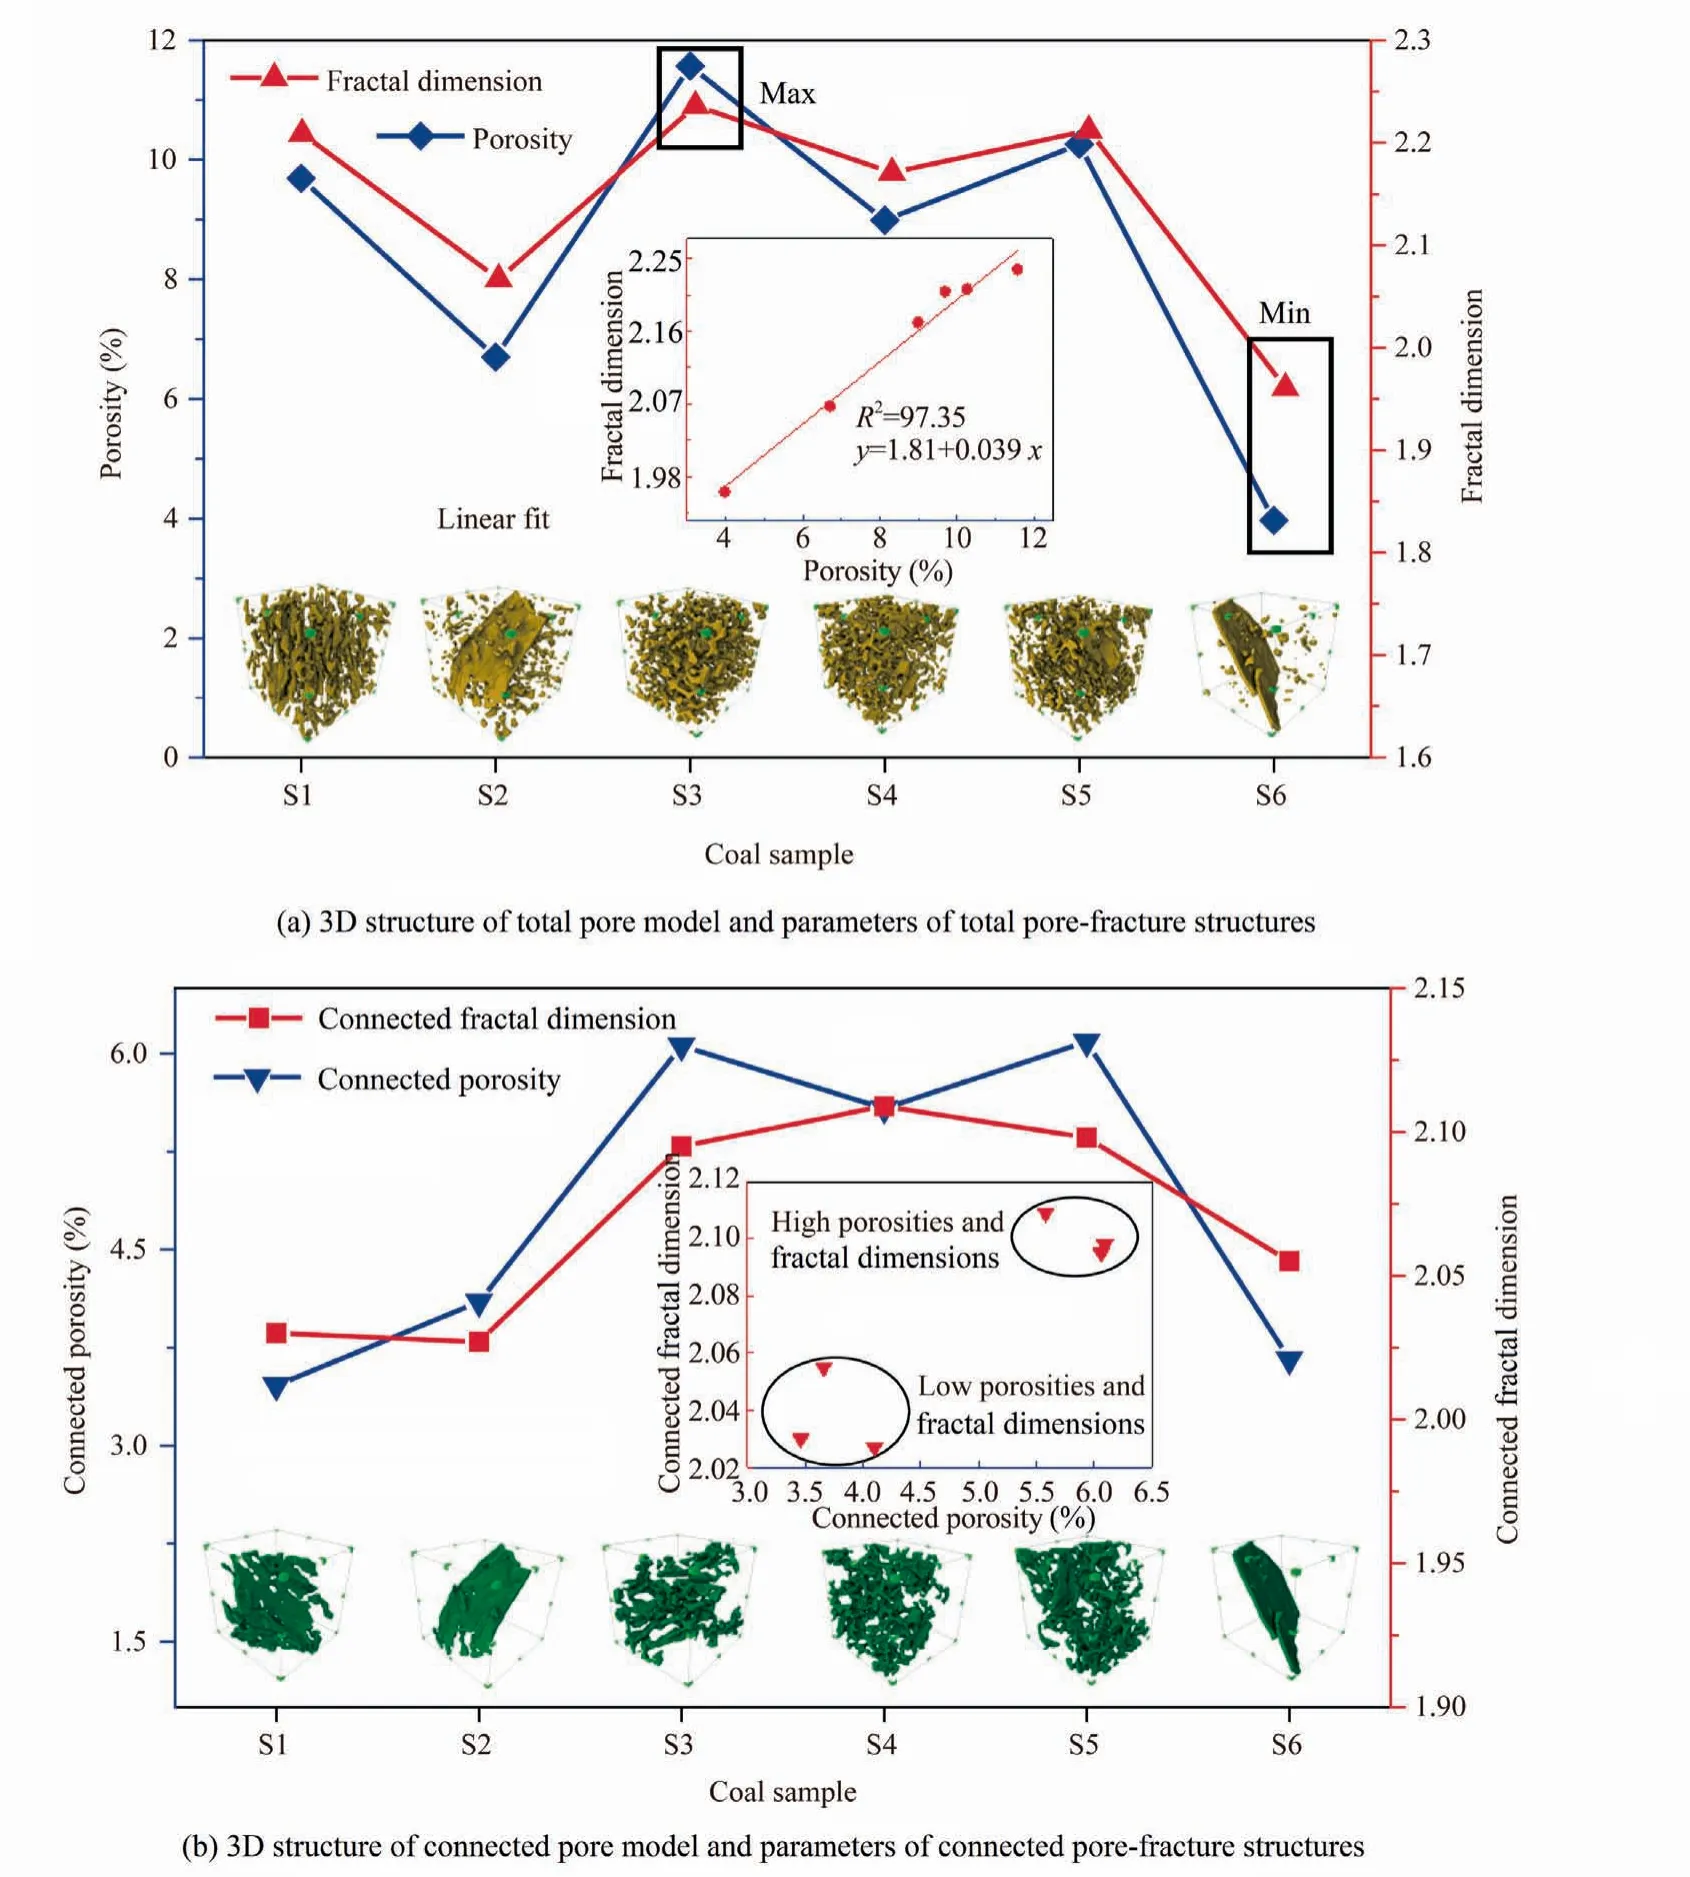
Fig.5.Porosities and fractal dimensions of total pore model and connected pore model of coal samples.
To describe the distribution of fluid velocity and temperature accurately in the process of conjugate heat transfer,five sections were equally spaced along the direction of fluid flow to study the flow and heat transfer parameters change within the coal.The change of section parameters is shown in Fig.8.The fluid velocity and temperature gradually increased from the inlet to the outlet.The tendency of the temperature increases near the outlet decreased,and the temperature reached the maximum at the outlet.Therefore,the temperature difference between the solid and the fluid gradually reduced from the inlet to the outlet,accompanied by a gradual decrease in the heat transfer rate.At the same time,the pore-fracture structures in each model were different,which results in different trends in velocity and temperature.Among them,the porefracture structures of S4 and S5 were more complicated,and their internal fluid velocities were the lowest,in which the velocity was less than 0.4 m/s during the whole flow process.In contrast,the fluid temperatures corresponding to S4 and S5 were the highest,and the temperature reached 350 K at cross-section 2.This result is mainly attributed to the extremely complicated pore-fracture structures,poor connectivity,high fluid flow resistance,and low velocity,by which the coal skeleton can have sufficient time to heat the fluid.The velocity of S3 was slightly higher than that of S4 and S5 with a velocity of 0.69 m/s at the outlet.The corresponding section temperature of S3 was also lower than that of S4 and S5 with a maximum of 345.10 K at the outlet.The fluid velocities of the remaining three coal samples were high but significantly different.The cross-sectional velocity is generally in the order of S2 > S6 > S1,whereas the fluid temperature is typically in the order of S2 <S6 <S1.Therefore,the fluid temperature in the model has an evident relationship with the fluid velocity.In the direction of the fluid flow,the fluid temperature and the fluid velocity exhibit the opposite trend.In other words,the fast fluid velocity in the model corresponds to a short fluid heating time,a low fluid temperature,and a moderate temperature increasing rate (S1,S2,and S6).Conversely,if the fluid velocity is slow,the fluid is fully heated,which results in high fluid temperature and a fast temperature increasing rate (S3,S4,and S5).
The difference in pore-fracture structures impacts the heat transfer and seepage in the coal.Therefore,the model’s porosity and fractal dimension were used to analyze the water velocity and temperature change.According to the absolute permeability calculation formula (Eq.(4)),since the values of μ,L,and ΔP are constant in the simulation,the permeability is directly proportional to the ratio of the mass flow rate and the outlet area(i.e.the exit speed).Consequently,the outlet velocity can be used to characterize the model permeability.
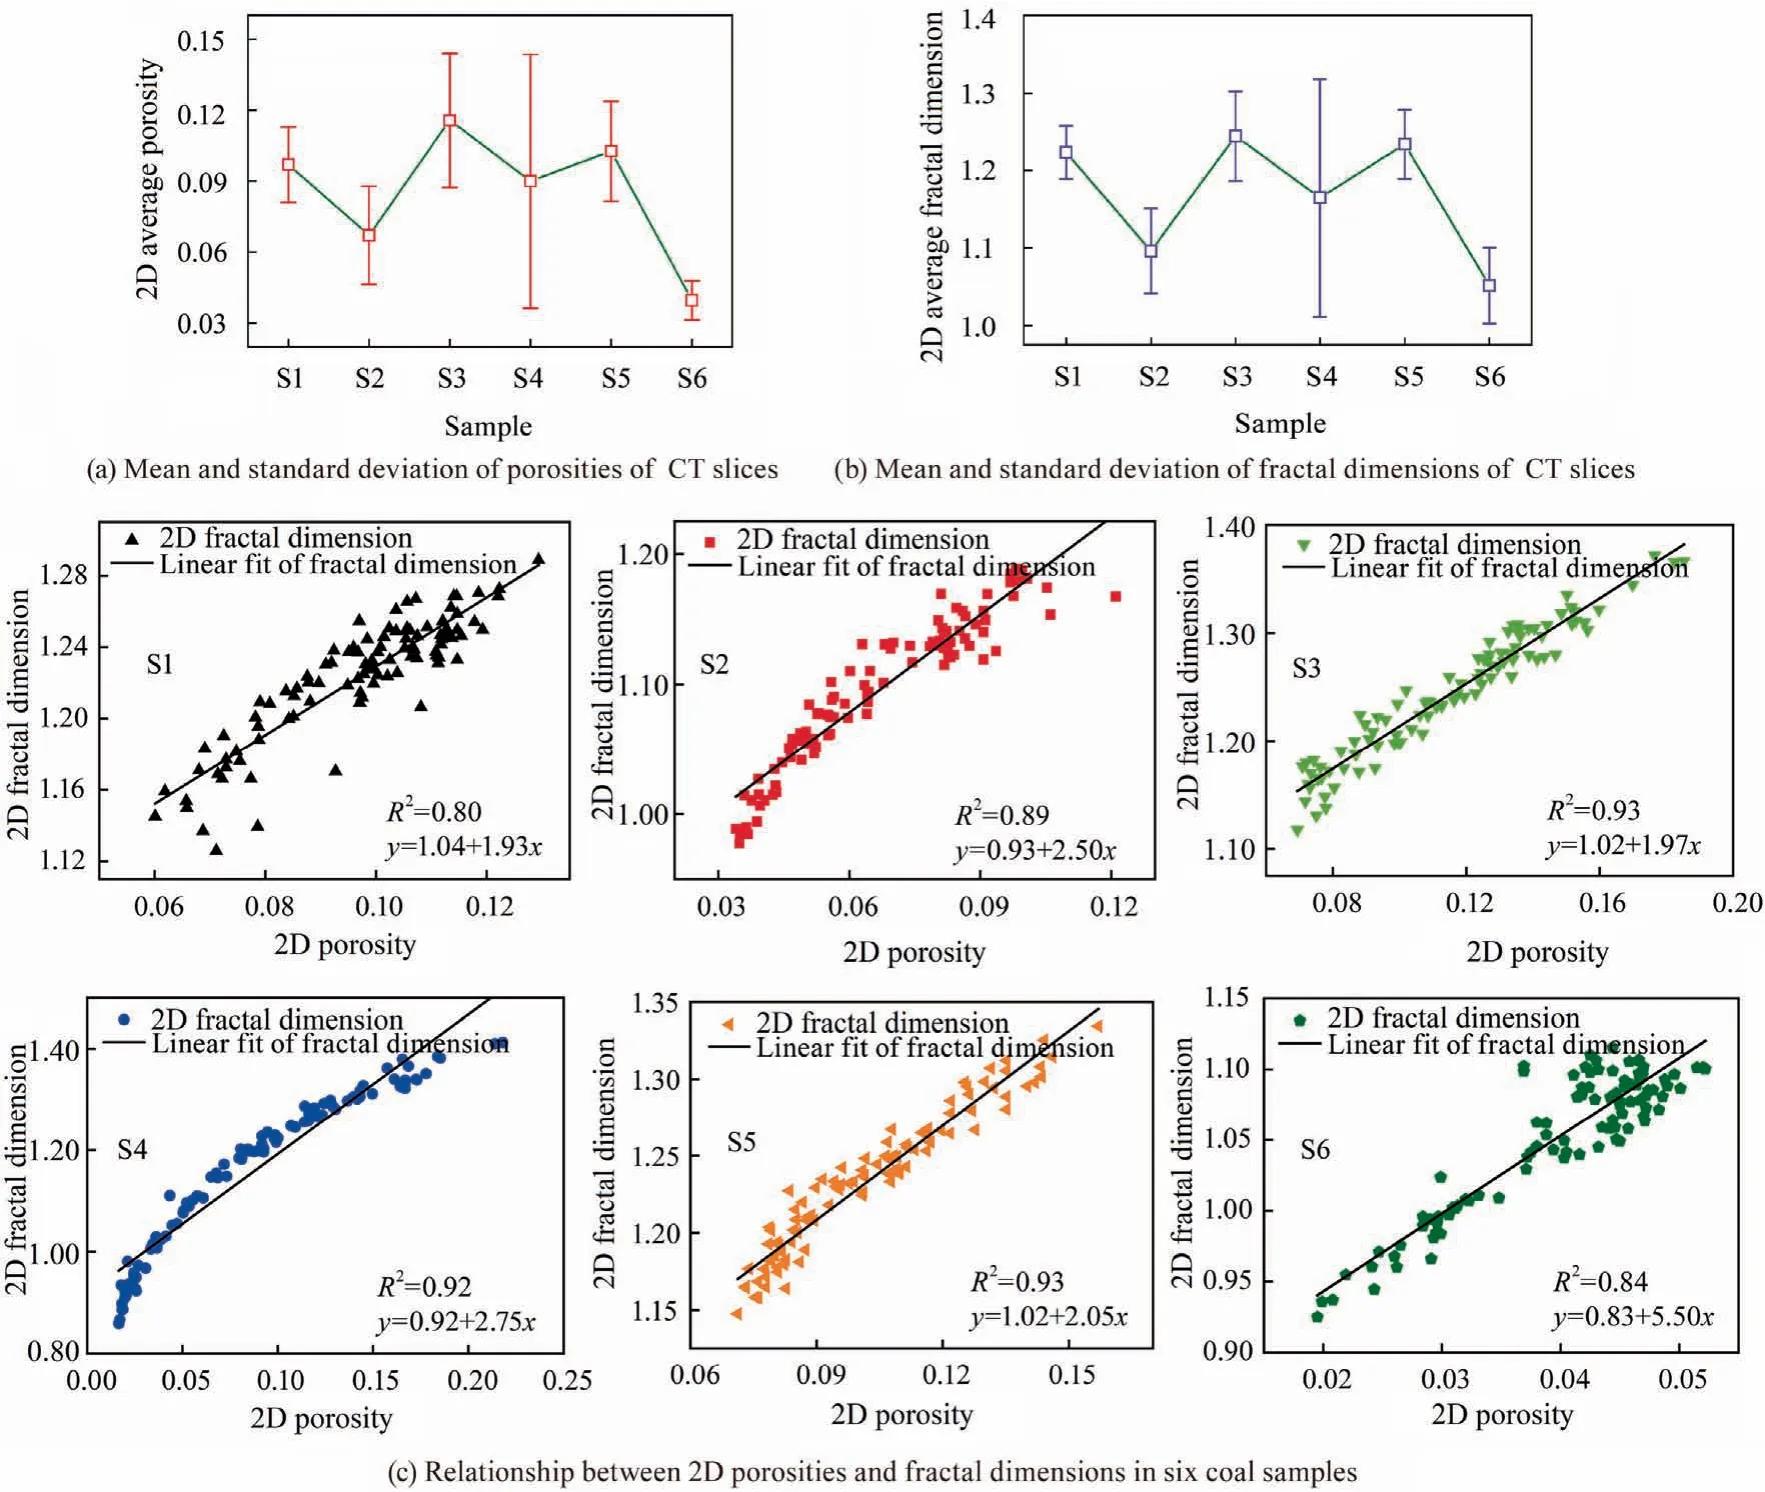
Fig.6.2D porosities and fractal dimensions of the six coal samples.

where Q is the volume flow rate in m3/s;A the outlet area in m2;L the vertical distance between fluid inlet and outlet in m;ΔP the inlet and outlet pressure difference in Pa;μ the dynamic viscosity in Pa·s;and K the absolute permeability in m2.
Fig.9a shows the relationship between porosity and fractal dimension and outlet velocity(outlet velocity can characterize permeability).Evidently,the porosity and the fractal dimension exhibited a positive linear correlation,while the porosity and the permeability displayed a negative correlation.According to the analysis of Figs.5 and 6 in Section 4.1,it can be inferred that the structure of the model is simple at low porosity,and the fractal dimension is small,implying a low flow resistance.Therefore,the outlet velocity is fast,and the model has high permeability.With the increase of porosity,the structure becomes complex,and the fractal dimension increases,which leads to an increase in fluid flow resistance and a decrease in permeability.Fig.9b shows the relationship between outlet velocity and outlet temperature.As the outlet velocity increases,the outlet temperature shows a decreasing trend,mainly due to the slow water flow rate in the coal with lower permeability,in which the coal skeleton can fully heat the fluid.However,at the last data point(S6),there is an upward trend.In Fig.5b,according to the minimum porosity of S6 with a large heated area and a small volume of heated fluid,it can be concluded that the outlet temperature may increase.
4.3.Thermal deformation characteristics of different coal pore-fracture structures
At a constant temperature,the deformation of the coal caused by heating is mainly controlled by its internal pore-fracture structures.Since the deformation varies with different porefracture structures,this study integrates the pore-fracture structure parameters to analyze the coal’s thermal deformation characteristics.Fig.10 shows the thermal deformation simulation results of six coal samples under the temperature load of 100°C.The average deformation of the model is in the range of 10.6-12.1 nm,with a maximum deformation of 21.14-22.95 nm.The deformation of the model generally shows a similar trend.From a longitudinal perspective,the greater the distance from the constraint surface,the greater the amount of deformation.From the lateral aspect,the model deformation shows an insignificant deformation in the middle and a large deformation on both sides.In addition,according to the position of the node corresponding to the maximum deformation of the models,it can be found that these nodes are located on the top surface of the model and the apex of the developed porefracture structures.This is because the top surface of the model is farther away from the constraining surface,and the constraining force near the large pore-fracture structures after being heated is weak.The developed pore-fracture structures provide sufficient space for thermal expansion and deformation of the coal body.In particular,there are large connected fractures in both S2 and S6 models,and the maximum deformations of both models are higher than those of other models.The maximum deformation nodes are located near the fractures.Their maximum deformations are 21.54 and 22.95 nm,respectively.The model deformation is large near the fractures but small on the side where the pore-fracture structures are not developed.

Fig.7.Simulation results of conjugate heat transfer (inlet at the bottom,outlet at the top).
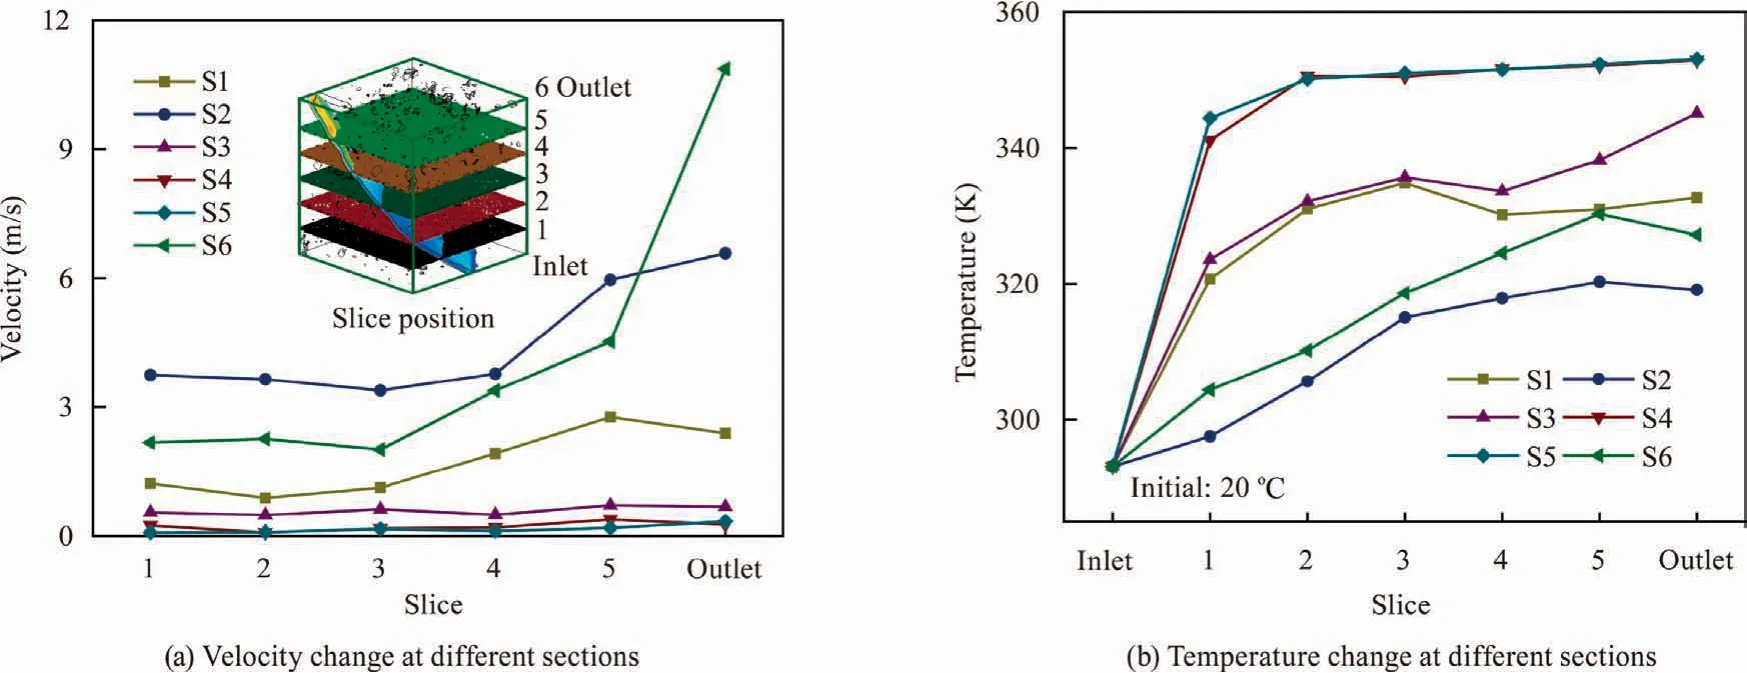
Fig.8.Variation of velocity and temperature along the direction of fluid flow.

Fig.9.Relationship between structural parameters of pore-fracture,outlet velocity,and outlet temperature.

Fig.10.Simulation results of thermal deformation of the six coal samples.
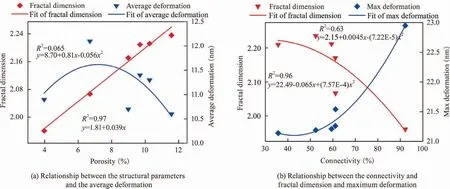
Fig.11.Relationship between structural parameters of pore-fracture and thermal deformation.
In order to study the thermal deformation characteristics of different pore-fracture structures of coal,the relationship between porosity and fractal dimension and average deformation was plotted,as shown in Fig.11a.The variation trend of porosity and fractal dimension versus the average deformation amount exhibited an initial increase and subsequent decrease.When the porosity and fractal dimension were small,the pore-fracture structures were simple,but the pore volume was small,which restricts the space deformation of the coal skeleton and results in a small amount of deformation.With the increase of porosity and fractal dimension,the pore volume gradually increased,and the pore-fracture structures were not complicated at this time,which increases the average deformation.With the further increase of the porosity and fractal dimension,the structures of pore-fracture turned to be complicated,and the heterogeneity of the structures became more intense,resulting in a downward trend of the average deformation amount.
Furthermore,through analysis of Fig.10,it was found that the maximum deformation amounts of S2 and S6 were located near the connected fractures,and the maximum deformation amounts were larger than those of the other four models.According to Fig.5a and b,the porosity of S2 and S6 models was low,but their pore-fracture structures were relatively simple with optimal connectivity.Therefore,considering that the connectivity of the model(model connectivity is defined as the ratio of connected pore volume to total pore volume [37]) has a certain relationship with the fractal dimension and the maximum deformation,as well as the relationship between the connectivity and fractal dimension and the maximum deformation of the models in Fig.11b,it can be concluded that the connectivity has a negative correlation with the fractal dimension and a positive correlation with the maximum deformation.In other words,with the increase of connectivity of the model,the fractal dimension decreases,and pore-fracture structures tend to be simple,which result in increased deformation of the model at high temperatures.
5.Conclusion
In this paper,the conjugate heat transfer model and the thermal deformation model were constructed based on the 3D reconstruction of CT images.Furthermore,the structural characteristics of the coal were analyzed from 2D and 3D perspectives.Combined with parameters of pore-fracture structures,the seepage and deformation characteristics of coal at high temperature were studied.The conclusions of this study are as follow.
(1) The pore-fracture structures of the six models were analyzed from 2D and 3D perspectives.It was found that the porosity and fractal dimensions exhibited a positive correlation from the 2D and 3D perspectives.The pore structures of S3,S4,and S5 were complicated,with poor connectivity and seepage performance.In contrast,the pore structures of S1,S2,and S6 were relatively simple with relatively optimal connectivity and seepage performance.
(2) The conjugate heat transfer simulation showed that the fluid velocity and temperature gradually increased from the inlet to the outlet.The slower the flow velocity in the model,the higher the fluid temperature.The porosity and fractal dimension of the model negatively correlated with the permeability.The permeability had a negative correlation with the outlet temperature,but the outlet temperature would increase in low porosity coal.
(3) The thermal deformation simulation of the coal skeleton showed that the average deformation of the six models was in the range of 10.6-12.1 nm with a maximum deformation of 21.14-22.95 nm after the temperature load of 100°C.Large deformation occurred in the area where the porefracture structures well developed.With the increasing porosity and fractal dimension,the average deformation of the model exhibited a trend of increasing first and then decreasing.The maximum deformation significantly correlated with the connectivity of the model.As the connectivity of the model increased,the fractal dimension decreased,and the maximum deformation of the model increased.
The above conclusions are based on the 3D CT reconstruction,and the CT observation method is limited by the observation scale and coal sample size.In future research,different observation methods and experimental methods (NMR,acoustic emission,etc.)can be integrated to study the seepage and deformation characteristics of coal at different temperatures.
Acknowledgements
This work was supported by the National Natural Science Foundation of China(Project Nos.51934004,51674158,51574158,and 51474106),the Major Program of Shandong Province Natural Science Foundation (ZR2018ZA0602),the Taishan Scholar Talent Team Support Plan for Advantaged &Unique Discipline Areas,the Science and technology support plan for Youth Innovation of colleges and universities in Shandong Province (2019KJH006),and the special funds for Taishan scholar project (TS20190935).
杂志排行
矿业科学技术学报的其它文章
- Evaluation of the use of sublevel open stoping in the mining of moderately dipping medium-thick orebodies
- Stability control of gob-side entry retained under the gob with close distance coal seams
- A novel coating technology for fast sealing of air leakage in underground coal mines
- A robust approach to identify roof bolts in 3D point cloud data captured from a mobile laser scanner
- Physical model test and numerical simulation on the failure mechanism of the roadway in layered soft rocks
- Deformation response of roof in solid backfilling coal mining based on viscoelastic properties of waste gangue