Computational lntelligence Prediction Model lntegrating Empirical Mode Decomposition,Principal Component Analysis, and Weighted k-Nearest Neighbor
2021-01-23LiTangHePingPanYiYongYao
Li Tang | He-Ping Pan | Yi-Yong Yao
Abstract—On the basis of machine leaning, suitable algorithms can make advanced time series analysis.This paper proposes a complex k-nearest neighbor (KNN) model for predicting financial time series.This model uses a complex feature extraction process integrating a forward rolling empirical mode decomposition (EMD) for financial time series signal analysis and principal component analysis (PCA) for the dimension reduction.The information-rich features are extracted then input to a weighted KNN classifier where the features are weighted with PCA loading.Finally, prediction is generated via regression on the selected nearest neighbors.The structure of the model as a whole is original.The test results on real historical data sets confirm the effectiveness of the models for predicting the Chinese stock index, an individual stock, and the EUR/USD exchange rate.
1.lntroduction
Time series analysis, especially financial time series analysis, has attracted serious attention of financial and cross-disciplinary researchers.By analyzing and predicting financial time series, the essential information and features of market can be found for supporting the financial activities and decision-making, which has very important practical significance.There are a lot of literature research on the methods of economic prediction,including typical ones: Autoregressive integrated moving average (ARIMA) models[1],[2], autoregressive conditional heteroscedasticity (ARCH) models[3],[4], generalized autoregressive conditional heteroscedasticity (GARCH)models[5]-[7], chaos-theoretical models[8],[9], neural network models[10],[11], support vector machine (SVM) models[12],[13],andk-nearest neighbor (KNN) models[14],[15].
Although these computational intelligence models are equivalent, it has turned out that the feature extraction for generating essential information from original data as input is a foremost key challenge to prediction.Actually, the feature extraction problem is equivalent to signal processing.Therefore, the techniques in signal representation can be applied for the feature extraction of financial time series.The empirical mode decomposition (EMD)[16]is widely used for signal decomposition, even in financial prediction[15],[17],[18].It has been demonstrated that EMD is an effective algorithm for dealing with nonlinear and non-stationary time series.But most of the researches have not considered the stability of decomposition near the end.The forward rolling EMD[19]extracts the most recent data using a sliding window can tackle this problem.It should be noted that the high-dimension output of EMD as the input of prediction can make the model unstable usually.Thus, there should be a dimensionality reduction.The principal component analysis (PCA)[20]maps the original high-dimensional data set to low-dimensional space and transforms it to a set of principal components, which can reduce data dimensionality effectively[21].For prediction modeling, KNN[22]is a classical nonparametric algorithm.Generally, a simple mean ofk-nearest neighbors are used[23].However, the simple mean can not reflect the amount of information from KNN synthetically.In order to tackle this problem, we propose a new weighted KNN classifier with more comprehensive information as input and more reasonable classify algorithms for modeling the prediction of financial time series.
Along the direction of signal decomposition, feature extraction, and prediction modeling, this paper proposes a computational intelligence prediction model for financial time series.This model applies a complex feature extraction process integrating the forward rolling EMD for financial time series signal decomposition and PCA for the dimension reduction.The information-rich features extracted by this process are input to a weighted KNN classifier with PCA loading as weights and transformed into prediction via regression on the selectedk-nearest neighbors.Therefore, this model can be called as a financial time series EMD-PCA-weighted KNN (FEPK) model.
2.FEPK Prediction Model
2.1.Framework of FEPK Prediction Model
As a computational intelligence prediction model, FEPK needs to learn from a historical data set.Generally, we should define a time frame of the historical series first.This paper only focus on daily time frame, thus assume that the historical daily time series long enough exists.The financial price time seriesX(t) of time periodtconsists of the open priceO(t), high priceH(t), low priceL(t), close priceC(t), and volumeV(t).In this paper,X(t) meansC(t)which is the only consideration, and others will be considered in future work.
In general, we apply a sliding window to intercept the historical financial time series DX(t,N) long enough

wheretis the most recent time,Nis the total number of days, andw<<Nis the width of a sliding window,thus DX(t,N) also can be expressed as DX(t,w).For anyX(t), define a relative return as

whereλis the prediction step length with a basic value ofλ=1, thus useR(t) forR(t,λ) without any other specification in this paper.Correspondingly, a relative return data set can be expressed as

Therefore, we can define a general FEPK prediction model as

wherekis the number of KNN and PCA*denotes the feature extraction process with PCA.
2.2.Nonlinear Feature Extraction Procedure Using EMD and PCA
An FEPK prediction model contains a complex nonlinear feature extraction process, integrating the forward rolling EMD and PCA.The forward rolling EMD, which uses a sliding window with EMD, is applied specially for financial time series signal analysis because it can satisfy the real-time requirement and tackle the end effect of EMD[19], which is called FtsEMD.
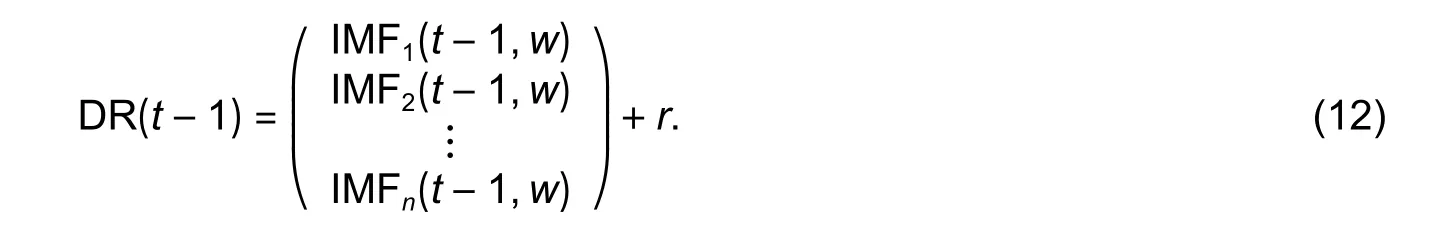
For training an FEPK model, the historical relative return data set DR(i−1,N), wherei=t,t−1,…,t−(N−w)+1 as the input should be decomposed by FtsEMD with a sliding window, andR(i),wherei=t,t−1,…,t−(N−w)+1 is the output.Thus an input-output data set as
It should note that multilevel intrinsic mode functions (IMFs) are obtained by EMD.According to the definition of IMF[16], IMF should satisfy two criteria: 1) In whole time series, the number of zero-crossing points and that of extrema are equal or differ at most one; 2) for any time period, the mean of the upper envelope formed by local maxima and the lower envelope formed by local minima is zero.
A process of EMD for details can be described as follows (e.g.EMD of DR(t−1)):
1) Find all the local extrema of DR(t−1), including the minima and maxima.
2) Use cubic spline to form a lower envelope le(t−1) with the minima and an upper envelope ue(t−1) with the maxima, while calculating their mean value

3) Calculate the details of decomposition

wherei=1,2,… denotes theidecomposition.Wheni=1,dr(t−1)=DR(t−1).
The steps 1) to 3) constitute one sifting process.
4) Check whetherhi(t−1) is IMF:
i) If it is true,hi(t−1) is IMF andr(t−1) is the residual, then
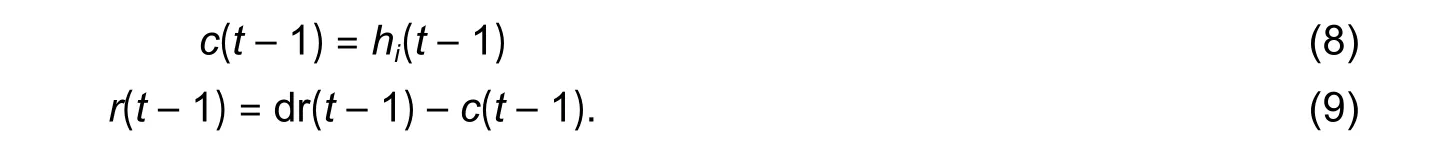
Then, let dr(t−1)=r(t−1) and go through the next sifting process.
ii) If it is not true, let dr(t−1)=hi(t−1) and go through the next sifting process.
The main meaning of IMF is to define an instantaneous frequency.In order to ensure a sufficient physical significance of the instantaneous frequency, [16] defines a metric called SD for stopping sifting:
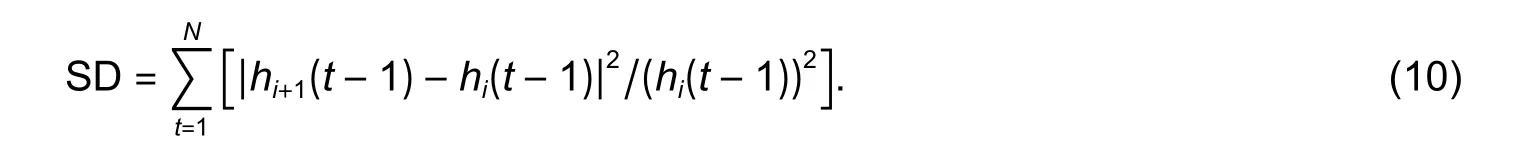
When the value of SD is between 0.2 and 0.3, stop the sifting process.Meanwhile, if the extrema ofr(t−1) is less than 2, stop sifting and return all the results of iterations as
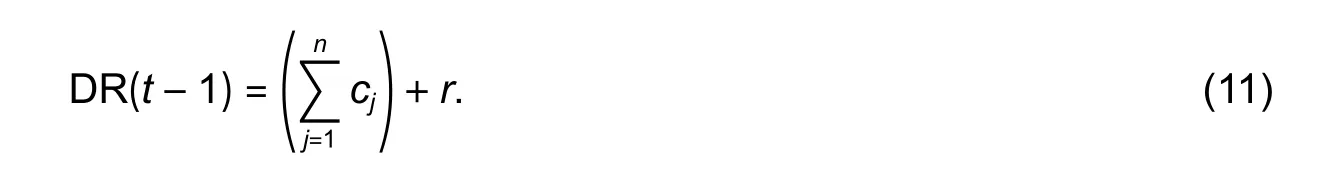
It also can be expressed as
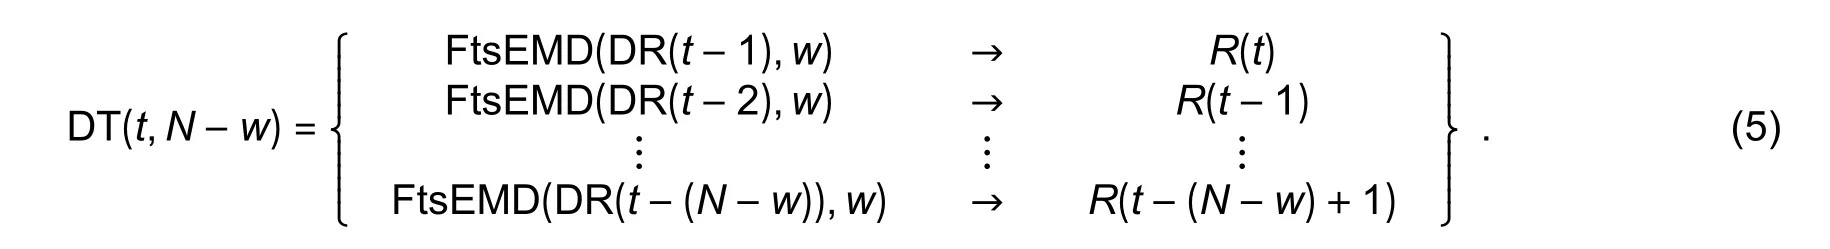
The original data set has been decomposed intonmultilevel IMFs (usually, letn≤5) and one residualr, thus rewrite (5) as
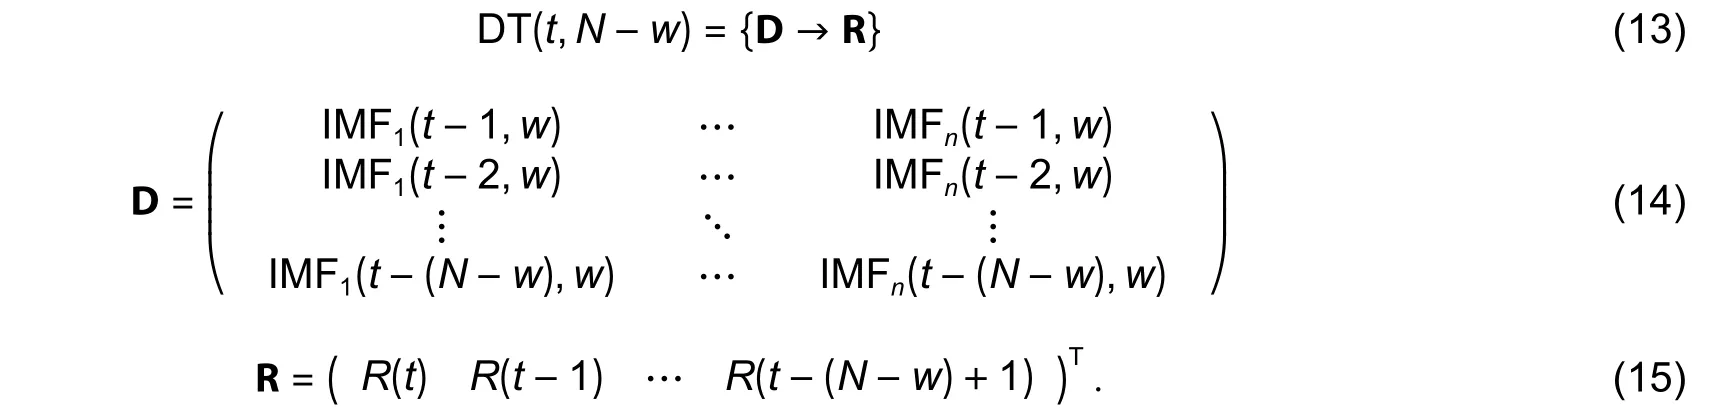
Note each row of matrix D is composed of IMF time series, and it is a high-dimensional vector with redundancy information.Thus, we can apply PCA for the dimension reduction and feature extraction with rich-information.
PCA transforms the high-dimension data to a set of principal components which are arranged according to their variance contribution rates from large to small.The first principal component is the most able to reflect the original data information and the others decline in turn.From the view of mathematical representation, PCA is a kind of orthogonal linear transformation to generate principal components which are usually expressed as the linear combination of the original variables.Actually, PCA means the singular value decomposition.
First, matrix D should be normalized to matrix Z and then do the singular value decomposition of matrix Z
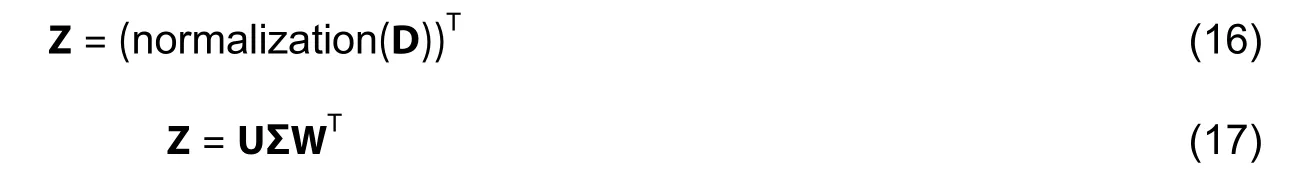
where U and W are eigenvector matrices of ZZTand ZTZ, respectively, and both of them are orthogonal matrices; Σ is a nonnegative rectangular diagonal matrix with a diagonal matrix comprising the eigenvaluesσi(i=1,2,…,r) of ZZTin the left part.Therefore, we can obtain a transformed matrix by

where each column of matrix Y consists of each principal component in turn.
Practically, the information of matrix Z is mainly concentrated on the firstp<<rprincipal components.However, how to find the value ofp? An effective way is to apply the cumulative contribution rate (CCR).In general, CCR is required to be more than a threshold (such as 85%)

whereσi(i=1,2,…,p) is also the variance contribution rate (VCR) corresponding to each principal component

Correspondingly, a low-dimensional matrix Upof U and matrix Ypare obtained

where Ypis a low-dimensional matrix.
The information-rich features comprise matrix Ypand VCRi(i=1,2,…,p) should be then input to a weighted KNN classifier.
2.3.New KNN Classifier with PCA Loading as Weights
As a classical nonparametric algorithm, KNN can match the most similark-nearest neighbors by the historical data set itself for prediction.In this paper, we propose a new KNN classifier with PCA loading as weights to generate the prediction via regression on the selected nearest neighbors.
We assumex(t+λ)=DR(t+λ,N) is the point that should be predicted.Letx(t)=DR(tλ,N), matrix Ypand VCRi(i=1,2,…,p) are the input of KNN, thus we can generate a prediction model as

Calculate the similarity betweenx(t) and any samplexi(i=1,2,…,p) in matrix Yp

In this paper, the Euclidian measure is used as a similarity metric and anyone special for financial time series may be used in our future work.Sort all values ofSto find the firstk-largest values and the most similar KNNxj(j=1,2,…,k(k<p)).
Note that the new KNN classifier generates the prediction with PCA loading as weights, thus the VCRj(j=1,2,…,k(k<p)) corresponding tok-nearest principal components should be selected to be the weight coefficients.Then we can generate the prediction via regression on the selectedk-nearest neighbors as
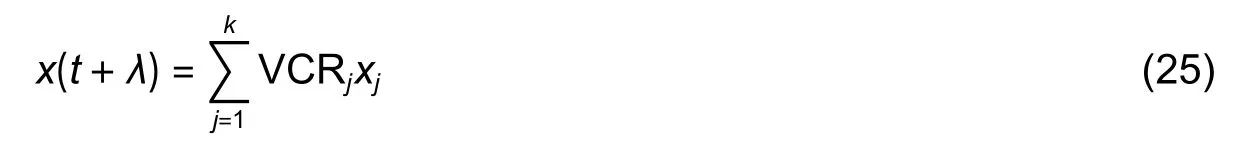
wherex(t+λ)=DR(t+λ,N).According to (3), the predictionR(t+λ) can be obtained.
2.4.Key Parameters of FEPK Prediction Model
According to (4), a specific FEPK prediction model is determined by three key parameters: 1)λis the step length of prediction, 2)wis the width of a sliding window in FtsEMD, and 3)kis thek-nearest neighbors for prediction.
3.Empirical Test of FEPK Models
3.1.Performance Metrics of Specific FEPK Prediction Models
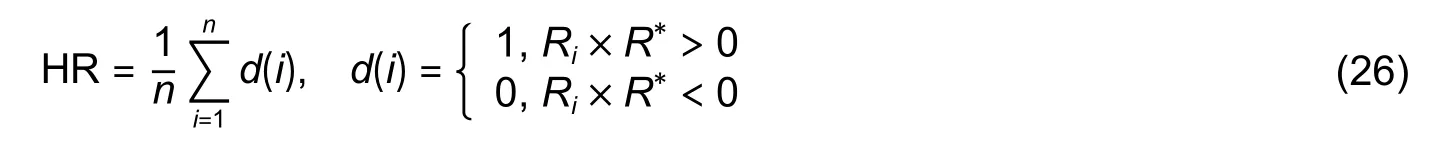
The direction of market trend implies the key information, thus it is the most important for market risk management and investment trading strategies.We should first predict the direction of the market trend and then the range of rise and fall which is affected by the information that appears during the day.Therefore, we use a metric called hit rate (HR)[24]which just measures the accuracy of the prediction direction in this paper.Naturally, in our future research with comprehensive information as input, we will focus on predicting the range of rise and fall which should be also evaluated by other indicators (such as the mean absolute percentage error (MAPE), root mean square error (RMSE), mean absolute difference (MAD), and the sharp ratio).whereRiis the real value of the relative return,R∗is the predicted value, andnis the total number of samples.
3.2.Three Specific FEPK Models and Test
In order to test the FEPK prediction models on real financial time series, three specific FEPK prediction models are constructed:
1) FEPK_HS300_D1 for thet+1 daily return of the HS300 index prediction

2) FEPK_yonyou_D1 for thet+1 daily return of the individual stock-yonyou (600588.SH) prediction

3) FEPK_EURUSD_D1 for thet+1 daily return of the EUR/USD exchange rate prediction

The historical date sets on HS300 and yonyou(600588.SH), which span over the period of 4 January 2007 to 28 July 2017 consisting of 2571 trading days,are used for FEPK_HS300_D1 and FEPK_yonyou_D1 model training and testing.And the historical date sets on the EUR/USD exchange rate, which spans over the period of 2 January 2007 to 24 November 2017 consisting of 2830 trading days, are used for FEPK_EURUSD_D1 model training and testing.The data sets are all divided into two parts, the earlier 80%data for in-sample training and later 20% data for outof-sample testing.In terms HR, Table 1 shows the testing result of FEPK_HS300_D1.Its best HR is 0.754(75.4%) withw=100 andk=7.Table 2 shows the testing result of FEPK_yonyou_D1.Its best HR is 0.741(74.1%) withw=150 andk=2.Table 3 shows the testing result of FEPK_EURUSD_D1.This model achieves the best HR of 0.742 (74.2%) withw=300 andk=6.Thus it can be said that the FEPK models are effective prediction models for predicting thet+1 daily return of HS300, an individual stock, and EUR/USD exchange rate.
3.3.Comparison with EMD-KNN and KNN Prediction Models
FEPK models are compared with other six EMDKNN and KNN models, including:
1) EMD-KNN_HS300_D1

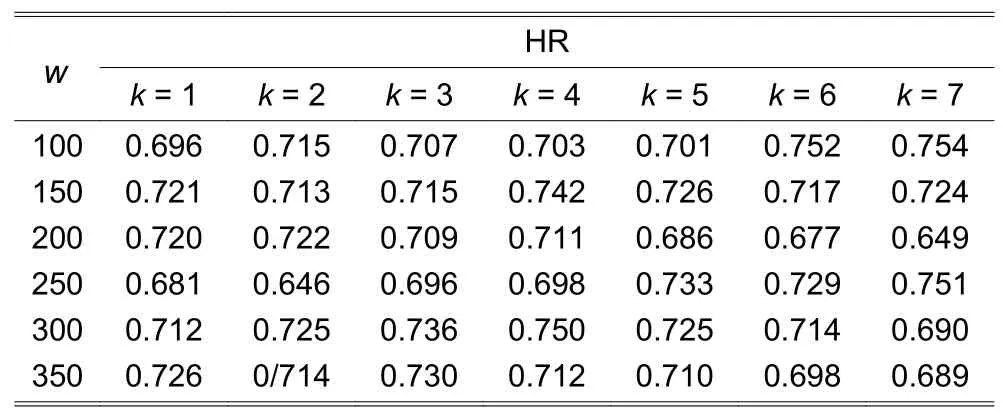
Table 1:Performance of FEPK_HS300_D1 with different w and k
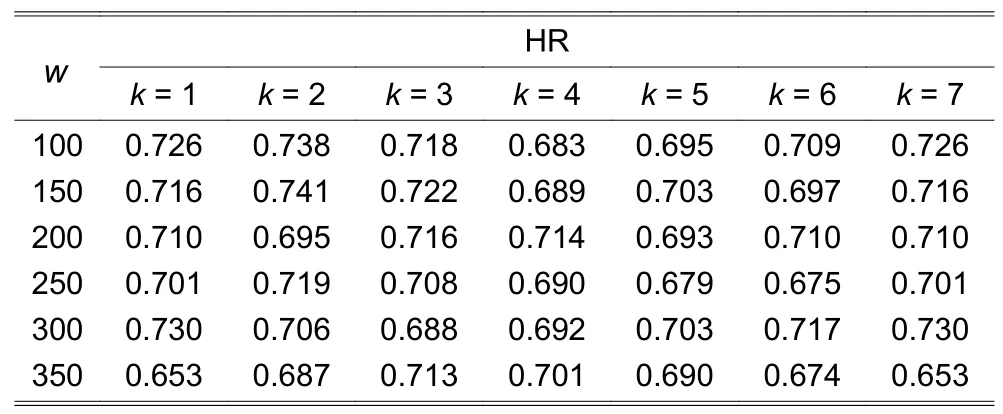
Table 2:Performance of FEPK_yonyou_D1 with different w and k
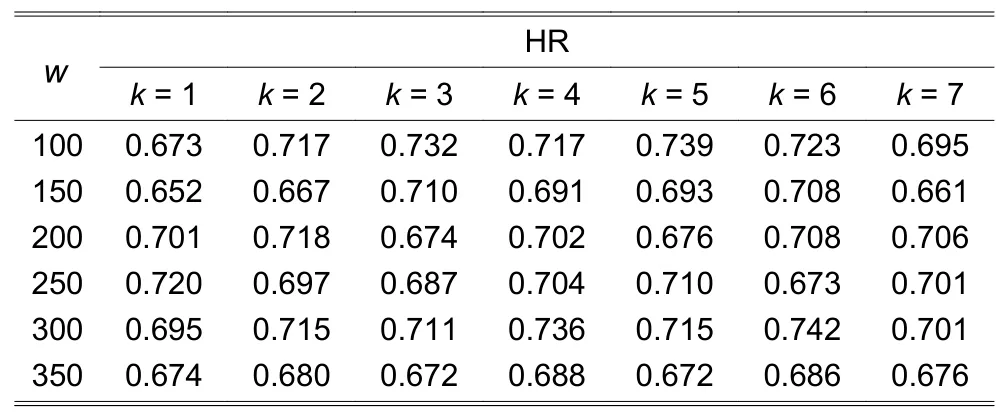
Table 3:Performance of FEPK_EURUSD_D1 with different w and k
2) EMD-KNN_yonyou_D1

3) EMD-KNN_EURUSD_D1

4) KNN_HS300_D1

5) KNN_yonyou_D1

6) KNN_EURUSD_D1

These six models are trained and tested in the same data sets and ways as the FEPK models.The best HR of each model is chosen for comparison as shown in Table 4.In terms of HR, the FEPK models perform the best, and the EMD-KNN models perform better than the KNN models.The comparison result implies IMFs generated by FtsEMD can reflect the data features effectively, the principal components obtained by PCA are information-rich, and they can improve the performance of the KNN prediction.
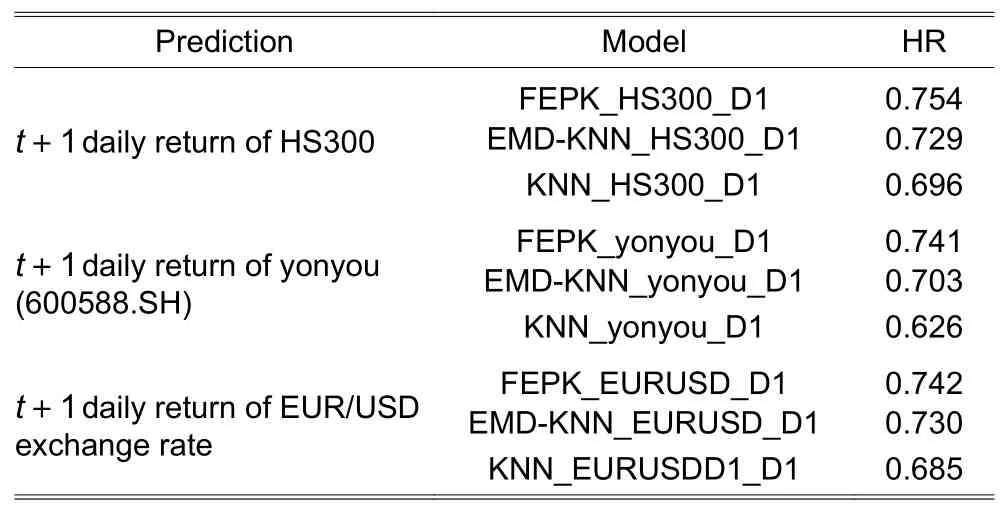
Table 4:Hit rate comparison of FEPK models with EMDKNN models and KNN models
4.Conclusions
In this paper, we have proposed a computational intelligence prediction model, integrating the forward rolling EMD with a sliding window for the financial time series decomposition, PCA for the dimension reduction, and a weighted KNN for the prediction.In general, the structure of this model is original, with more comprehensive information as input and more reasonable classify algorithms than the original KNN.The feature extraction process integrating FtsEMD and PCA is an advanced special extraction method for financial time series signal analysis,which has the adaptability, comprehensiveness, and orthogonality of feature extraction.Moreover, a weighted KNN with PCA loading as weights is more reasonable and has a better effect on classifying than the simple KNN, thus it has better prediction performance.
The specific FEPK models are implemented and tested for predicting thet+1 daily return of the HS300 index,yonyou stock, and EUR/USD exchange rate, resulting the best HR of 0.754 (75.4%) on HS300.A comparison of FEPK models with the EMD-KNN and KNN models shows the FEPK models are the superior ones.
For further work, we will focus on more comprehensive information as input, and a more suitable similarity metric for financial time series.Moreover, other effective nonlinear dimensionality reduction methods or prediction algorithms will be applied, such as the auto encoder and random forest.
Disclosures
The authors declare no conflicts of interest.
杂志排行

Journal of Electronic Science and Technology的其它文章
- Smart Meter Development for Cloud-Based Home Electricity Monitor System
- Approach for Grid Connected PV Management:Advance Solar Prediction and Enhancement of Voltage Stability Margin Using FACTS Device
- Comparative Study of 10-MW High-Temperature Superconductor Wind Generator with Overlapped Field Coil Arrangement
- Characteristic Length of Metallic Nanorods under Physical Vapor Deposition
- Data Bucket-Based Fragment Management for Solid State Drive Storage System
- ECC-Based RFlD Authentication Protocol