In situ measurements of winter wheat diurnal changes in photosynthesis and environmental factors reveal new insight into photosynthesis improvement by super-high-yield cultivation
2021-01-18MAMingyangLlUYangZHANGYaowenQlNWeilongWANGZhiminZHANGYinghuaLUCongmingLUQingtao
MA Ming-yang ,LlU Yang,ZHANG Yao-wen,QlN Wei-long,WANG Zhi-min,ZHANG Ying-hua,LU Cong-ming,LU Qing-tao
1 Key Laboratory of Photobiology,Institute of Botany,Chinese Academy of Sciences,Beijing 100093,P.R.China
2 College of Agronomy and Biotechnology,China Agricultural University,Beijing 100193,P.R.China
3 State Key Laboratory of Crop Biology,Ministry of Science and Technology/College of Life Sciences,Shandong Agricultural University,Tai’an 271018,P.R.China
4 Hybrid Rapeseed Research Center of Shaanxi Province/Shaanxi Rapeseed Branch of National Oil Crops Genetic Improvement Center,Yangling 712100,P.R.China
Abstract In past 30 years,the wheat yield per unit area of China has increased by 79%. The super-high-yield (SH) cultivation played an important role in improving the wheat photosynthesis and yield. In order to find the ecophysiological mechanism underneath the high photosynthesis of SH cultivation,in situ diurnal changes in the photosynthetic gas exchange and chlorophyll (Chl) a fluorescence of field-grown wheat plants during the grain-filling stage and environmental factors were investigated. During the late grain-filling stage at 24 days after anthesis (DAA),the diurnal changes in net CO2 assimilation rate were higher under SH treatment than under high-yield (H) treatment. From 8 to 24 DAA,the actual quantum yield of photosystem II (PSII)electron transport in the light-adapted state (ΦPSII) in the flag leaves at noon under SH treatment were significantly higher than those under H treatment. The leaf temperature,soil temperature and soil moisture were better suited for higher rates of leaf photosynthesis under SH treatment than those under H treatment at noon. Such diurnal changes in environmental factors in wheat fields could be one of the mechanisms for the higher biomass and yield under SH cultivation than those under H cultivation. ΦPSII and CO2 exchange rate in wheat flag leaves under SH and H treatments had a linear correlation which could provide new insight to evaluate the wheat photosynthesis performance under different conditions.
Keywords:photosynthesis,Chl a fluorescence,super-high-yield cultivation,winter wheat,ecophysiological mechanism
1.lntroduction
Wheat (Triticum aestivumL.) is one of the most important crop species worldwide. During the last 30 years(1988–2018),global wheat production has increased by 47%,and the average yield per unit area has increased by 49%. During the same period,wheat production in China increased by 54%,and the average yield per unit area increased by approximately 79% (http://www.fao.org/faostat/en/#data/QC). However,owing to the increase in the global population (by 48%) and people’s expectations for a better standard of living,increased wheat yields are needed to provide food and raw food materials. The greater increase in average wheat production per unit area in China than that in other parts of the world is not only due to newer high-yield (H) cultivars but also due to improved cultivation techniques (Yuet al.2002; Li 2010; Zhouet al.2014). Super-high-yield (SH) wheat cultivars that resulted in yield gains of more than 9 000 kg ha–1by the use of SH cultivation techniques have been developed (Yuet al.2002).In terms of a yield equation,wheat yield (Y) is determined by three main components:total number of shoots per unit area (N),average biomass per shoot (B) and harvest index(HI) (Y=N×B×HI). All three yield components are the result of the combination action of wheat genetic germplasm and cultivation conditions. Therefore,how wheat obtains super high yields under optimal cultivation conditions has started to generate interest among growers.
Photosynthesis during the growing season is the primary determinant of crop biomass (Parryet al.2011). Grain weight mainly originates from wheat photosynthesis products after anthesis,and flag leaves contribute a critical portion of grain weight (Suiet al.2005). Many H cultivars obtained had been reported to have higher flag leaf photosynthetic ability (Suiet al.2005; Yanget al.2007; Bresticet al.2008; Wanget al.2015). Meanwhile,the study of flag leaf photosynthesis after anthesis in SH cultivated wheat has become the focus of efforts to elucidate the mechanism underlying super high grain yields. Nitrogen application at the pistil-stamen-formation and tetrad-formation stages markedly increases photosynthetic ability during the grainfilling stage and extends the leaf photosynthetic period(Wanget al.1998). SH cultivation was shown to alleviate the decrease in chlorophyll (Chl) content,net photosynthesis(Pn) and RuBPcase activity in the flag leaves as well as the leaf area index (LAI) and canopy apparent photosynthesis(CAP) of wheat plants during the late grain-filling period(Kanget al.2000). Compared with other treatments,SH cultivation resulted in a higherPnat five stages during flag leaf development and senescence; moreover,the RuBPcase activity in the flag leaves and the CAP were also higher than those in other treatments (Wanget al.2001). It was also found that a 300-kg ha–1nitrogen supply was optimal for maximum photosynthesis and compared with other nitrogen supply rates,this rate resulted in the highest wheat yield(Sunet al.2008). Under optimal fertilization with 300 kg ha–1nitrogen and 150 kg ha–1phosphorus,wheat flag leaves presented the highest photosynthesis rate and the lowest midday depression of net CO2assimilation in the early grain-filling stage (Zhaoet al.2010). Though these studies showed that the photosynthesis rate increased under SH cultivation,they aimed mainly to find the optimal fertilization method to obtain super high yields. Photosynthesis is a complex biological process regulated by light,temperature,water,nutrition,etc.(Yanget al.2006; Eberhardet al.2008; Zivcaket al.2013; Kaiseret al.2015). However,the environmental factors involved still need to be systematically evaluated to elucidate the ecophysiological mechanism of photosynthesis improvement by SH cultivation.
The PTM-48A Photosynthesis Monitor was recently developed for long-term automatic recording of most of the measurable ecophysiological characteristics of intact plants.The PTM-48A Photosynthesis Monitor could automaticallyin situmeasure and record photosynthesis parameters and environmental factors,such as the CO2exchange rate,transpiration rate,air temperature,and soil temperature,etc.(Balauret al.2009). Chl fluorescence quenching has been used as a powerful and reliable noninvasive method to investigate changes in the function of photosystem II(PSII) under different environmental conditions (Krause and Weis 1991; Schreiberet al.1994). Another multichannel fluorometer system was developed to automaticallyin situmeasured Chlafluorescence to monitor PSII photochemistry and quenching (Porcar-Castellet al.2008).
The main objective of this study was to investigate the ecophysiological mechanism underneath SH wheat by comparing the photosynthesis and ecophysiological factors under SH and H cultivation. For this purpose,wein situmeasure the different diurnal changes in gas exchange and Chlafluorescence of winter wheat flag leaves as well as environmental factors under H and SH cultivation during the grain-filling stage.
2.Materials and methods
2.1.Field description
Field experiments were conducted during the winter wheat growing season of 2016–2017 and 2018–2019 at the Wuqiao Experimental Station of China Agricultural University in Cangzhou (37°68´N,116°61´E),Hebei Province,China.The soil type in the experimental field was a clay loam.
2.2.Plant materials and field managements
The SH winter wheat (Triticum aestivumL.) cultivar Jimai 22 was sown on 14 October 2016 and 15 October 2018.The plant density was 541 plants m−2after emergence.Diseases,weeds and insects were controlled by chemical methods to avoid yield loss. The field managements were based on Kang (2003) with slight modification. Two treatments were applied as follows:SH and H treatments.Under the SH treatment,300 kg N ha−1was applied at a ratio of 5:5 before sowing and at the jointing stage,150 kg P2O5ha−1,150 kg K2O ha−1,30 kg ZnSO4ha−1,and 3 000 kg ha−1organic fertilizer were applied before sowing. There were two irrigation events -at the jointing and anthesis stages -with 75 mm water applied each time. In the H treatment,210 kg N ha–1was applied at a ratio of 6:4 before sowing,and at the jointing stage,120 kg P2O5ha−1and 120 kg K2O ha−1were applied before sowing. There was only one irrigation event at jointing stage with 75 mm water applied (Xuet al.2018). Wheat plants were harvested on 7–8 June 2017 and 2019.
2.3.Determination of grain yield,number of spikes,biomass per spike,kernels per spike,and 1 000-kernel weight
At maturity,winter wheat was harvested from 1 m×1 m in SH and H treated plots with three replicates to determine grain yield,and the number of spikes was counted at the same area. Ten intact plants from SH and H treatment plots were harvested to determine biomass per spike,kernels per spike and 1 000-kernel weight on 7–8 June 2017 and 2019.
2.4.Chl content determination
The Chl content was determined according to the methods of Arnon (1949). Wheat flag leaves were collected at 0,8,16,and 24 days after anthesis (DAA). Leaf samples were taken and immediately frozen in liquid nitrogen.Leaf samples were extracted in 80% acetone,and pigment extracts were centrifuged at 5 000×g.
2.5.Flag leaf gas exchange and measurements of environmental factors
The flag leaf CO2exchange,transpiration rate and environmental factors werein situmeasured at 0,8,16,and 24 DAA. Measurements were performed on intact flag leaves of plants in the field. The flag leaf CO2exchange and transpiration rates were monitored simultaneously using an automatic 4-channel open-type PTM-48A Photosynthesis Monitor (Phyto-Sensor Group,Chisinau,Moldova)equipped with self-clamping LC-4W leaf chambers with a natural light source (Balauret al.2009). Flag leaves with the same orientation of 90° to direct solar radiation were selected and fixed orientation by LC-4W leaf chambers at approximately 10:00 a.m. The airflow rate was 450 mL min−1in the chamber. The CO2and H2O concentrations were monitored by an infrared analyzer component of the PTM-48A,and the leaf temperature was monitored by an LT-1P leaf temperature sensor. The photosynthetic photon flux density (PPFD),air temperature and relative humidity were measured by an RTH-48 meter,and the soil temperature and moisture were monitored by the SMTE sensor of the RTH-48A device,which was inserted into the soil to a depth of 15 cm. Each data point was collected at 30 min intervals from 0:00 to 23:30 daily.
2.6.Chl a fluorescence measurements
Chlafluorescence wasin situmeasured with a MONI-PAM multichannel Chl fluorometer (Walz,Effeltrich,Germany) at 30 min intervals. The flag leaves with the same orientation of 90° to direct solar radiation were also selected at approximately 10:00. The fluorometer was connected to six emitter-detector units (MONI-head/485) (Porcar-Castellet al.2008). The MONI-head/485 fluorometer was connected using RS-485 serial data communication portsviaa MONI-DA storage-capable data acquisition system.The steady-state value of fluorescence (Fs) was measured at 30 min intervals. After theFswas recorded,a saturating pulse at 4 000 μmol m−2s−1was imposed to determine the maximal fluorescence level in the light-adapted state (Fm´).The minimal fluorescence level (Fo) when all PSII reaction centers were opened was estimated only during the night.The maximal fluorescence level (Fm) when all PSII reaction centers were closed was also estimated during the night.
Using the fluorescence parameters above,we calculated the following:(1) the maximal efficiency of PSII photochemistry in the dark-adapted state,Fv/Fm=(Fm–Fo)/Fm(Krause and Weis 1991); (2) the actual quantum yield of PSII electron transport in the light-adapted state,ΦPSII=(Fm´–Fs)/Fm´,as defined by Gentyet al.(1989).
2.7.Statistical analysis
In the leaf gas exchange and Chl fluorescence experiments,individual plants were considered independent biological replicates. Linear regressive analysis with CO2exchange and ΦPSII data was conducted by the regressive procedure in the SPSS 21.0.
3.Results
3.1.Grain yield,number of spikes per unit area and harvest index
The grain yields,number of spikes and biomass per spike under SH treatment were significantly higher than those under H treatment in 2017 and 2019 (Fig.1-A–C). The kernels per spike and 1 000-kernel weight did not show any significant difference between SH and H treatments(Fig.1-D and E).
3.2.Diurnal changes in PPFD,air temperature and air relative humidity
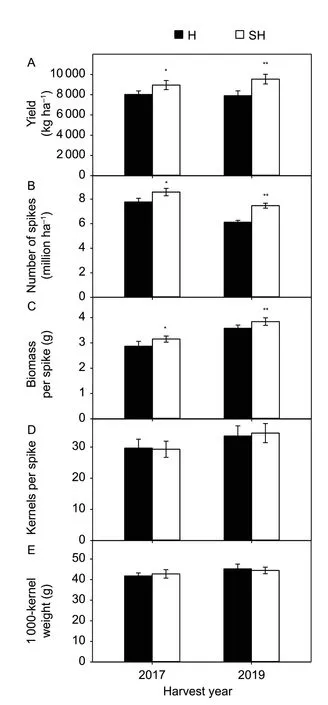
Fig.1 Grain yield (A),number of spikes per unit area (B),biomass per spike (C),kernels per spike (D),and 1 000-kernel weight (E) under super-high-yield (SH) and high-yield (H)treatments in 2017 and 2019. Data are mean±SE of three or 10 independent measurements. Significant differences from the SH treatment are based on Student’s t-test (*,P<0.05; **,P<0.01).
The diurnal changes of PPFD,air temperature and air relative humidity were measured from 0:00 to 23:30 with 30 min interval by PTM-48A (Fig.2). The maximum PPFD values were between 1 833 to 2 078 μmol m−2s−1in the midday in 2017 and between 1 666 to 1 884 μmol m−2s−1in the midday in 2019 (Fig.2-A and D). The air relative humidity exhibited an inverted bell curve. The maximum air relative humidity on each measured day occurred at 05:00,and the minimum air relative humidity on each measured day occurred at approximately 14:00–15:00 in 2017 and 10:00–17:00 in 2019 (Fig.2-B and E). The air temperature during each day of measurement paralleled changes in PPFD and fit a bell curve. The highest air temperature on each measured day occurred at 15:00 except at 0 DAA,when it occurred at 12:00 in 2017 and 2019 (Fig.2-C and F).The lowest air temperature on each measured day occurred before the sunrise time except at 16 DAA in 2017,when it occurred at 03:00 (Fig.2-B).
3.3.Chl content in flag leaves
The change of Chl content represented the developmental and senescent states of flag leaf. Our results show that the total Chl content in flag leaves reached the maximum at 8 DAA then decreased after 8 DAA. The Chl contents in flag leaves under SH treatment were higher than those under H treatment. Moreover,the Chl content in flag leaves under SH treatment declined more slowly than that under the H treatment from 8 to 24 DAA (Fig.3).
3.4.Diurnal changes of gas exchange in flag leaves
For inspect difference of CO2and H2O exchange rate in wheat flag leaves between SH and H treatments,the diurnal changes in CO2exchange and transpiration rates werein situmeasured. Diurnal profiles of the CO2exchange rates and transpiration rates of wheat flag leaves under the SH and H treatments at four measured days were shown in Fig.4.The CO2exchange rates greater than zero indicatePn,and values smaller than zero represent net respiration. The maximumPnrate of each measured day occurred between 10:00 and 12:00 (Fig.4-A–H). The CO2exchange rates did not significantly differ at 0 or 8 DAA under H and SH treatments. However,the CO2exchange rates between 10:00 and 16:00 at 16 DAA were significantly higher under SH treatment than under H treatment (Fig.4-C and G).Moreover,the CO2exchange rates between 08:00 and 16:00 at 24 DAA were significantly higher under SH treatment than under H treatment in 2017 and 2019 (Fig.4-D and H).However,the net respiration rate at night did not significantly differ between SH and H treatments at four stages. The wheat flag leaf transpiration rates between 10:00 and 16:00 at 24 DAA were very significantly higher under SH treatment than under H treatment in 2017 (Fig.4-L). In 2019,the wheat flag leaf transpiration rates between 12:00 and 16:00 at 16 DAA were very significantly higher under SH treatment than under H treatment (Fig.4-O). Moreover,the wheat flag leaf transpiration rates between 07:30 and 17:30 at 24 DAA were significantly higher under SH treatment than those under H treatment (Fig.4-P)
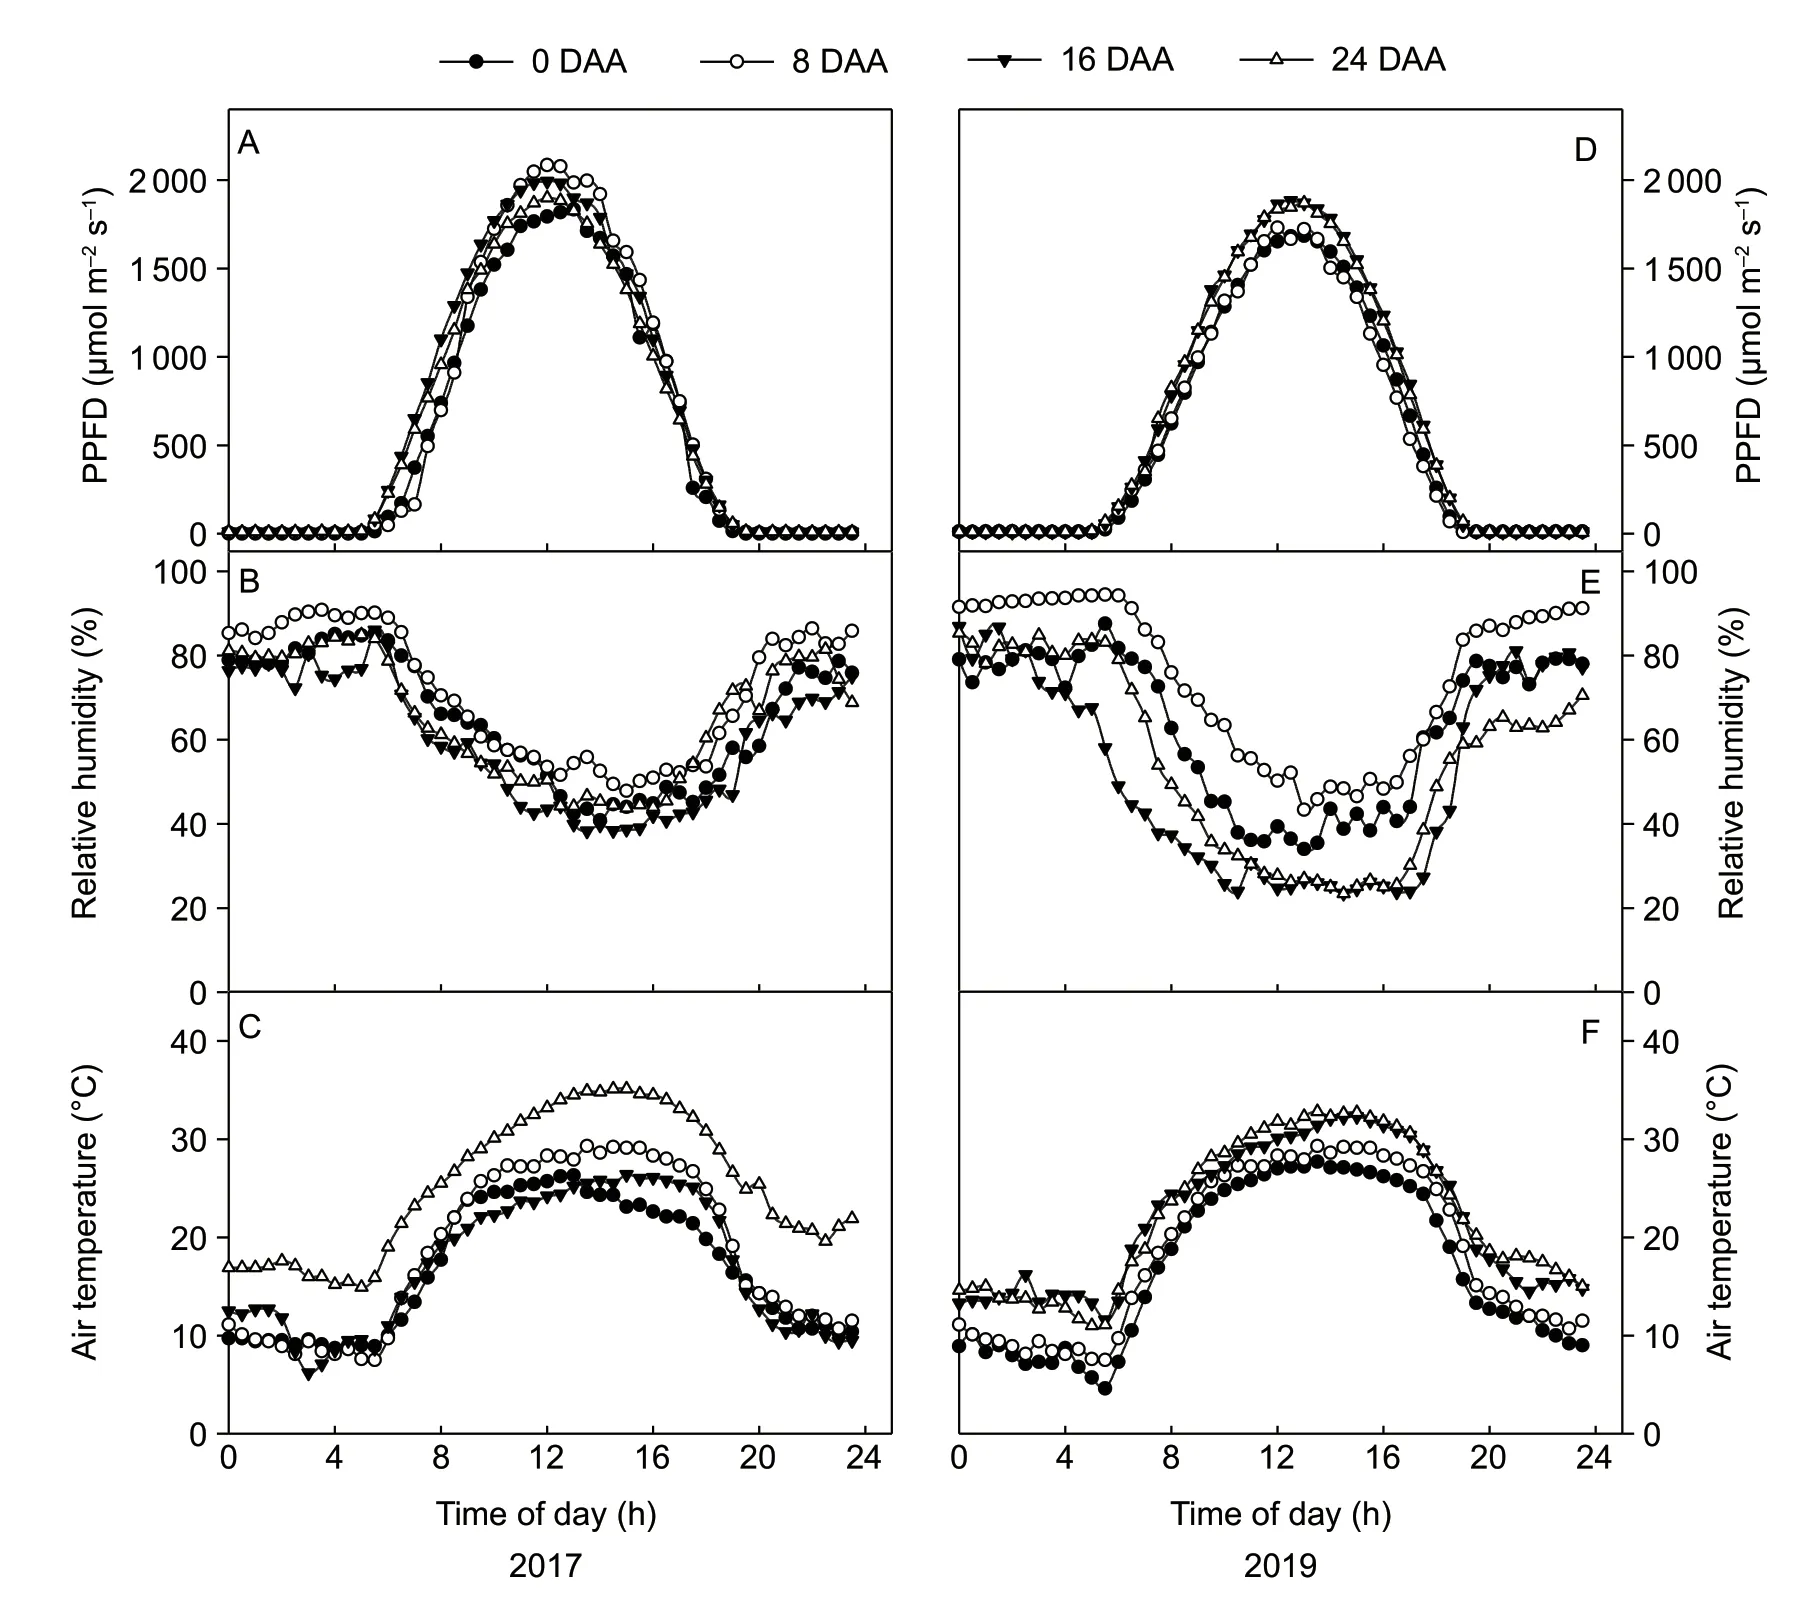
Fig.2 Diurnal changes in photosynthetic photon flux density (PPFD) (A),air relative humidity (B) and air temperature (C) in the field in 2017 and 2019. The data were collected at 0,8,16,and 24 days after anthesis (DAA).
3.5.Chl a fluorescence
Changes in the maximal efficiency of PSII photochemistry in the dark-adapted state (Fv/Fm) of flag leaves during grain filling are shown in Fig.5. TheFv/Fmdid not significantly differ,presenting a high value great than 0.80 between two treatments until 16 DAA in 2017 and 2019 (Fig.5-A and B).TheFv/Fmthen significantly differed at 24 DAA,presenting a value of 0.75 under H treatment and a value of 0.79 under SH treatment (Fig.5).
The diurnal changes in quantum yield of PSII (ΦPSII)were measured at 0,8,16,and 24 DAA in 2017 and 2019(Fig.6). The values of ΦPSII declined with the increase of PPFD and reached the lowest value at midday. From 8 to 24 DAA in 2017,the ΦPSII of the flag leaves between 11:00 and 17:00 under SH treatment was significantly higher than under H treatment (Fig.6-B–D). From 16 to 24 DAA in 2019,the ΦPSII of the flag leaves between 08:30 and 20:00 under SH treatment was significantly higher than that under H treatment (Fig.6-F–H).
3.6.Diurnal changes in leaf temperature,soil temperature and moisture
The leaf temperature could affect many leaf physiological processes. The diurnal changes in leaf temperature were measured in 2017 and 2019 (Fig.7-A–H). The lowest temperature occurred at approximately 05:00,except at 16 DAA in 2017,when it occurred at 03:00 (Fig.7-C). The highest leaf temperature occurred at approximately 13:00.Beginning at 8 DAA,the leaf temperatures between 10:00 and 16:00 under SH treatment started to become lower than those under H treatment. At 24 DAA,the leaf temperatures between 10:00 and 16:00 under SH treatment were significantly lower than those under H treatment (Fig.7-D and H). We checked the diurnal changes of the differences between the air and leaf temperatures (Fig.7-I–P). From 10:00 to 16:00,the leaf temperatures started to be higher than the air temperature. Moreover,at 24 DAA in the H treatment,the difference between leaf and air temperatures was significantly higher than that in the SH treatment between 08:00 and 16:00 (Fig.7-L and P).
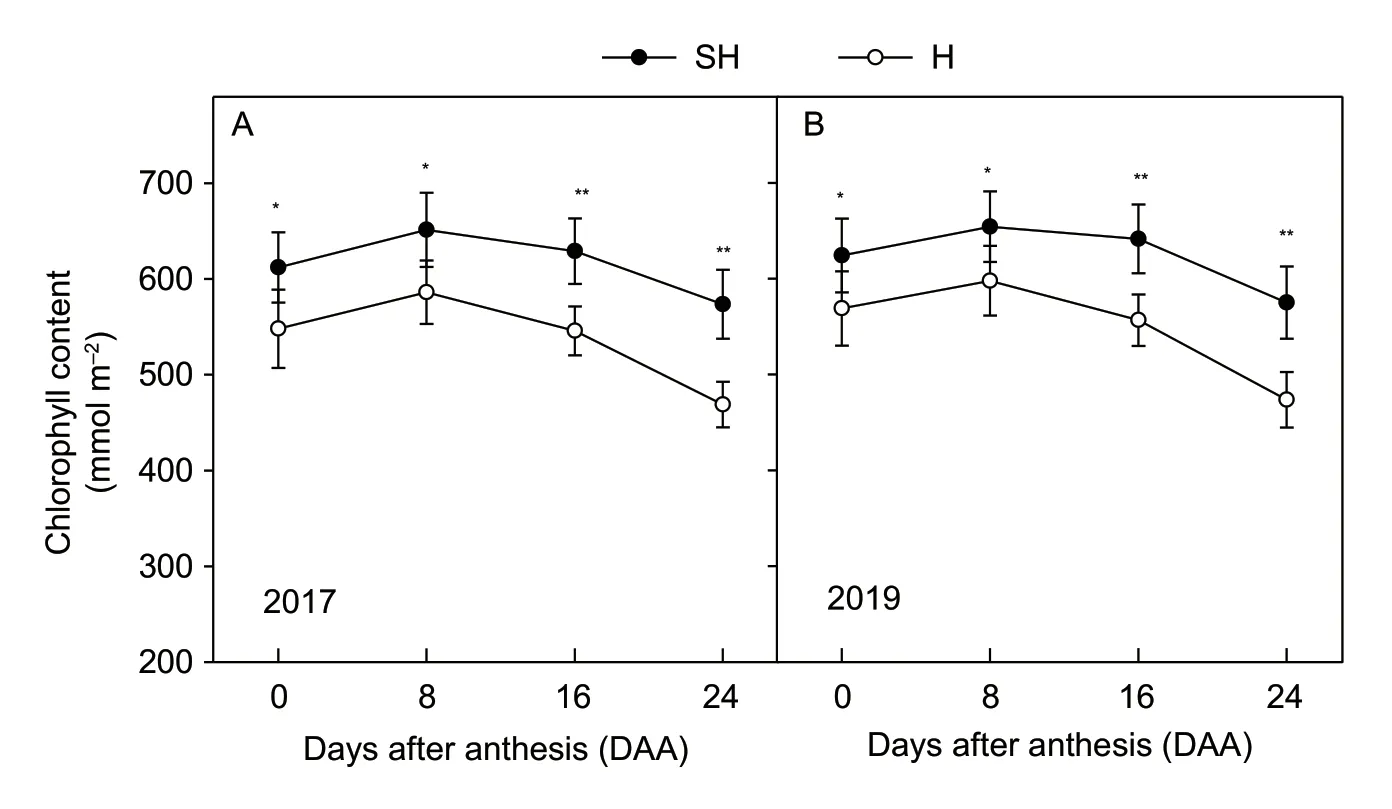
Fig.3 Changes in the chlorophyll (Chl) content of wheat flag leaves at 0,8,16,and 24 days after anthesis (DAA) under super-highyield (SH) and high-yield (H) treatments in 2017 and 2019. Data are mean±SE of 3–5 independent measurements. Significant differences from the SH treatment are based on Student’s t-test (*,P<0.05; **,P<0.01).
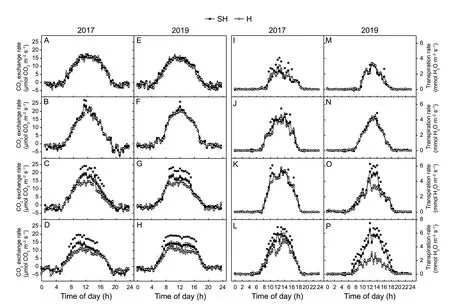
Fig.4 Diurnal changes in CO2 exchange rates (A–H) and transpiration rates (I–P) of wheat flag leaves during grain filling. The data of CO2 exchange rates and transpiration rates were measured at 0 (A,E,I,and M),8 (B,F,J,and N),16 (C,G,K,and O),and 24 (D,H,L,and P) days after anthesis (DAA) under super-high-yield (SH) and high-yield (H) treatments in 2017 and 2019.The data are the mean±SE of four independent measurements. Significant differences from the SH treatment are based on Student’s t-test (★,P<0.05).
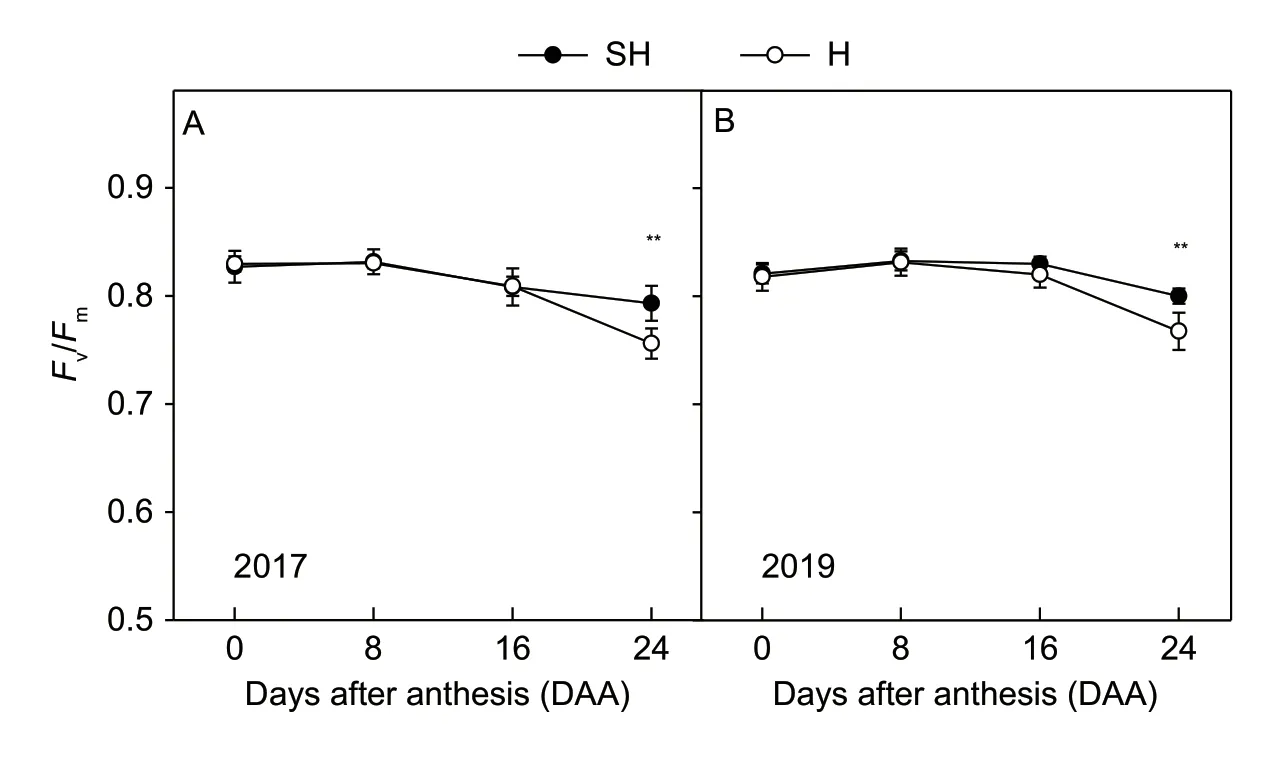
Fig.5 Maximal efficiency of PSII photochemistry in the dark-adapted state (Fv/Fm) of wheat flag leaves during the grain-filling stage in 2017 and 2019. The data are the mean±SE of 3–5 independent measurements. SH,super-high-yield; H,high-yield. Significant differences from the SH treatment are based on Student’s t-test (*,P<0.05; **,P<0.01).
3.7.Diurnal changes in soil temperature and soil moisture
Because the H treatment omitted one time irrigation at the anthesis stage,we monitored the diurnal changes in soil temperature and soil moisture. The soil temperatures under H treatment after 12:00 were higher than those under SH treatment in 2017 (Fig.8-A–D). But the soil temperatures under H treatment were higher than those under SH treatment at many more time points at 8,16 and 24 DAA in 2019 (Fig.8-F–H). The soil moisture under H treatment was always lower than that under SH treatment. The soil relative humidity all had a slight peak at noon from 0 to 24 DAA(Fig.8-I–P). The soil relative humidity under SH treatment was always higher than that under H treatment. Though the soil humidity under SH and H treatments all decreased from 0 to 24 DAA,the difference of soil relative humidity between SH and H treatments increased apparently.
3.8.The linear relationship between CO2 exchange rate and quantum yield of PSll
The diurnal profiles of CO2exchange rate and ΦPSII showed that they could have some negative correlation.So the correlation analysis was performed by SPSS 21.0 Software. The correlation factor of Pearson method is 0.904 with the significance less than 0.001. Then linear regression analysis showed that the CO2exchange rates were linear correlated with ΦPSII at each stage of grain filling and the square of the correlation coefficient (R2) is higher than 0.800 with the significance less than 0.001(Fig.9-A–H). The linear coefficients of CO2exchange rate and ΦPSII under SH treatment ranged from–33.3 to–55.2.The linear coefficients under H treatment ranged from–19.2 to–41.9. TheR2under SH and H treatments all reached the highest value at 8 DAA with value of 0.930 and 0.919 in 2017 and at 0 DAA with values of 0.948 and 0.958 in 2019(Fig.9-B and E).
4.Discussion
In this study,the grain yield,the photosynthesis and ecophysiological factors under SH and H cultivation were investigated. The higher grain yield of wheat under SH treatment than H treatment in this study was in agreement with other studies (Fig.1) (Wanget al.1998,2001; Kanget al.2000). The biomass per spike under SH treatment showed significantly higher than that under H treatment in 2017 and 2019. Because the higher biomass means the higher accumulation of photosynthesis product,the relative factors of photosynthesis had been investigated.
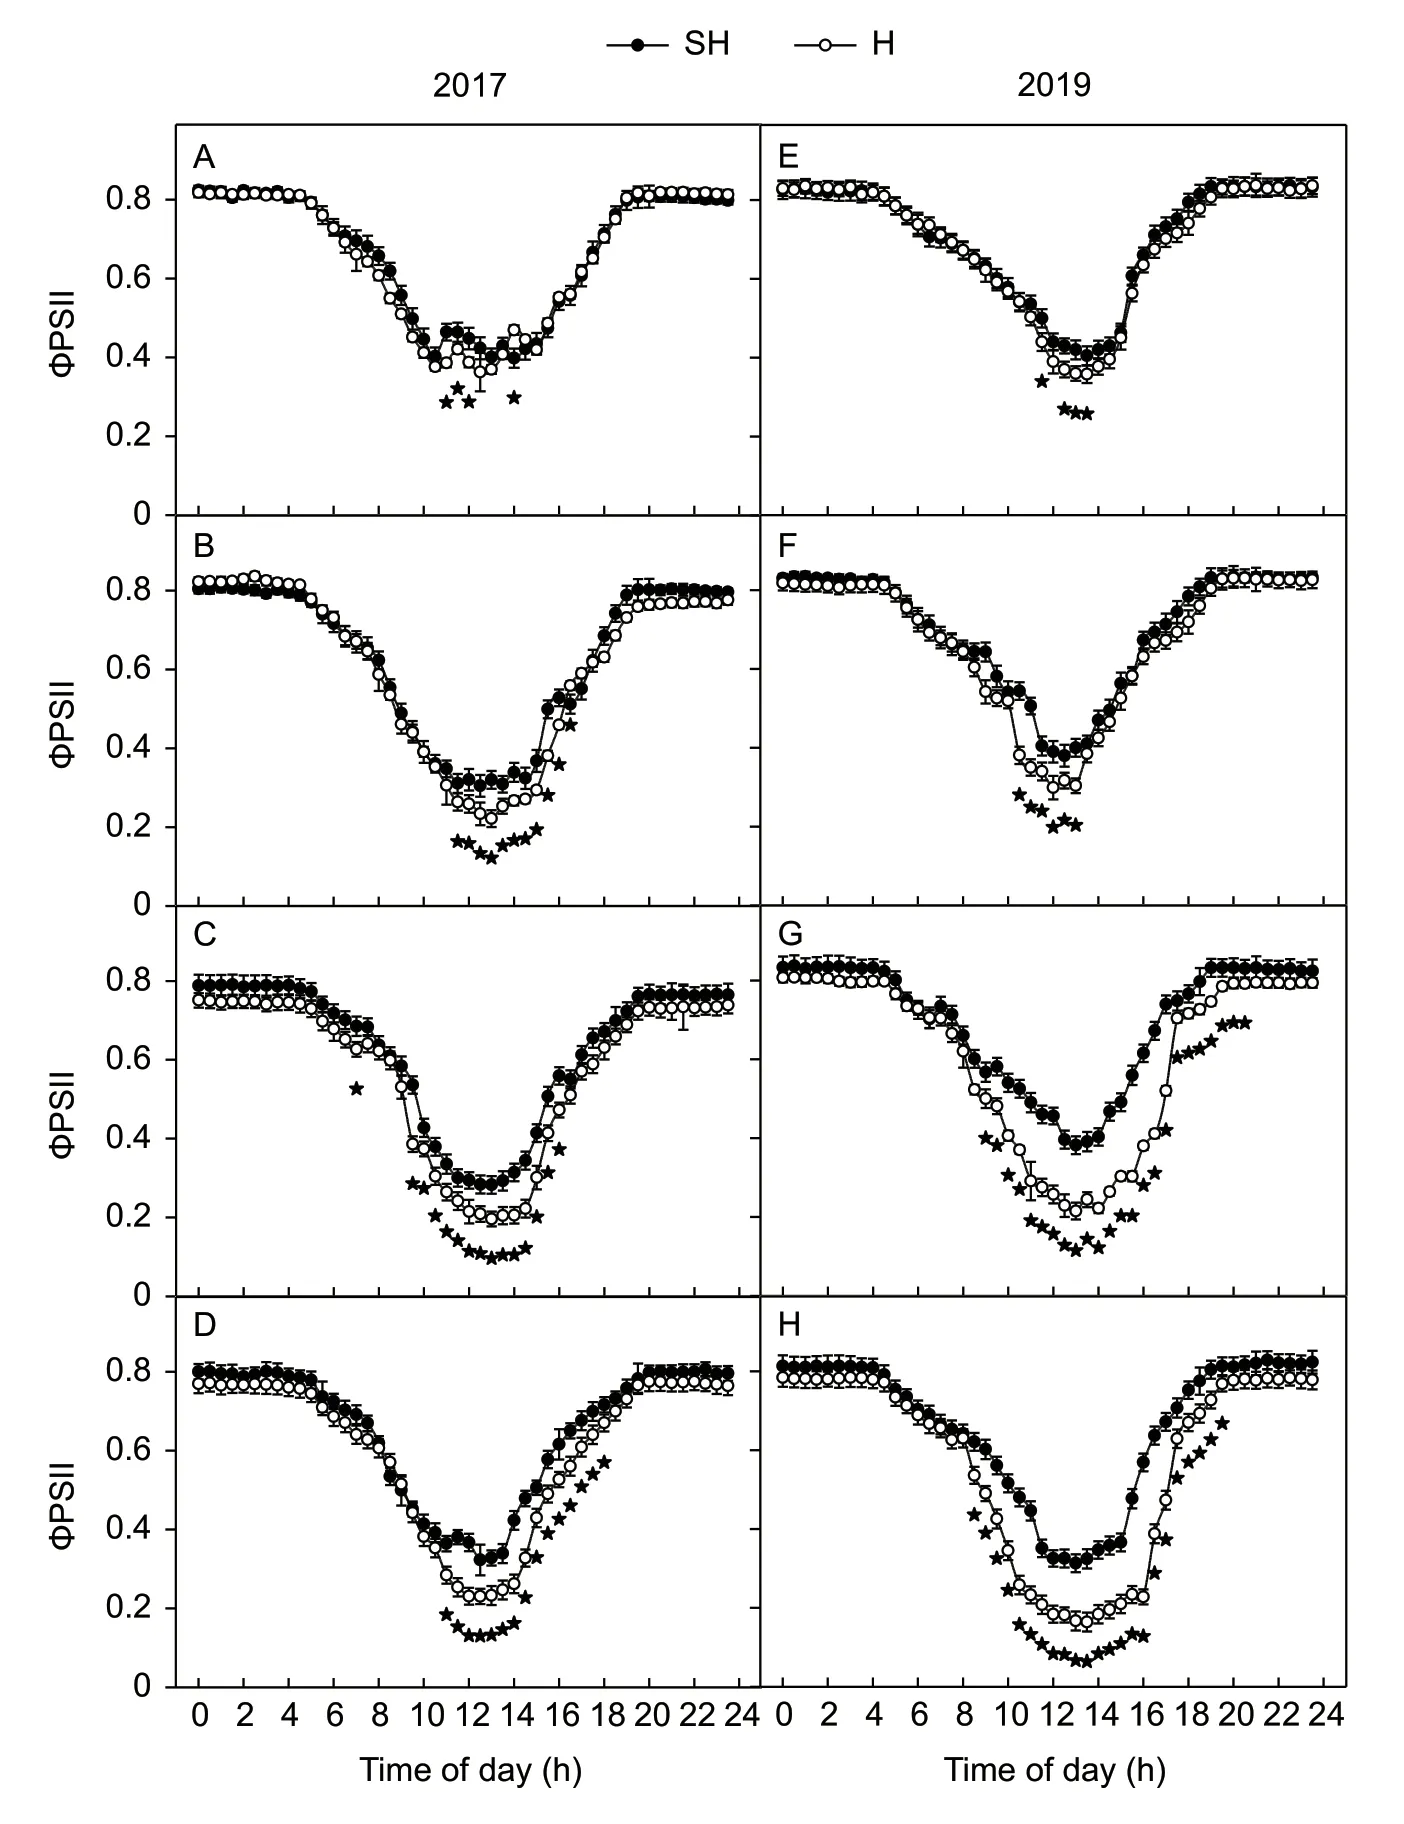
Fig.6 Diurnal changes in the actual quantum yield of PSII electron transport in the light-adapted state (ΦPSII,A–H) of wheat flags at 0 (A and E),8 (B and F),16 (C and G),and 24 (D and H) days after anthesis (DAA) under super-high-yield (SH) and high-yield(H) treatments in 2017 and 2019. The data are the mean±SE of four independent measurements. Significant differences from the SH treatment are based on Student’s t-test (★,P<0.05).
The results in the present study show that the Chl content and the photosynthesis rate of wheat flag leaves peaked at 8 DAA but decreased afterward (Figs.3 and 4). These results suggest that the wheat flag leaves still developed and grew after anthesis,in agreement with the results of a previous study (Luet al.2002). Moreover,the total Chl content in the flag leaves under SH treatment was higher than that under H treatment at the anthesis stage. The decrease in Chl content under SH treatment was slower than that under H treatment. This higher Chl content suggests that the flag leaves have higher photosynthesis potential under SH treatment than under H treatment. In contrast,the photosynthesis and transpiration rates of the wheat flags under SH treatment did not significantly differ from those under H treatment at the anthesis stage and at 8 DAA. The results that the flag leaves had higher maximumPnrates under SH treatment than under H treatment at 16 and 24 DAA are similar to the results of other studies(Kanget al.2000; Suiet al.2005). It also agreed with that optimized nitrogen,phosphorus and potassium supply could increase the wheat flag leaf photosynthesis during grain filling (Gyugaet al.2002; Liuet al.2020; Yueet al.2020). Moreover,the results of the diurnal profile showed that a higherPnrate happened between 10:00 and 14:00 at 16 DAA and between 08:00 and 16:00 at 24 DAA under SH treatment (Fig.4-C and D). It has been considered that wheat flag leaves present increased photosynthesis because of SH treatment (Wanget al.1998). Previous studies have shown that the diurnalPnrate at all time points throughout day was higher under SH treatment than under H treatment (Sunet al.2008). This difference may be due to the different measurement conditions and methods.The conditions of the measurements in the present study werein situand under natural wheat field conditions,but the conditions in the previous study included controlled CO2concentrations and temperatures. And in this study,the method ofin situmeasurement could better reflect the actual leaf photosynthesis state.
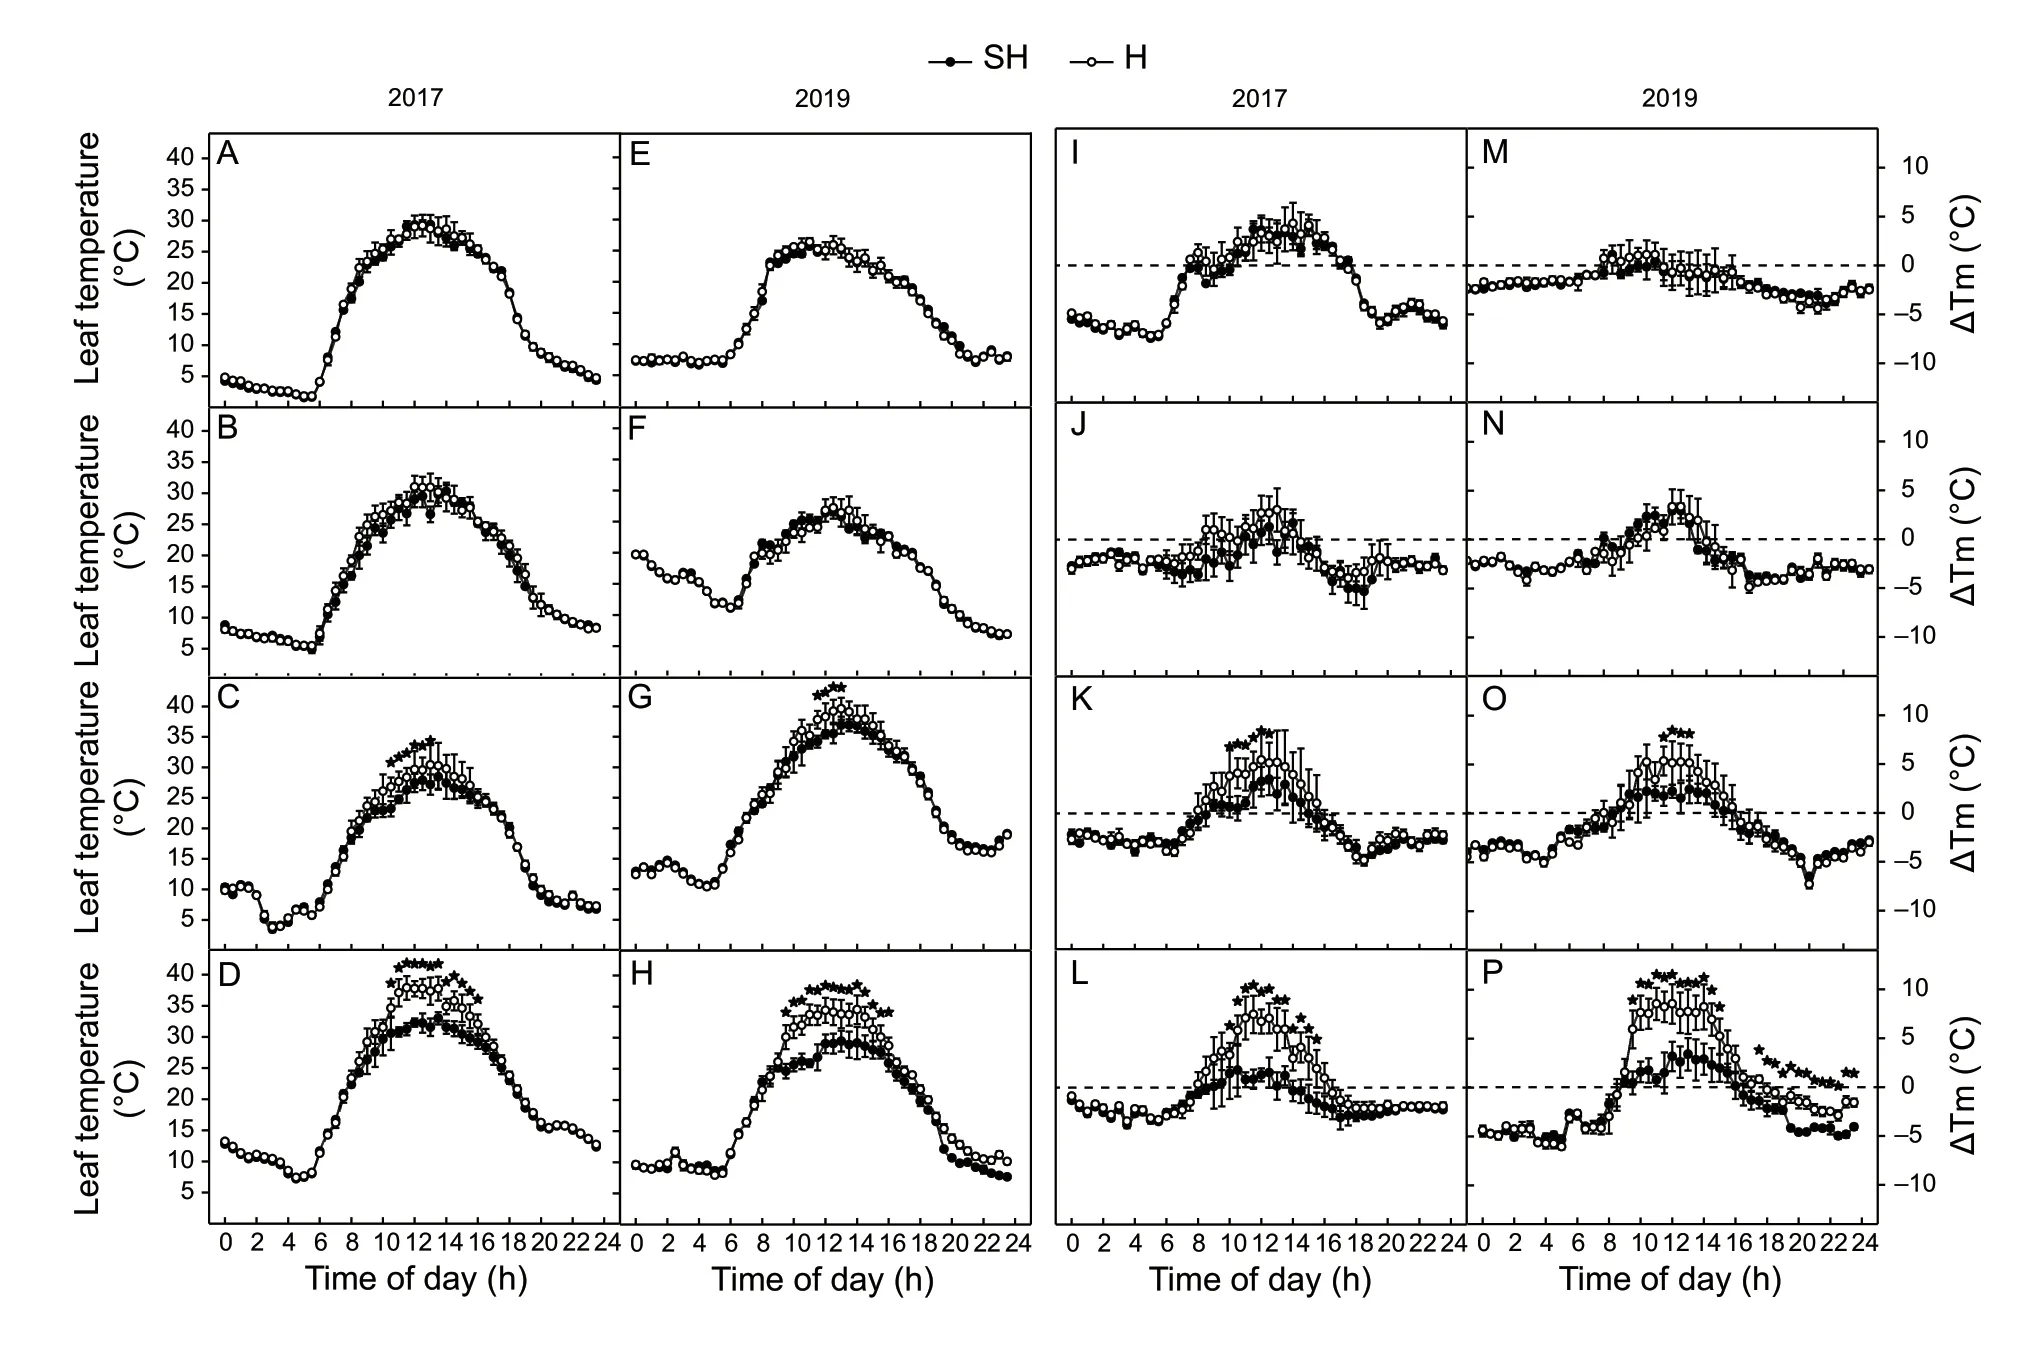
Fig.7 Diurnal changes in leaf temperature (A–H) and differences between leaf and air temperature (ΔTm) (I–P) of wheat flag leaves at 0 (A,E,I,and M),8 (B,F,J,and N),16 (C,G,K,and O),and 24 (D,H,L,and P) days after anthesis (DAA) under superhigh-yield (SH) and high-yield (H) treatments in 2017 and 2019. The data are the mean±SE of four independent measurements.Significant differences from the SH treatment are based on Student’s t-test (★,P<0.05).
In the present study,we used Chlafluorescence,a powerful and reliable noninvasive method,to investigate different diurnal changes in PSII function in flag leaves under SH and H treatments. However,theFv/Fmdecreased little during senescence (Fig.5). Only at 24 DAA,the value ofFv/Fmunder SH treatment was significantly higher than that under H treatment. These results suggest that the PSII activity in dark-adapted state is still at a high level until 24 DAA and that the PSII activity in dark-adapted state is higher under SH treatment than under H treatment.
The ΦPSII had been introduced to measure the efficiency of photosystem II photochemistry (Gentyet al.1989). The diurnal changes of ΦPSIIin situshowed that the ΦPSII decreased with increasing PPFD. However,accompanied by the progression of leaf senescence,the ΦPSII decreased more sharply at 24 DAA under H treatment than under SH treatment (Fig.6). These results implied that there are more closed PSII reaction centers in the light-adapted state of flag leaves under H treatment than those under SH treatment(Gentyet al.1989; Luet al.2002). In coordinated with a decreased photosynthetic rate in senescent flag leaves,the requirement for reducing power for the dark reactions inevitably decreases. Thus,the quantum yield of PSII in senescent flag leaves decreased more sharply under H treatment than under SH treatment.
The photosynthesis of flag leaves is a complex biological process that is affected by light,temperature,water supply,etc. Moreover,the growth and photosynthesis of wheat plants can also affect the microenvironment in wheat fields. We checked the diurnal changes of leaf temperaturein situand compared them with the diurnal changes in air temperature (Fig.7). The results showed that the leaf temperature was higher than the air temperature at daytime but lower than the air temperature at night. The better irrigation and fertilization of SH treatment narrowed the difference between the leaf and air temperatures in the light,especially at noon. Wheat plants present their highest photosynthesis rate at temperatures between 25 and 30°C under controlled light intensity (Downes 1970; Bunce 1998). The results in the present study showed that all the maximum leaf temperatures occurred at approximately 30°C except at 24 DAA in 2017,16 and 24 DAA in 2019 under H treatment. Higher leaf temperature of flag leaves under H treatment at 24 DAA could result in high-temperature stress and reduced photosynthesis.
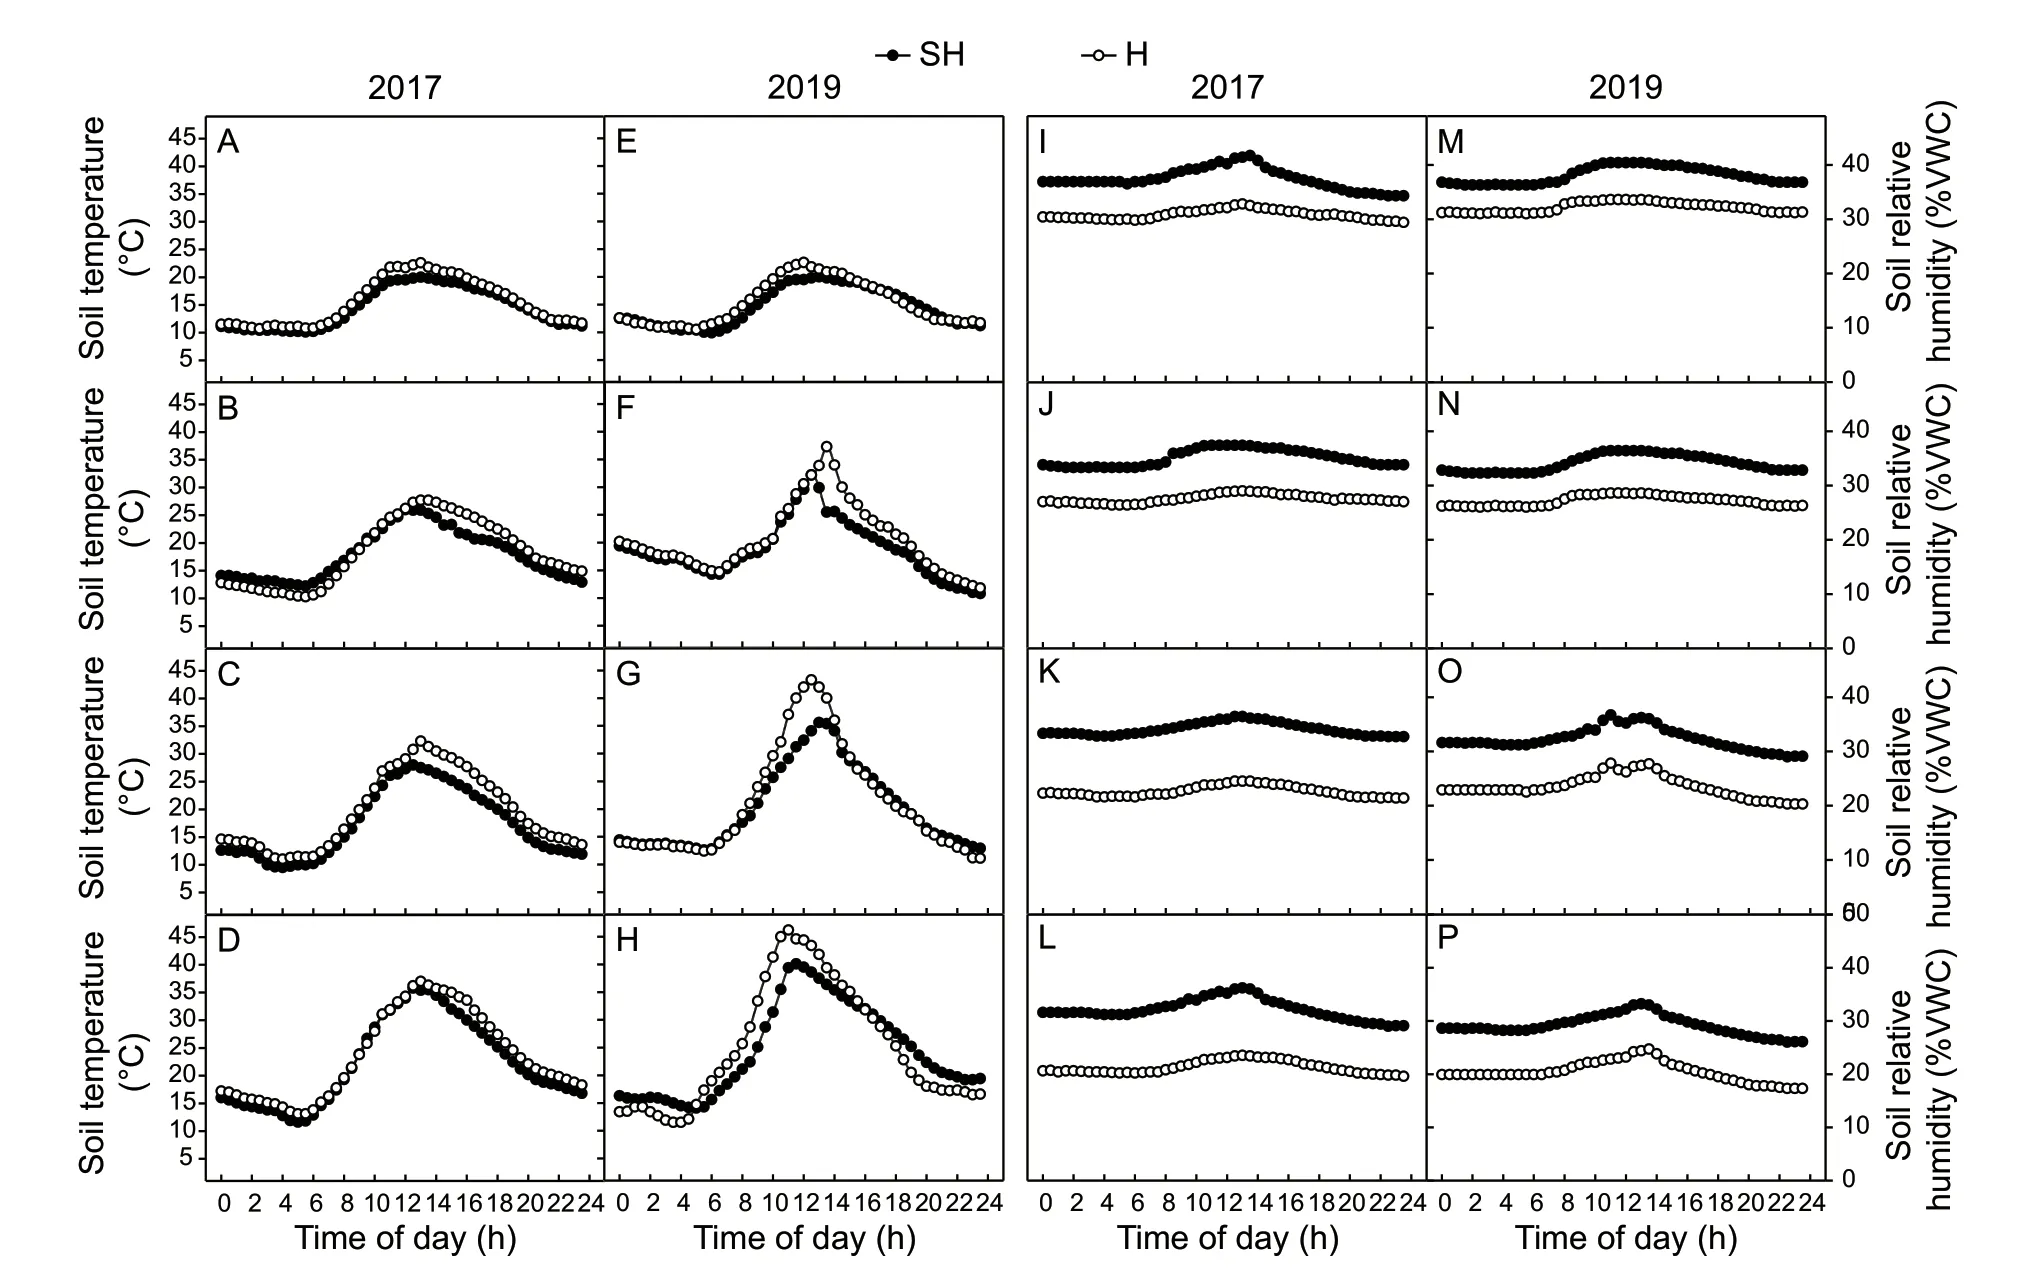
Fig.8 Diurnal changes in soil temperature (A–H) and soil moisture (I–P) at 0 (A,E,I,and M),8 (B,F,J,and N),16 (C,G,K,and O),and 24 (D,H,L,and P) days after anthesis (DAA) under super-high-yield (SH) and high-yiled (H) treatments in 2017 and 2019.%VWC,volumetric soil water (%).
The soil temperature and humidity are also important environmental factors in wheat field ecosystem. The soil temperature under SH treatment was typically higher than that under H treatment (Fig.8). The causes of the difference in soil temperature under the two kinds of cultivation may be explained by two reasons. First,there were high numbers of spikes under SH treatment (Fig.1-B) (Sunet al.2008).Second,the LAI under SH treatment was 20% greater than that under H treatment; therefore,there was less light energy transmitted canopy to the soil under SH treatment.It has been reported that the elevated temperature of soil could reduce the wheat photosynthesis rate. At early grain filling stage of wheat,rise in temperature by 3.5°C decreased thePnin flag leaf by 34% (Pramaniket al.2018).Moreover,the soil relative humidity under SH treatment was between 35–28%,which is in the optimal range of 35–26%for capillary action in clay loam soils (Jabroet al.2020).The soil moisture under H treatment decreased from 30 to 20%,which was closed to the soil moisture of 17% -the permanent wilting point of clay loam soil. These results implied that the wheat plant at 24 DAA under H treatment were under drought stress.
Chlafluorescence is a powerful technique to noninvasively investigate the photosynthetic electron transport chain(Kalajiet al.2014,2017). ΦPSII has linear correlation with the quantum yield of CO2fixation (ΦCO2) under nonphotorespiration conditions (Gentyet al.1989; Epronet al.1995). ΦPSII had been used to analyze the effects of low and high temperatures (Fryeret al.1998). Our results showed that the wheat ΦPSII also had significantly linear correlation with the CO2exchange rate under SH and H treatments in each grain-filling stage. Because the most significant linear correlation and similar slope were at 8 DAA in 2017 or 0 DAA in 2019,we could use ΦPSII to estimate CO2exchange rate at these two stages. The equations of the linear regression under SH and H treatments had different slope values in each wheat grain-filling stage.In this study,the slopes of the linear equation under SH treatment were smaller than the slope under H treatment(Fig.9). Then the slope of the linear equation under different treatments may be used to evaluate the photosynthesis performance. So we just need to measure two different CO2exchange rates and ΦPSII data pair,then the wheat photosynthesis performance could be evaluated. That would improve accuracy and convenience to compare the wheat photosynthesis performance under different conditions.
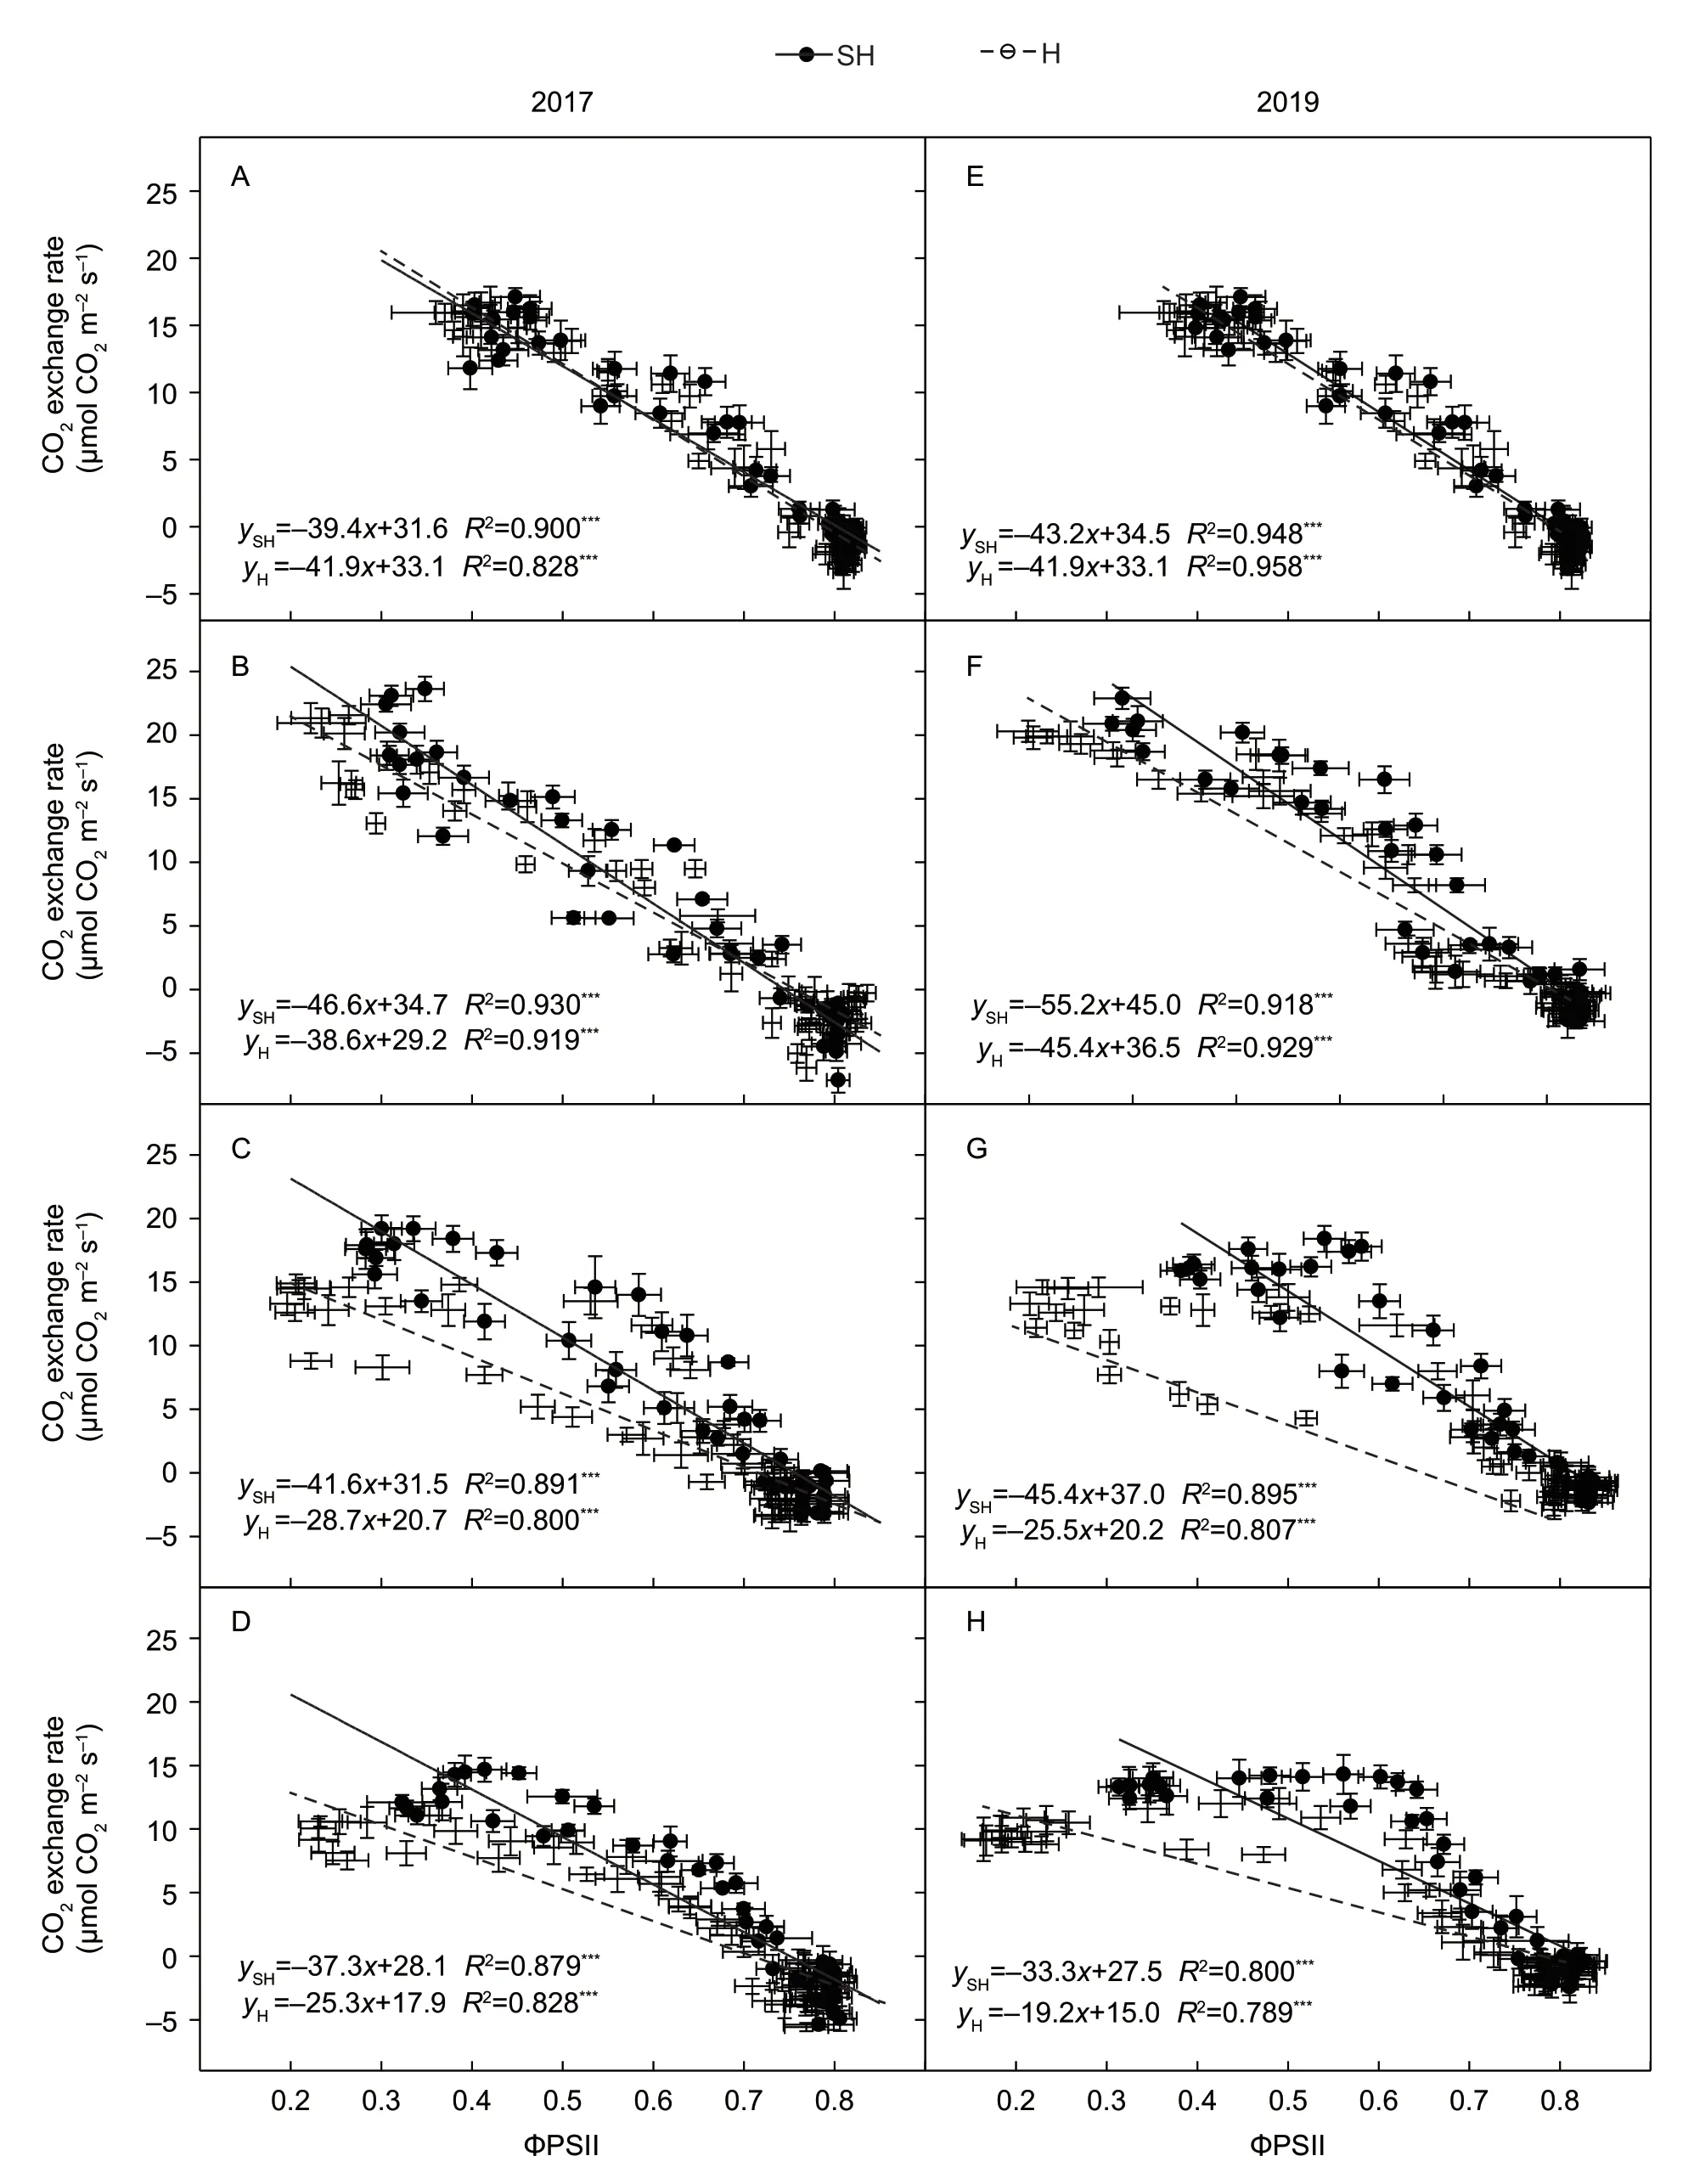
Fig.9 Linear regression between CO2 exchange rate and the quantum yield of PSII (ΦPSII) at 0 (A and E),8 (B and F),16 (C and G),and 24 (D and H) days after anthesis (DAA) under super-high-yield (SH) and high-yiled (H) treatments in 2017 and 2019.The data are the mean±SE of 4–6 independent measurements. The equation in the figure showed the linear equation relationship between CO2 exchange rate (y) and ΦPSII (x),R2 represented determination coefficient. ***,significance at P-level of 0.001.
5.Conclusion
Thein situmeasurement results in this study suggest that the optimized fertilization and irrigation under SH treatment increased the spike number and growth of wheat which resulted in the wheat field forming a better microecosystem for photosynthesis in terms of leaf temperature,soil temperature and humidity under diurnal light and heat stress at noon especially at late grain-filling stage. And the linear correlation of ΦPSII and CO2exchange rate in wheat flag leaves under SH and H treatments provide new insight to evaluate the wheat photosynthesis performance by the quantum yield of PSII under different conditions.Our results provide the new insights for understanding the ecophysiological mechanism of photosynthesis improvement by SH cultivation.
Acknowledgements
We thank Dr.Yin Yan and Senior Engineer Wang Li from Plant Science Facility of the Institute of Botany,Chinese Academy of Sciences for their excellent technical assistance on PTM-48A and MONI-PAM. We thank Mr.Song Wenpin and the staff in Wuqiao Experiment Station of China Agricultural University for assistant in field management and sample preparation. This study was supported by the National Key Research and Development Program of China (2016YFD0300102 and 2016YFD0300105),the Key Research and Development Plan in Shaanxi Province,China (2019NY-054) and the “Western Light” Visiting Scholarship Program,China.
杂志排行
Journal of Integrative Agriculture的其它文章
- Yield gap and resource utilization efficiency of three major food crops in the world -A review
- Reducing maize yield gap by matching plant density and solar radiation
- Cultivar selection can increase yield potential and resource use efficiency of spring maize to adapt to climate change in Northeast China
- Effects of different agricultural treatments on narrowing winter wheat yield gap and nitrogen use efficiency in China
- Determination of soybean yield gap and potential production in Iran using modeling approach and GIS
- Developing a process-based and remote sensing driven crop yield model for maize (PRYM–Maize) and its validation over the Northeast China Plain
