Effects of different agricultural treatments on narrowing winter wheat yield gap and nitrogen use efficiency in China
2021-01-18YAOFengmeiLIQinyingZENGRuiyunSHISiqi
YAO Feng-mei ,LI Qin-ying,ZENG Rui-yunSHI Si-qi
1 College of Earth and Planetary Sciences,University of Chinese Academy of Sciences,Beijing 100049,P.R.China
2 Key Laboratory of Computational Geodynamics,University of Chinese Academy of Sciences,Beijing 100049,P.R.China 3 Zhanjiang Meteorological Bureau,Guangdong 524000,P.R.China
Abstract Under the limited cultivated land area and the pursuit of sustainable agricultural development,it is essential for the safety of grain production to study agricultural management approaches on narrowing the winter wheat yield gap and improving nitrogen use efficiency (NUE) in China. In this study,DSSAT-CERES-Wheat Model is used to simulate winter wheat yield under different agricultural treatments,and we analyze yield gaps and NUE with different management scenarios at regional scales and evaluate the suitable approaches for reducing yield gap and increasing NUE. The results show that,the potential of narrowing yield gap ranges 300–900 kg ha–1 with soil nutrients increase,400–1 200 kg ha–1 with sowing date adjustment and 0–400 kg ha–1 with planting density increase as well as 700–2 200 kg ha–1 with adding nitrogen fertilizer.Contribution rates of management measures of soil nutrients,sowing date adjusting,planting density,and nitrogen fertilizers are 5–15%,5–15%,0–4%,and 10–20%,respectively. Difference in nitrogen partial productivity ranges 3–10 kg kg–1 for soil nutrients,1–10 kg kg–1 for sowing date adjusting,1–5 kg kg–1 for planting density increase,and–12–0 kg kg–1 for adding nitrogen fertilizers,respectively. It indicates that four treatments can narrow yield gap and improve the NUE in varying degrees,but increasing nitrogen fertilizer leads to the decrease of NUE.
Keywords:winter wheat,DSSAT Model,yield gap,nitrogen use efficiency
1.Introduction
The study of yield gap is an effective way to measure regional food production status and available potential of yield increased,and to explore the limiting factors and solutions for regional crop yield (Naabet al.2004; Muelleret al.2012; Menget al.2013). At present,the research on yield gap can be divided into three scales:global or national scale,regional scale and field scale,and the research methods including household survey data,experimental plots and crop models (Beckeret al.2003; Bolinget al.2011; Sunet al.2018). The crop growth simulation model uses the computer to study the inherent principle of crop growth and development,and considers comprehensively the genetic characteristics of crop varieties,climate,soil,and management measures to quantitatively and dynamically describe the crop growth and yield formation process(Joneset al.2003). It can accurately describe the effects of natural resources such as light,temperature and water on the growth and development of crops,and saves a lot of manpower and material resources compared with the traditional estimation methods of yield potential (Lvet al.2017).
In recent years,crop model is generally used to study crop yield gap (Yaoet al.2011,2015; Zhanget al.2015;Wanget al.2020). Grassiniet al.(2011) used maize growth simulation model to analyze the yield gap of the irrigated Corn Belt in the west of the United States. The results showed that the current maize yield was reached the yield potential of model simulation,and the average yield gap is 11% of the potential yield. Liuet al.(2012) used maize model to simulate the potential yield and yield gap of spring maize in Northeast China and explore the limitation of water to increase the maize yield in the region. Wang Jet al.(2012)used the Agricultural Production System Simulator (APSIM)Model to study the contribution of different management and cultivation measures to increase wheat and corn yields based on crop data from typical agricultural meteorological stations in North China. Chenet al.(2011) used the hybridmaize crop model combined with nutrient management to design a combination experiment of sowing date,variety and density. The results showed that corn yield increased by 91% and nitrogen partial productivity was improved as well as achieving high yield and high efficiency of the crop.Luet al.(2015) showed that applying organic fertilizer under late sowing conditions can significantly increase the number of panicles and panicles of winter wheat,and thus increase the yield of winter wheat. Li Het al.(2014) studied the effect of different soil,varieties and other treatments using crop model and sowing date changing on yield in different climate zones. Liet al.(2011) thought different sowing dates and planting densities significantly affected yield and its components of winter wheat. Previous studies mainly focus on the effect of different climate factors and limited agricultural managements on yields. The contribution of different agronomic measures on reducing yield gap and nitrogen utilization efficiency under different managements,especially in regional scales,are not well documented.
The Decision Support System for Agrotechnology Transfer (DSSAT) developed by the International Benchmark Sites Network for Agro-technology Transfer is one of the more widely used models,and it has been fully tested in the world to verify and research applications (Yaoet al.2007;Porteret al.2010). It can comprehensively simulate and analyze the growth and development of various crops and the formation process of yield under different soil conditions,climatic conditions and agronomic practices. In this study,the DSSAT Crop Growth Model is firstly used to simulate potential yield,current yield with traditional management,and available yield with different measures. Then the yield gap between potential yield and available winter wheat yield is analyzed,and the potential of increasing yield and nitrogen use efficiency (NUE) of different technical ways are evaluated at regional scale. This study would be conducted to illustrate suitable management ways to achieve high yield and high efficiency of winter wheat in China.
2.Materials and methods
2.1.Study sites and data
Winter wheat is widely planted in the North China Plain and the middle and lower reaches of the Yangtze River Basin. The entire area account for 84% of the sowing area and about 90% of winter wheat production in China (http://data.stats.gov.cn). The study sites are located in the main winter wheat producing area in China,mainly including Beijing,Hebei,Shandong,Shaanxi,Shanxi,Jiangsu,and Anhui. The study area is mainly plain,with some hills and highlands. Suitable climate and soil conditions are conducive to the growth of winter wheat. The growing period of winter wheat is from the end of September or October in sowing year to June of next year. Based on the distribution of climate resources,the observation integrity and the length of observation time series,47 study sites were selected in main winter wheat area.
The climate data of 47 weather stations were obtained from the National Meteorological Science Data Sharing Service Platform (http://data.cma.cn/). The station data include the daily minimum and maximum temperatures,precipitation and sunshine hours from 1990 to 2015. The daily solar radiation for the model was calculated from the sunshine hours using the Angstrom formula (Blacket al.1954; Jones 1992).
The experiment data on winter wheat phenology (sowing,over-wintering,jointing,anthesis,and maturity dates),cultivar type,management practices (fertilizer,irrigation and planting density),and yield and its components were collected from the National Weather Information Center.The soil data used in the model included soil depth,organic matter content,soil slope,soil texture,permeability,soil bulk density,soil drainage condition,soil profile characteristics,and other data. These data were derived from the China Soil Database.
But one day, as the brothers were as usual doing the honours to their guests, an old man turned to them and said, Yes, it is all most beautiful, but there is still something it needs! And what may that be? A pitcher3 of the water of life, a branch of the tree the smell of whose flowers gives eternal beauty, and the talking bird
2.2.CERES-Wheat Model and validation
The DSSAT was developed by the Department of Agriculture of United States,which is one of the widely used crop models in the globe (Liu H Let al.2011). It can simulate the growth and development of crops day by day. The CERES-Wheat Model in DSSAT used in this study,which is based on plant physiology,can simulate the effects of wheat management and soil nutrient status on its growth,development and the processes of yield formation. In recent years,the CERESWheat Model has been validated and widely used in the evaluation of wheat production (Rinaldi 2004; Denteet al.2008; Thorpet al.2010),and it has also been proved to be applicable for most parts of China (Yuan and Xu 2008;Xu 2014). These studies show that the CERES-Wheat Model can perfectly simulate the growth and development process,attainable yield and potential yield of winter wheat in the study area.
The variety types of winter wheat for calibration and validation of model are shown in Table 1. The variety types include semi-winter,winter and spring winter wheat. Firstly,experiment data with the variety types of winter wheat in one year are used to calibrate the genetic parameters of the varieties,then the experiment data in other years are used to validate the winter wheat model. The input of model includes daily meteorological data (the maximum temperature,the minimum temperature,rainfall,and radiation),soil characteristics and field experiment data.The variety parameters in the model were calculated by the trial and error method. The calibrated genetic parameters of the varieties are applied to simulate anthesis,maturity and yield. Model is validated by comparing the difference between observation and simulation. In this study,the normalized root mean squared error (NRMSE) (Loague and Green 1991) and the index of agreement (D) (Willmott 1982) were mainly used to test the agreement between observation and simulation as follows:

where Siis the simulated value,Miis the observed value,is the average of the observed values,andnis the sample size. When NRMSE<10%,the simulation accuracy is excellent; when 10%
2.3.Simulation scenario settings
Anderson (2010) summarized the main factors influencing the yield gap between the potential yield and the available yield of winter wheat as environment,management measures,varieties,etc. Xuet al.(2013) considered that the main factors affecting the yield and efficiency of wheat in China include soil fertility,nitrogen application rate,sowing date,planting density,irrigation,variety,pest and disease control,and other agronomic measures. Therefore,under local winter wheat varieties and fully irrigation treatment,five groups of simulation scenario settings were designedto study the effects of soil improvement,sowing date,reasonable plant population,and application of N fertilizer on the increasing potential of winter wheat yield.

Table 1 The variety types of winter wheat for calibration and validation of model in seven agrometeorological stations in China
Simulation condition 1:Yields from local varieties and local conventional management measures (soil nutrients,sowing date,sowing density,and nitrogen application rate) as the control yield (Yck,kg ha–1). The local general management measures are set with reference to the previous research results (Zhanget al.2008; Wang S Let al.2012; Yaoet al.2015). The planting density is 3 million plants ha–1,and the nitrogen application amount is 150 kg ha–1. The sowing date of each site is set from early October to late October (Li K Net al.2014). The classification of actual soil nutrient levels at different stations is based on the grading standard in the National Soil Nutrient Content Rating Table for the second national soil survey (http://vdb3.soil.csdb.cn/). Simulation condition 2:The other conditions are the same as the simulation condition 1,only the soil nutrient level of each site is added one nutrient level to the actual soil original level (Liet al.2018). The simulated yield is the available yield under the suitable soil nutrient conditions (Ys,kg ha–1). Simulation condition 3:Assuming that the other conditions are the same as the simulated condition 1,only the sowing date of each site is adjusted to a reference period of 14 to 28 days in advance (Liet al.2018),and the simulated yield is the available yield under the sowing date change (Yd,kg ha–1). Simulation condition 4:The other conditions are the same as the simulation condition 1,and only adjust the planting population at each site to a reference value with 5.2 million plants ha–1(Zhanget al.2016). Within condition 4,the simulated yield is the available yield under the condition of increasing planting density (Ym,kg ha–1). Simulation condition 5:The other conditions are the same as the simulation condition 1,only the nitrogen application amount at each site was adjusted to a reference value with 240 to 360 kg ha–1(Liet al.2018).The simulated yield with condition 5 is the available yield under the condition of nitrogen application increase (Yn,kg ha–1). The five simulation scenarios were shown in Table 2.
2.4.Data analysis
According to the simulated scheme,the yield of the winter wheat simulated under five scenario settings during the period from 1990 to 2015,respectively. The winter wheat yield gap between local yield (control yield,Yck) and various agronomic measures (soil improvement,adjustment of sowing date,reasonable planting density,and application of nitrogen fertilizer) is calculated,respectively. The potential ascension of yield (PAY) represents the difference between local yield and yield with agronomic measures improved.

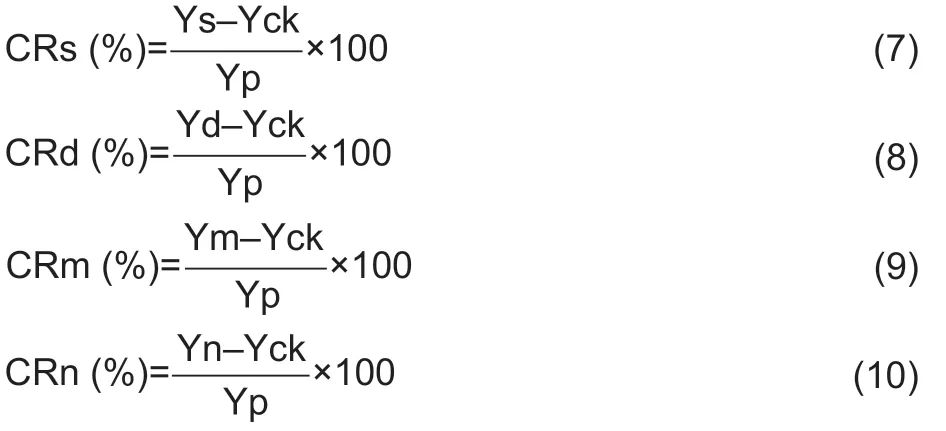
The yield simulated under stress conditions without nutrients,water,pests and diseases is the potential yield of varieties (Yp,kg ha–1). The contribution rate (CR) represents the percentage of crop yield gap with different measures relative to potential yield.
NUE is affected by soil nutrients,meteorological conditions and agronomic measures,and it has a significant regulatory effect on the formation of winter wheat yield and its constituent elements (Ju and Zhang 2003). The partial factor productivity (PFP) is used to evaluate NUE. PFP refers to the ratio of crop yield to fertilizer application amount under a specific fertilizer (Liu X Yet al.2011).

PFPN(kg kg–1)is the partial factor productivity of nitrogen fertilizer under different measures,Y (kg ha–1) is the crop yield of different nitrogen application levels andN (kg ha–1)is the amount of nitrogen fertilizer applied under different measure scenarios. Since all kinds of yield are obtained by changing the corresponding agronomic measures under the conditions of nitrogen fertilizer application,Y represents the available yield under five simulation conditions including Yck,Ys,Ym,Yd,and Yn. The difference in nitrogen fertilizer efficiency (PFPD) is that the difference between the PFP of the control group and the PFP under the conditions of soil improvement,adjusting sowing date,reasonable planting,as well as adding nitrogen fertilizer,respectively. It reflects the degree of influence from different agronomic measures on NUE,and evaluates the approach to improve the NUE.
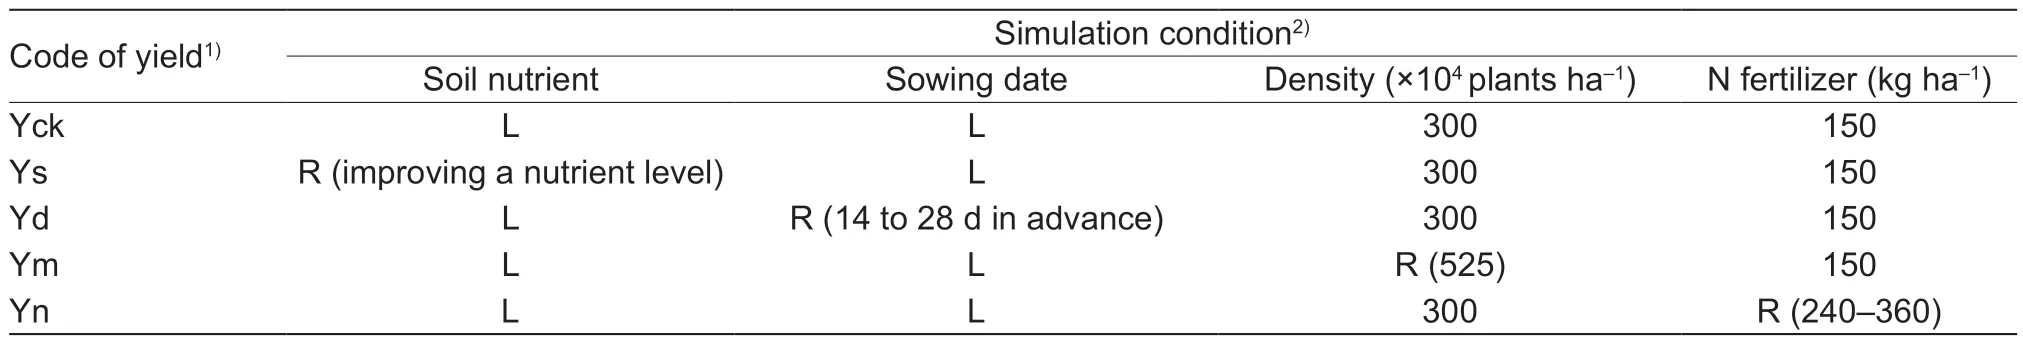
Table 2 Simulating conditions of Decision Support System for Agrotechnology Transfer (DSSAT) Model
3.Results
3.1.Model validation
Comparison between simulated and measured values of anthesis,maturity and yield was shown in Fig.1,and the results of error analysis were shown in Table 3. It can be seen that there is a very significant correlation between the simulated and measured values of anthesis and maturity.R2is more than 0.9 (P<0.01),D value between simulated and measured values is more than 0.7,and the value of NRMSE is less than 5%. There is also a highly significant correlation between simulated grain yield and measured values.R2is more than 0.7 (P<0.01),NRMSE is less than 10% and the D value is close to 1. In general,the simulation is consistent with the observation,which indicates that the model adequately calculating genetic parameters of the varieties is suitable for the simulation of winter wheat.
3.2.Potential yield and attainable yield
Based on simulated scenario settings in Table 2,the spatial distribution characteristics of the potential yield and attainable yield under different management measures are shown in Fig.2. It can be seen that the potential yield of winter wheat presents obvious spatial distribution pattern(Fig.2-A). Potential yield of winter wheat ranges from 7 097 to 13 154 kg ha–1. The low value region is located in the middle and south of Henan Province and most of Anhui Province. The region with potential yield more than 10 000 kg ha–1is mainly distributed in Shaanxi Province,Shanxi Province,the east of Shandong Province,and the northeast of Jiangsu Province.
Yields under local varieties and conventional management measures were shown in Fig.2-B. Yck ranges from 3 000 to 10 200 kg ha–1. The high value areas (above 6 600 kg ha–1) of Yck are mainly distributed in the south of Shaanxi Province,the central of Anhui and Jiangsu provinces. The low value areas (below 4 800 kg ha–1) is in Hebei Province and the east of Shandong Province.

Fig.1 Comparison of simulated value and observed value for the growth stage and yield of winter wheat at seven sites (**,P-value<0.01,n=20).

Table 3 Statistics of comparison results between simulated value and observed value for the growth stage and yields1)

Fig.2 Distribution of potential yield and attainable yield under different management measures in the main winter wheat producing area in China. A,potential yield. B,local yield (Yck). C,attainable yield by improving soil nutrient (Ys). D,attainable yield by adjusting sow date (Yd). E,attainable yield by increasing the planting density (Ym). F,attainable yield with adding nitrogen fertilizer (Yn).
The spatial distribution of the attainable yield Ys by increasing soil nutrients (Fig.2-C) is similar to Yck (Fig.2-B).The high value above 7 300 kg ha–1is mainly in the south of Shaanxi Province,and the yield below 5 300 kg ha–1is in Hebei and Shandong provinces. The attainable yield Yd with changing the sowing date ranges from 3 600 to 1 000 kg ha–1(Fig.2-D). The pattern of low Yd locates in the east of Shandong,and high Yd is in the south of Shaanxi,Anhui and the west of Jiangsu. Attainable yield Ym by adjusting planting density ranges from 3 270 to 9 923 kg ha–1(Fig.2-E).The spatial pattern is also similar to Yck. Ym in the south of Shaanxi Province and the central of Anhui Province is higher than 6 600 kg ha–1,and less than 4 900 kg ha–1in the most of Hebei Province and the east of Shandong Province.The spatial pattern of attainable yield Yn under increasing nitrogen application is ranged from 3 500 to 11 900 kg ha–1(Fig.2-F). The pattern of low Yn is similar to Ys. High Yn in Shaanxi is more than 7 700 kg ha–1,and low Yn in Hebei and Shandong is less than 5 600 kg ha–1.
3.3.Potential ascension of yield
The spatial distribution of the potential ascension of yield(PAY) including PAYs,PAYd,PAYm,and PAYn was shown in Fig.3. Potential ascension of yield also represents the potential of narrowing yield gap under different management scenarios. The larger the value of the PAY under suitable management measures,the greater the extent for increasing winter wheat yield,and the smaller the yield gap between the available yield and potential yield.
The PAY with improving soil nutrients ranges from 300 to 900 kg ha–1(Fig.3-A). PAYs below 300 kg ha–1is mainly distributed in the northwestern part of Anhui Province,the most of Hebei Province and Shandong Province. PAYs above 600 kg ha–1is mainly distributed in the most of Shaanxi Province and southern Jiangsu Province,where the improvement of the soil could greatly reduce the yield gap of winter wheat.
The potential ascension of yield (PAYd) is about 400 to 1 200 kg ha–1by adjusting sow date (Fig.3-B). The low PAYd below 400 kg ha–1is mainly distributed in Shaanxi Province,the eastern Shandong Province and the northeast of Hebei Province. The high PAYd from 800 to 1200 kg ha–1is distributed in Hebei,southern Henan,Jiangsu,and Anhui provinces. It showed that adjusting sowing date is the effectively way to reduce the yield gap of winter wheat in high PAYd areas.
The PAYm ranges from 0 to 400 kg ha–1by increasing the planting density (Fig.3-C). The PAYm in southeastern Shaanxi Province is less increased,and it is basically lower than 400 kg ha–1in the other areas. The potential ascension of yield (PAYn) with adding nitrogen fertilizer is about 700 to 2 200 kg ha–1(Fig.3-D). It indicates that increasing nitrogen fertilizer could greatly narrow yield gap in some areas. The PAYd with below 700 kg ha–1is mainly distributed in the most of Hebei Province,Shandong Province and the northwest of Anhui Province. The high PAYn above 1 400 kg ha–1is located in the south-central of Jiangsu Province and most of the Shaanxi Province. It indicates that increasing nitrogen fertilizer could greatly reduce yield gap of winter wheat compared with other three treatments.

Fig.3 Distribution of potential ascension of yield under different management measures in the main winter wheat producing area in China. A,the potential ascension of yield (PAY) with improving soil nutrient (PAYs). B,the PAY by adjusting sow date (PAYd).C,the PAY by increasing the planting density (PAYm). D,the PAY with adding nitrogen fertilizer (PAYn).
3.4.Contribution rate of management measures to narrowing yield gap
The contribution rates of four different treatments to narrow yield gap (CRs,CRd,CRm,and CRn) are presented in Fig.4. The distribution for contribution rate of improving soil nutrient to reducing yield gap shows obvious spatial distribution characteristics (Fig.4-A). The CRs is below 5%in most areas of winter wheat,and it is higher than 10–15%only in Shaanxi Province and the southern Jiangsu Province.
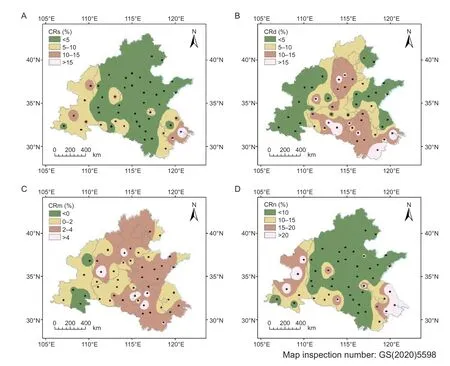
Fig.4 Contribution rates of different management measures to narrow yield gap in the main winter wheat producing area in China.A,contribution rate (CR) of improving soil nutrient (CRs). B,CR of adjusting sowing date (CRd). C,CR of increasing planting density (CRm). D,CR of increasing nitrogen fertilizer (CRn).
The contribution rate of adjusting sowing date to reducing yield gap shows in Fig.4-B. The CRd below 5% mainly distributed in the west areas and the east areas of winter wheat areas including Beijing,the northwest of Shanxi Province,the east of Shandong Province,and the most of Shaanxi Province. The CRd ranged 10–15% is mainly distributed in the central areas of winter wheat areas,including southwestern Hebei Province,southern Henan Province and Anhui Province.
The contribution rate of increasing planting density to narrow yield gap is very low,and it is mainly ranged 0–4%(Fig.4-C). The contribution rate of increasing nitrogen fertilizers is less than 10% in most areas (Fig.4-D). The CRn above 10–20% is distributed in the south of Henan Province,the east side of Anhui and Jiangsu provinces and most area of Shaanxi Province.
3.5.Difference in nitrogen partial productivity
The difference in NUE of different measures reflects the extent of the effect from the different scenarios on nitrogen fertilizer efficiency. The spatial distribution of difference in NUE under different agronomic measures is presented in Fig.5. A positive value means an increase in NUE,and a negative value means a decrease in NUE.
Compared with current conventional management measures,soil improvement,adjustment of sowing date,and adding planting density could increase the efficiency of nitrogen fertilizer utilization,while the increase of nitrogen fertilizer make the efficiency of nitrogen fertilizer decrease.The PFPDs with 3–10 kg kg–1is mainly distributed in Shaanxi,Shanxi and Jiangsu. The PFPDs below 3 kg kg–1are mainly distributed in other areas including Hebei,Shandong,Henan,and west side of Anhui.
The PFPDs with 6–10 kg kg–1is mainly distributed in Hebei,the south and central of Henan,the southern Jiangsu,and Anhui. The PFPDs ranging between 1 to 6 kg kg–1is mainly distributed in Shandong and Shanxi. The PFPDm below 1 kg kg–1is mainly distributed in Shaanxi and between 3–7 kg kg–1is distributed in other areas. The PFPDn is negative in winter wheat areas,which indicates the increase in N fertilizer application could result in a decrease of NUE.The PFPDn below–12 kg kg–1is mainly distributed in the southern Shaanxi. The PFPDn between–6 and 0 kg kg–1are mainly in the north of Anhui and the west of Shandong.The PFPDn range between–12 and–6 kg kg–1distributed in other most areas.
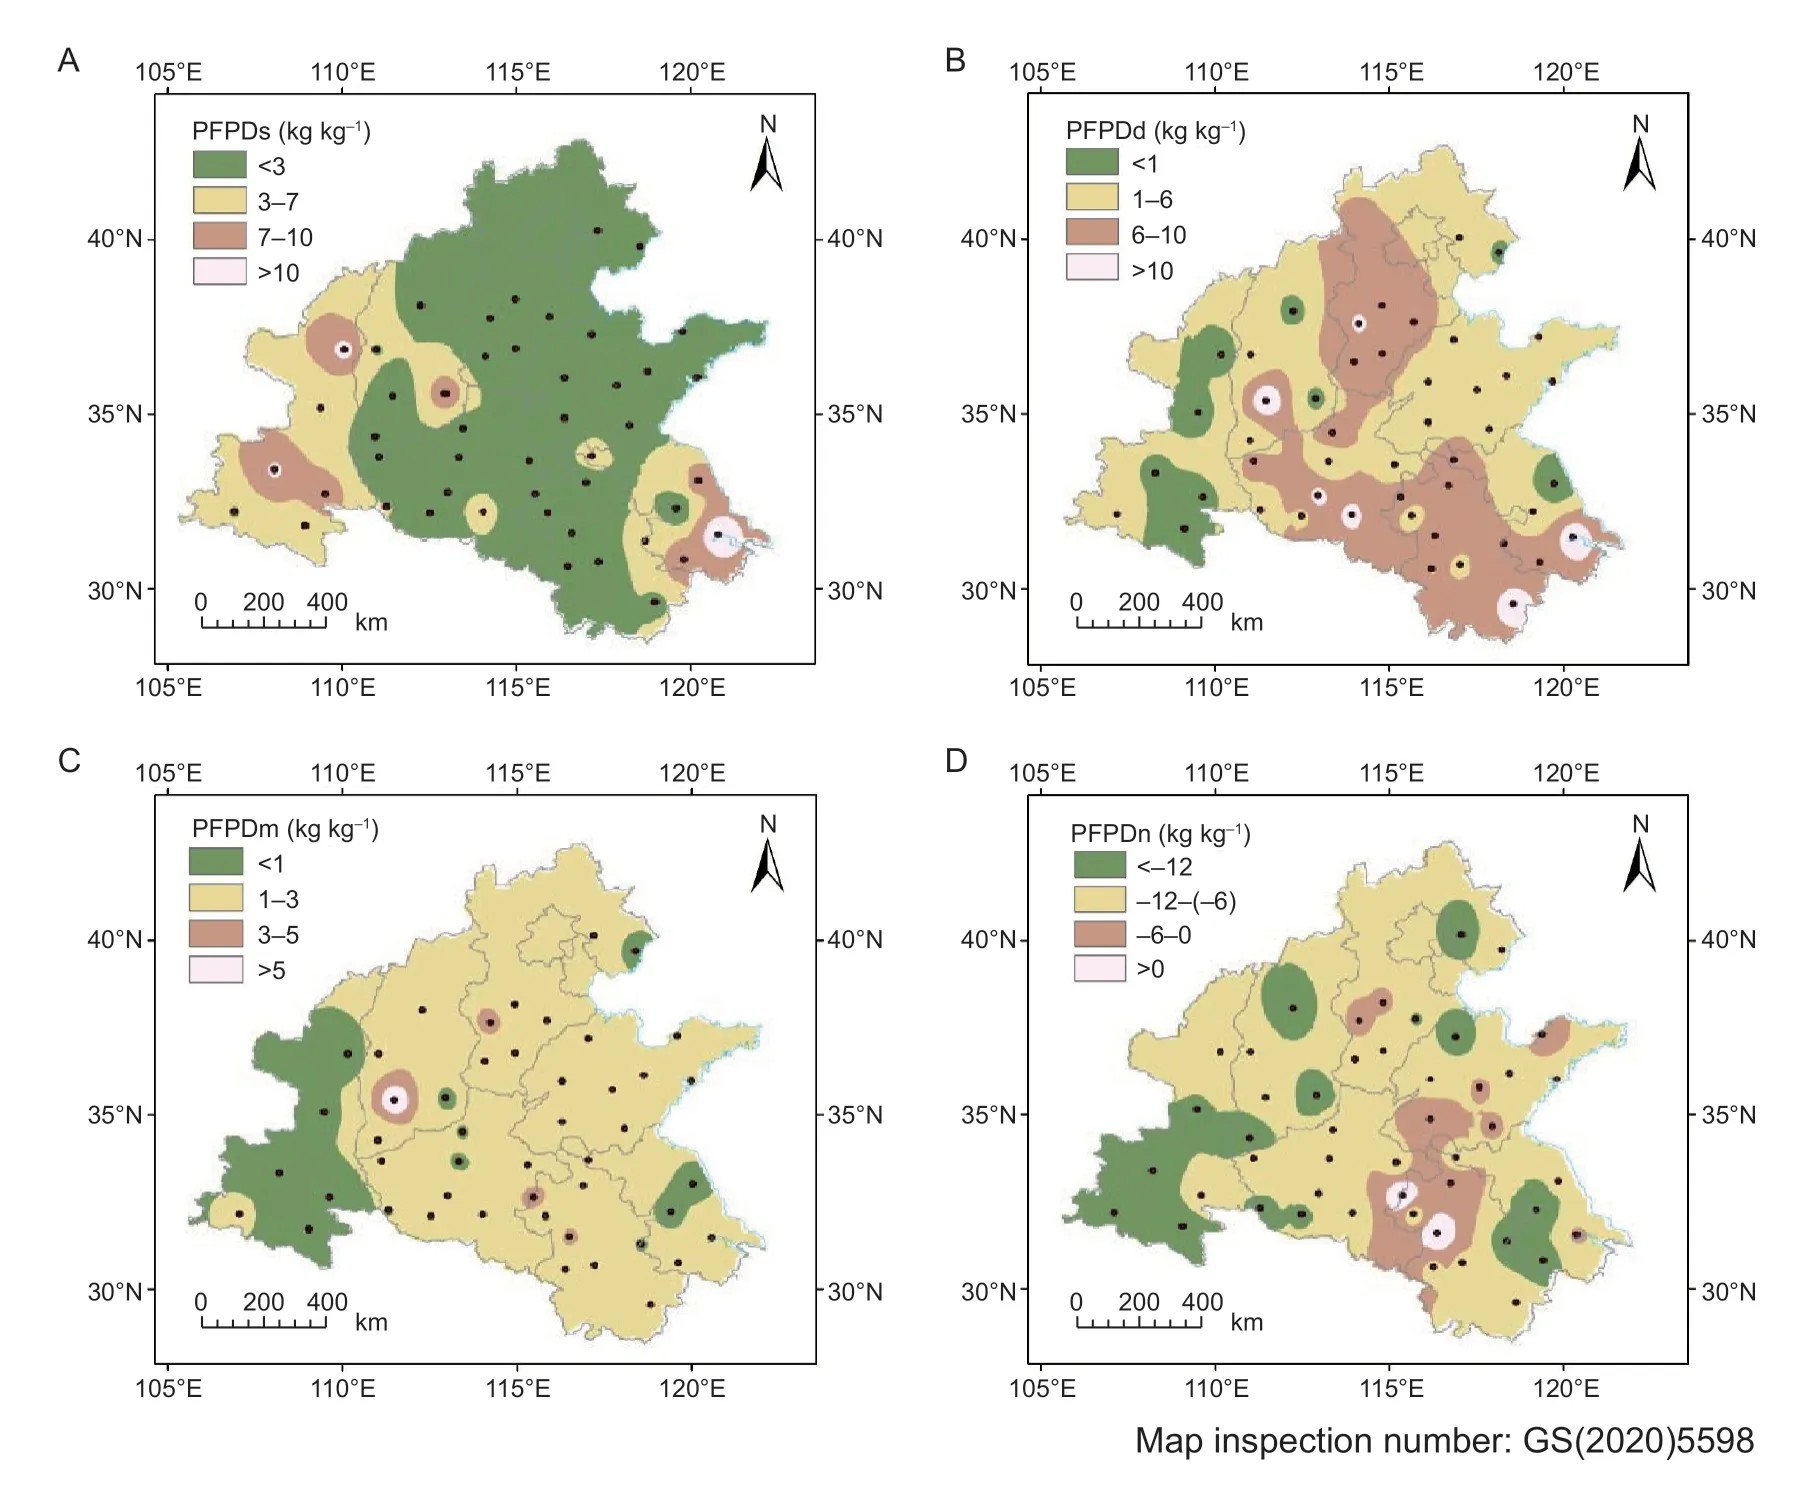
Fig.5 Difference in nitrogen partial productivity under different management measures in the main winter wheat producing area in China. A,difference in nitrogen partial productivity (PFPD) of improving soil nutrient (PFPDs). B,PFPD of adjusting sowing date(PFPDd). C,PFPD of increasing planting density (PFPDm). D,PFPD of increasing nitrogen fertilizer (PFPDn).
4.Discussion
Narrowing yield gap by suitable agricultural managements is very important to improve current winter wheat yields(Yang and Liu 2014). In this study,the spatial distribution of the potential yield of winter wheat obtained is consistent with the analysis results in the Huang-Huai-Hai region by Liuet al.(2013) using the DSSAT Model,but it is lower than the value of potential yield analyzed by Wanget al.(2010),using Agricultural Ecological Zoning (AEZ) Model. In the two scenarios with increasing planting density and amount of nitrogen,the appropriate amount of nitrogen determined is higher than the value determined under field test conditions by Zhaoet al.(2011),and the reference planting density in this study is larger than the values obtained by Caoet al.(2011) under high yield field experiment. Thus,the simulation yields could reasonably reflect the actual yields of winter wheat under a certain management measure,although there is the difference between the simulation results and the field experiments due to the influence of soil conditions,fertilization methods and fertilization time at each site. Increasing soil nutrient,adjusting sowing time,adding nitrogen fertilizer,and reasonable planting density can improve the yield of winter wheat with different extents.Increasing nitrogen fertilizer can enhance winter wheat yield,but the efficiency of nitrogen fertilizer production is very low. It indicates nitrogen fertilizer increased is not the effective approach to improve high yield and high efficiency.Soil nutrient improvement,adjustment of sowing time and reasonable planting density can improve the efficiency of nitrogen fertilizer production in most areas. It is in accordance with the results obtained through the household survey and field experiment by Zhaoet al.(2016).
However,due to the uncertainty of the model and the complexity of the actual situation,this study does not consider the effects of diseases and insect pests,phosphorus and potassium fertilizers on the yield of winter wheat. In the future,it should be combined with many field experiments and several simulation results to analyze the effect of cultivation management measures on winter wheat yield in regional scale. This study only considers the effect of single factor on yield and NUE. The effects of combined various agronomic measures on reducing yield gap and improving the efficiency of resource utilization should be considered in future study.
5.Conclusion
Results of this study shows that the distribution pattern of yield with different levels vary from different regions.When give priority to the potential of narrowing yield gap,the order of proper measures adopted to reduce the yield gap is firstly nitrogen fertilizer increase,and sowing date adjustment in Hebei,Shandong and the mid-west of Anhui.The second is sowing date adjustment in most areas,and soil nutrient improvement in Shaanxi. The third is soil nutrient improvement and the fourth is planting density increase. The contribution of nitrogen fertilizer increase to narrow yield gap is primary,soil nutrient improvement and planting density adjustment is secondary. Compared with other conditions,the effect of increasing the planting density on increase potential is weak in regional scale. Soil nutrient improvement and sowing time adjustment not only increase winter wheat yield,but also enhance the use efficiency of nitrogen fertilizer. Thus,considering the priority of the efficiency of nitrogen fertilizer,soil nutrient improvement and sowing time adjustment should be primary considered to narrow yield gap.
Acknowledgements
This study was financially supported by the National Key Research and Development Program of China(2016YFD0300110,2016YFD0300101),the National Natural Science Foundation of China (31671585,41871253)and the Natural Science Foundation of Shandong Province,China (ZR2017ZB0422).
杂志排行
Journal of Integrative Agriculture的其它文章
- Closing crop yield and efficiency gaps for food security and sustainable agriculture
- lmproving maize grain yield by formulating plant growth regulator strategies in North China
- lmproving winter wheat grain yield and water-/nitrogen-use efficiency by optimizing the micro-sprinkling irrigation amount and nitrogen application rate
- Effects of deep vertical rotary tillage on the grain yield and resource use efficiency of winter wheat in the Huang-Huai-Hai Plain of China
- Effects of mechanized deep placement of nitrogen fertilizer rate and type on rice yield and nitrogen use efficiency in Chuanxi Plain,China
- lmproving grain yield,nitrogen use efficiency and radiation use efficiency by dense planting,with delayed and reduced nitrogen application,in double cropping rice in South China