Cultivar selection can increase yield potential and resource use efficiency of spring maize to adapt to climate change in Northeast China
2021-01-18SUZhengLlUZhijuanBAIFanZHANGZhentaoSUNShuangHUANGQiuwanLIUTaoLlUXiaoqingYANGXiaoguang
SU Zheng-e,LlU Zhi-juan,BAI Fan,ZHANG Zhen-tao,SUN Shuang, ,HUANG Qiu-wan,LIU Tao,LlU Xiao-qing,YANG Xiao-guang
1 College of Resources and Environmental Sciences,China Agricultural University,Beijing 100193,P.R.China
2 Chinese Academy of Meteorological Sciences,Beijing 100081,P.R.China
Abstract Northeast China (NEC) is one of the major maize production areas in China. Agro-climatic resources have obviously changed,which will seriously affect crop growth and development in this region. It is important to investigate the contribution of climate change adaptation measures to the yield and resource use efficiency to improve our understanding of how we can effectively ensure high yield and high efficiency in the future. In this study,we divided the study area into five accumulated temperature zones (ATZs) based on growing degree days (GDD). Based on the meteorological data,maize data (from agrometeorological stations) and the validated APSIM-Maize Model,we first investigated the spatial distributions and temporal trends of maize potential yield of actual planted cultivars,and revealed the radiation use efficiency (RUE) and heat resource use efficiency (HUE) from 1981 to 2017. Then according to the potential growing seasons and actual growing seasons,we identified the utilization percentages of radiation (PR) resource and heat resource (PH) for each ATZ under potential production from 1981 to 2017. Finally,we quantified the contributions of cultivar changings to yield, PR and PH of maize. The results showed that during the past 37 years,the estimated mean potential yield of actual planted cultivars was 13 649 kg ha–1,ranged from 11 205 to 15 257 kg ha–1,and increased by 140 kg ha–1 per decade. For potential production,the mean values of RUE and HUE for the actual planted maize cultivars were 1.22 g MJ–1 and 8.58 kg (°C d)–1 ha–1. RUE showed an increasing tendency,while HUE showed a decreasing tendency. The lengths of the potential growing season and actual growing season were 158 and 123 d,and increased by 2 and 1 d per decade. PR and PH under potential production were 82 and 86%,respectively and showed a decreasing tendency during the past 37 years. This indicates that actual planted cultivars failed to make full use of climate resources. However,results from the adaptation assessments indicate that,adoption of cultivars with growing season increased by 2–11 d among ATZs caused increase in yield,PR and PH of 0.6–1.7%,1.1–7.6% and 1.5–8.9%,respectively. Therefore,introduction of cultivars with longer growing season can effectively increase the radiation and heat utilization percentages and potential yield.
Keywords:APSIM,maize,potential yield,radiation use efficiency,resource utilization percentage,cultivar selection
1.Introduction
China is the second largest maize producer in the world.The grain production of maize accounts for 30–40% of the nation’s grain yield (NBSC 2017). Northeast China(NEC) is one of the major production areas for commercial food grains. The planted areas and production of maize in NEC accounts for 30% of the nation’s total (Li 2009;NBSC 2020). On the other hand,during the past 50 years,China has experienced a warming and drying trend. The growing degree days (GDD) have clearly increased while sunshine hours and precipitation have decreased during the crop growing season (Yanget al.2011). NEC is the most susceptible area to climate change in China. GDD during the crop growing season have increased,the sunshine hours and precipitation have decreased. Moreover,the starting date of the potential growing period was advanced and the ending date was delayed,and sunshine hours and precipitation have decreased since the 1980s (Ninget al.2015; Zhao J Fet al.2015c). Thus,the length of the potential growing season for thermophilic crops prolonged (He and Guo 2011). Climate change has directly affected maize production. The potential maize yields will decrease if no adaptive measures are taken (Lvet al.2013; Zhao 2015; Liuet al.2018). Previous studies have shown that maize yields would decrease by 4–22% for each 1°C increase in growingseason mean temperature,mainly because warming trend shortened the entire maize growing period by 2.3–4.8 d per decade from 1981 to 2007 (Liuet al.2013).
The asynchrony in the change of agricultural resources and yields has caused changes in resource use efficiency.From 1951 to 2100,if the adaptation measures of climate change haven’t been taken,the use efficiency of climate resources would show a decreasing trend,and regions with the highest resource use efficiencies moved northeastward in NEC (Yuan 2012; Xu 2014). In Heilongjiang Province,the potential of heat use efficiency (HUE) decreased 0.025 kg ha–1°C–1yr–1from 1987 to 2017 (Zhaoet al.2019).Agricultural climate resources will continue to change in the future in NEC (Zhenget al.2017). It is important to increase the use efficiency of climate resources to achieve maize production with high yield and high efficiency. In order to reverse the negative effects of climate change,many adaptation measures have been proposed; for example,selecting new maize cultivars (Chenet al.2013),choosing proper sowing dates (Chenet al.2014; Yinet al.2016),transforming single cropping system into double cropping system in those areas with sufficient heat resources (Guoet al.2015),and moving the planting boundaries of middleand late-maturity spring maize northward (Wang P Jet al.2015; Liet al.2016)
In spite of the studies mentioned above,there is little evidence relating the effects of cultivar selection on the maize production and radiation use efficiency (RUE) and HUE in NEC. The Agricultural Production Systems Simulator(APSIM) has proven to be an effective tool to investigate the crop productivity under various environments (Keatinget al.2003; Liuet al.2012,2018; Lvet al.2013). Therefore,we used the APSIM Model to determine the contribution of cultivar selections to yield in NEC. The objectives of this study are to (1) identify geospatial gradients and temporal trends of potential yields,RUE and HUE of actual planted maize cultivars; (2) determine the utilization percentage of radiation and heat resources of actual planted maize cultivars; and (3) identify the contributions of cultivars selection to maize yield and utilization percentages of the radiation and heat resources,and determine the cultivar changing measures to adapt to climate change in NEC.
2.Materials and methods
2.1.Study region and sites
In our study,we defined the areas with annual accumulated temperature above 10°C greater than 2 100°C d as the potential planting areas of spring maize. Including the middle and south areas of Heilongjiang Province,Jilin and Liaoning provinces,China (Fig.1). Based on the GDD(Ramankuttyet al.2002),which is a fundamental variable for maize growth,we divided the study region into five accumulated temperature zones (ATZs,Liuet al.2016).Accordingly,these region names,characteristics and meteorological stations included in each ATZ are shown in Table 1,and the distribution of ATZs and meteorological stations are shown in Fig.1.
2.2.Climate,crop and soil data
Climatic data including daily maximum and minimum air temperatures,precipitation,sunshine hours,average wind speed,average air pressure,and relative humidity are available from 1981 to 2017 at each meteorological station,were obtained from the China Meteorological Administration Climate Data-sharing Service System. Sunshine duration was converted into daily solar radiation using the Penman-Monteith formulas (Allenet al.1998):
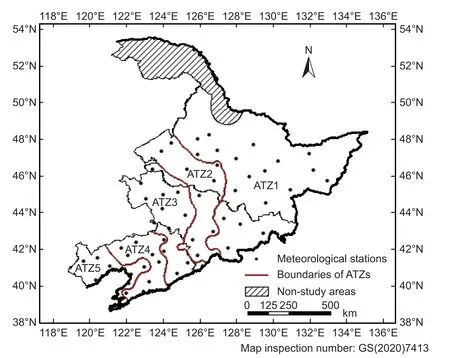
Fig.1 The locations selected for simulation of maize potential yield in Northeast China (NEC).

Table 1 Region name,characteristics of growing degree days (GDD),areas covered and the meteorological stations included in five accumulated temperature zones (ATZs) in Northeast China
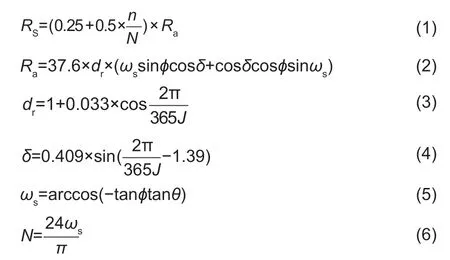
whereRSis the solar radiation (MJ m–2d–1),nis the actual sunshine duration (h),Nis the maximum possible duration of sunshine or daylight hours (h),Rais the extraterrestrial radiation (MJ m–2d–1),dris the inverse of the relative Earth–Sun distance,ωsis the sunset hour angle (rad),ϕis the latitude,δis solar decimation (rad),andJis the number of the days in the year from 1 (1 January) to 365 or 366 (31 December).
The experiment data on maize phenology (sowing,emergence,flowering,and maturity dates),cultivar type,aboveground dry matter,yields,and management practices,were obtained from 45 local agricultural meteorological experiment stations. Crop management practices at the experiment stations included sowing dates,sowing densities,depths,fertilizer,and irrigation. We used the crop data to calibrate the APSIM-Maize Model,which was used to simulate the potential maize yields in this study.
The soil data used in this study including the layered soil bulk density (BD),drained upper limit (DUL),15 bar lower limit (LL15),and the saturated volumetric water content(SAT),were obtained from local agricultural meteorological experimental stations and from the China Soil Scientific Database (CSSD).
2.3.Crop modeling and simulation
In our previous work,APSIM-Maize Model was calibrated and used in NEC for simulating the growth and yield of maize(Liuet al.2012). In this study,we rely on previous model validation work to ensure model performance. In this study,we assumed that the maize cultivars did not change in each decade. First,based on the experimental data,we obtain maize parameters for all accumulated temperature zones(ATZs) in the 1980s,1990s and 2000s. Then APSIM-Maize Model was run with historical climate data (1981–2017) to quantify the potential yield in NEC. For each ATZ,sowing dates were set to the average value of the maize experiment data,sowing density was 90 000 plants ha–1and kept constant throughout the simulation. For potential yields,we aimed to eliminate the effect of water and nutrient stress on simulated maize yield,so water applications were set equal to the water use of the maize crop and nutrient inputs were taken as non-limiting.
2.4.Data analysis
RUE,is usually defined as the micromoles of dry matter produced per mole of photosynthetically active photons absorbed by green canopy components (Sinclairet al.1989).In this study,we use the RUE to describe the efficiency of plants when converting solar radiation into organic carbon(Monteith 1972). RUE was calculated using the following formula:

where RUE is the radiation use efficiency (g MJ–1),Y is the potential maize yield (kg ha–1) that was simulated by the APSIM-Maize Model,and∑Qparis the total incident photosynthetically active radiation per m2during the maize growing season (MJ m–2); we calculatedQparas 50% of the solar radiation.
HUE is defined as the amount of biomass or economic yield accumulated for every 1°C d (Cui 2001). In the APSIMMaize Model,heat resources are evaluated by daily thermal time (ΔTT). In our study,we calculated the HUE as the quotient of the potential yield and the accumulated daily thermal time during the maize growing season. HUE was calculated using following formula:

where HUEis the heat use efficiency (kg (°C d)–1ha–1) and∑ΔTTis the accumulated daily thermal time during the maize growing season (°C d). The daily thermal time in the model was calculated using following formula (Wilsonet al.1995):

whereTais the daily average air temperature (°C).
To understand how much of the radiation and heat resources have been used in the production of maize in NEC,we defined the utilization percentages of the radiation and heat resources (PRandPH) as evaluation indicators to describe the effective resource rates.PRandPHare calculated using the following formulas:

wherePRandPHare the utilization percentages of the radiation and heat resources (%),respectively.∑QAGSand∑QPGSare the total intercepted photosynthetically active radiation values (MJ m–2) during the actual growing season(AGS) and potential growing season (PGS).∑ΔTTAGSand∑ΔTTPGSare the accumulated daily thermal time (°C d)during the AGS and PGS. PGS is determined by the starting and ending dates with the average air temperature steadily above 10°C; we used the five-day moving-average method to calculate the starting and ending dates of PGS (Chenet al.2012; Zhao Jet al.2015).
To understand how many the yields,PRandPHcan be increased after changing cultivars,we calculated the contributions to yield (CY),PRandPH(CPRandCPH) using eqs.(12),(13) and (14),as below:
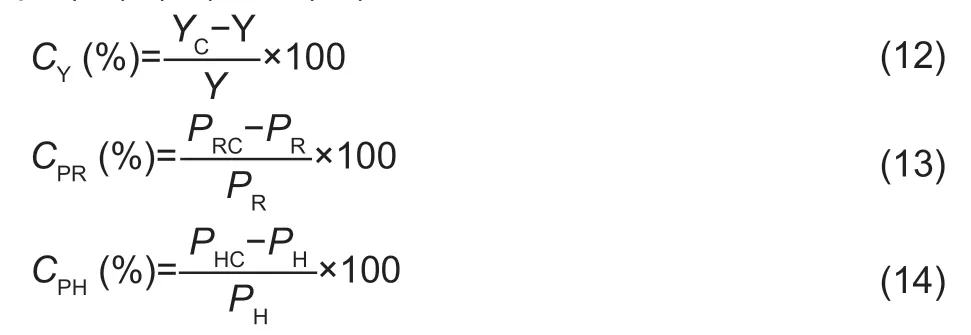
whereCY,CPRandCPHare the contributions of cultivars selection to yield (%),and the utilization percentages of the radiation resources (%) and heat resources (%),respectively.YC,PRCandPHCare the simulated potential yield (kg ha–1),the utilization percentages of the radiation resource (%) and heat resource (%) after changing maize cultivars,respectively.
Linear regression analysis was used to detect trends in potential yield,RUE,HUE,PR,andPH. The slope of the linear regression line against time was evaluated using Student’st-test at 95 or 99% confidence levels.
3.Results
3.1.The geospatial and temporal trends of potential yield,RUE and HUE of actual planted maize cultivars in NEC
The mean potential yield of the actual planted cultivars was 13 649 kg ha–1averaged over NEC during 1981–2017(Fig.2-A). Among the locations,mean potential yields ranged from 11 205 to 15 257 kg ha–1. The potential yields decreased from west to east in NEC. From ATZ1 to ATZ5,the mean potential yields were 13 335,13 877,13 690,13 373,and 14 335 kg ha–1,respectively. The zones with potential yields greater than 14 000 kg ha–1were located in Bei’an,Hailun,Suihua,and their western areas of ATZ1;Fuyu,Qiqihar of ATZ2; Qian’gorlos,Qian’an,Changling,Suihua and their western area of ATZ3; Zhangwu,Anshan,Yingkou,Xiongyue,and their western areas of ATZ4 and ATZ5. The zones with potential yields lower than 13 000 kg ha–1were located in Fujin,Suifenhe,Jiaohe,Dunhua,and Yanji of ATZ3 and Kuandian,Dandong and Xiuyan of ATZ4,where the radiation and heat resources were relatively insufficient for maize production. Averaged across NEC,the potential yield of the actual planted maize cultivars increased 140 kg ha–1per decade from 1981 to 2017 (Fig.2-B). The temporal trends obviously differed among locations ranged from–459 to 911 kg ha–1(10a)–1. From ATZ1 to ATZ5,the potential yields increased by 199,126,81,233,and 24 kg ha–1per decade,respectively. The potential yields of ATZ1 and ATZ4 showed the highest increasing trends and most locations were statistically significant (P<0.05).The locations with the potential yields increased more than 400 kg ha–1per decade were Fujin,Hulin and Yanji of ATZ1;Shuangliao of ATZ3; Zhuanghe and Benxi of ATZ4.
Based on the potential yields simulated by the APSIMMaize Model and radiation and heat resources during the growing seasons,we calculated the RUE and HUE under potential production. The mean RUE for the actual planted maize cultivars was 1.22 g MJ–1averaged over NEC during 1981–2017 (Fig.3-A). Among the various locations,the mean RUE ranged from 1.06 to 1.34 g MJ–1. From ATZ1 to ATZ5,the mean RUE values were 1.23,1.19,1.22,1.22,and 1.22 g MJ–1,respectively. Among the ATZs,the mean RUE values showed no obvious differences. The zones with RUE greater than 1.30 g MJ–1were located in Baoqing,Jiamusi,Yilan,and Mudanjiang of ATZ1 and Qian’an of ATZ2. The zones with RUE lower than 1.10 g MJ–1were located in Suifenhe and Donggang of ATZ1 and Fuyu of ATZ2. Averaged across NEC,the RUE under potential production increased by 0.01 g MJ–1per decade during 1981–2017 (Fig.3-B). Among the various locations,the temporal trends of RUE ranged from–0.03 to 0.04 g MJ–1(10a)–1. In ATZ1–ATZ3,the RUE increased by 0.01,0.02 and 0.02 g MJ–1per decade,respectively. The RUE decreased by 0.01 g MJ–1per decade in ATZ1. In ATZ5,the RUE showed no clear changes. From 1981 to 2017,the temporal trends of RUE showed no significant differences among the ATZs. For most locations in the north of NEC,RUE showed increasing trends that were statistically significant (P<0.05),while for most locations in the south of NEC,RUE showed decreasing trends.
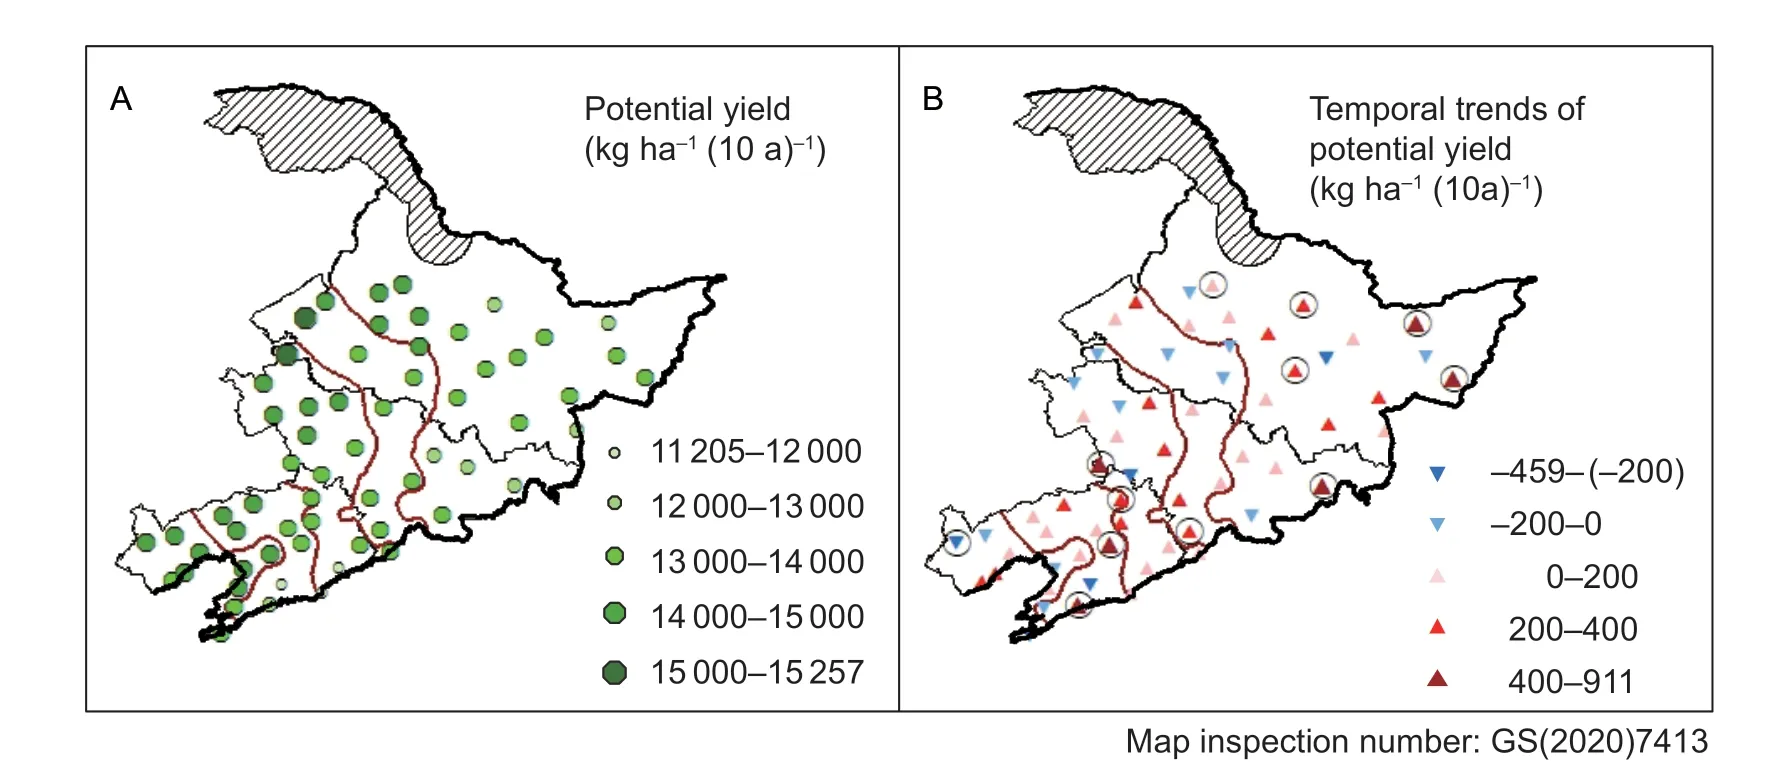
Fig.2 Geospatial (A) and temporal (B,black circles indicate significance at P<0.05) trends of the potential yields of spring maize in Northeast China during 1981–2017.
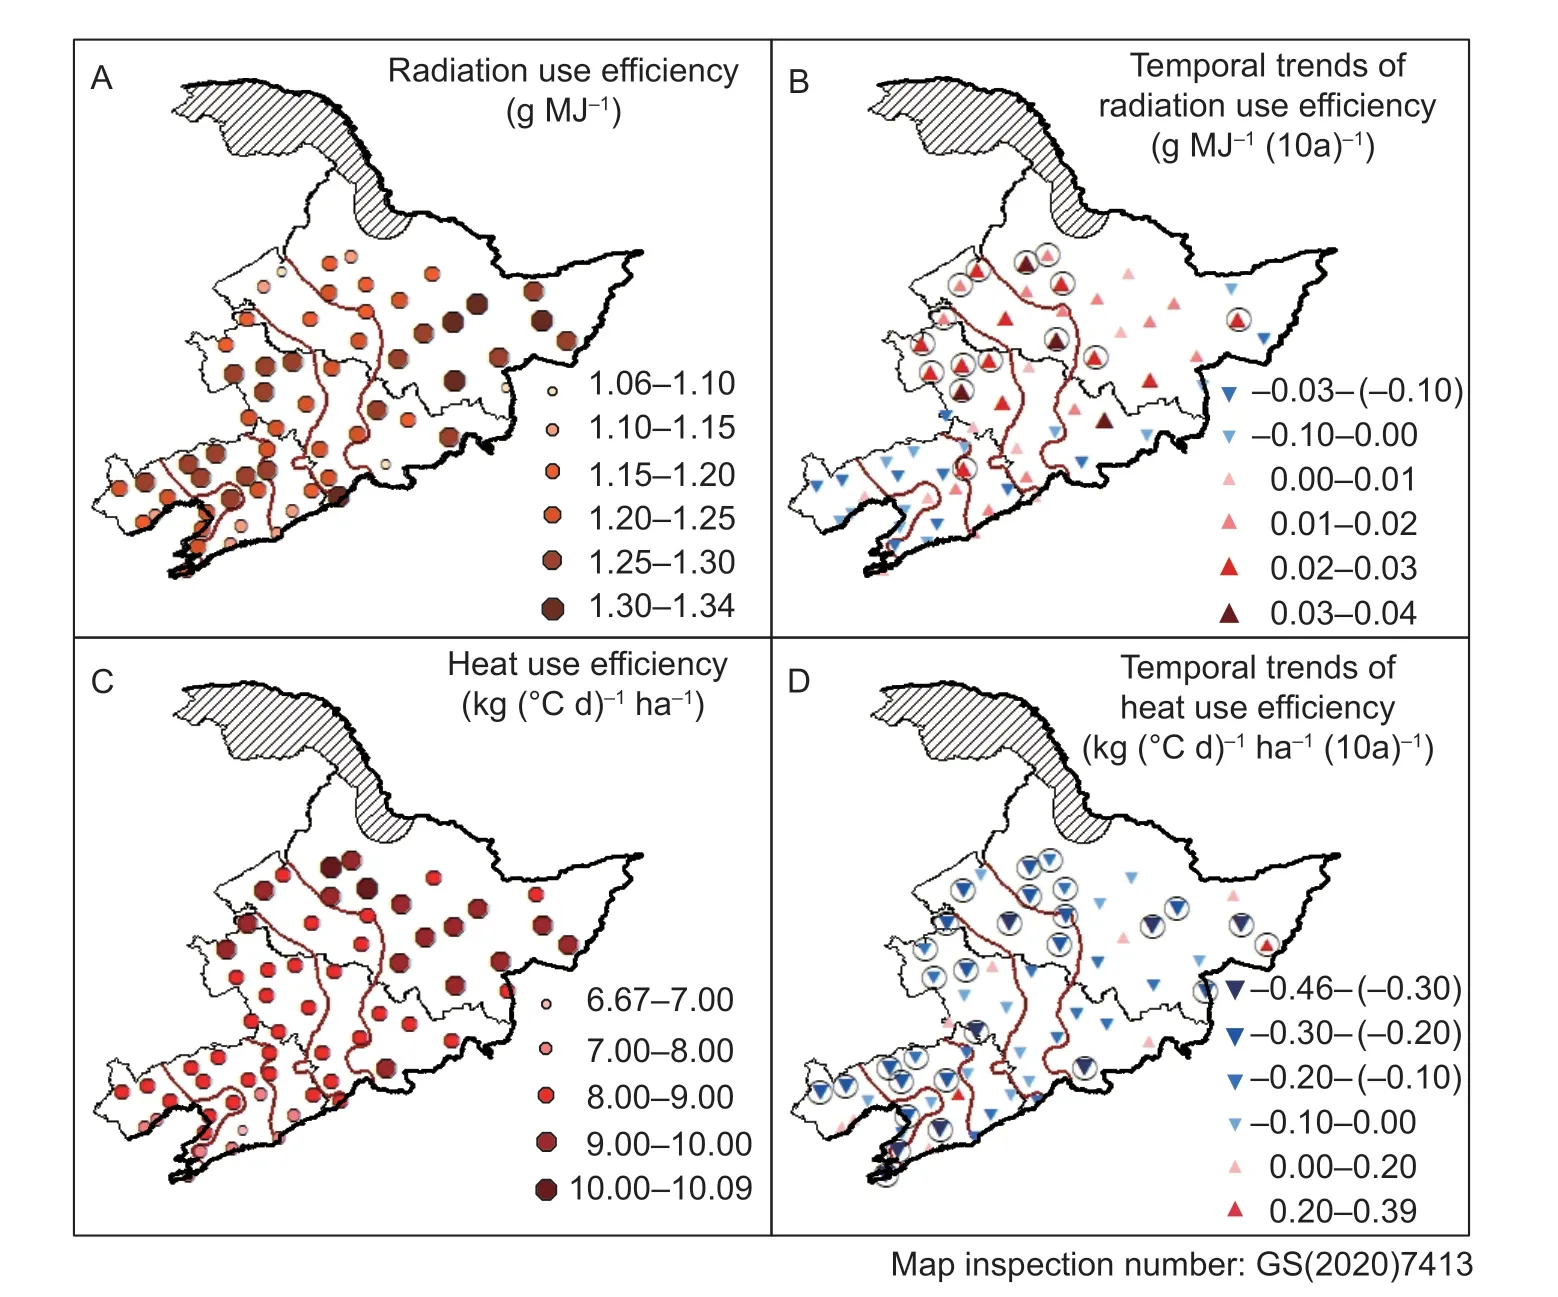
Fig.3 Geospatial and temporal trends of radiation use efficiency (A and B) and heat use efficiency (C and D) of spring maize under the potential condition in Northeast China during 1981–2017. Black circles in B and D indicate significance at P<0.05.
The mean HUE value for actual planted maize cultivars was 8.58 kg (°C d)–1ha–1averaged across NEC during 1981–2017 (Fig.3-C). Among the various locations,the mean HUE ranged from 6.67 to 10.09 kg (°C d)–1ha–1. The HUE decreased from north to south in NEC. From ATZ1 to ATZ5,the HUE values were 9.23,8.59,8.37,7.91,and 8.13 kg (°C d)–1ha–1,respectively. Among the ATZs,the RUEs showed obvious differences. The RUE for ATZ1 was the greatest and the value of ATZ4 was the lowest.This was because the heat resources of ATZ1 were lower than those of other ATZs’,while the potential yield was nearly equal to other ATZs’. The zones with HUE values greater than 9.00 kg (°C d)–1ha–1were located in Hulin,Jixi,Shangzhi,and its north areas of ATZ1,and Qiqihar,Tailai and Baicheng of ATZ2 and ATZ3. The zones with HUE values lower than 8.00 kg (°C d)–1ha–1were located in Kuandian,Benxi,Xiuyan,Wafangdian,and south areas of ATZ3 and ATZ4 and Suihua and Xingcheng of ATZ5. The HUE showed significant (P<0.05) decreasing tendency in most locations in NEC (Fig.3-D). Averaged across NEC,the HUE decreased by 0.15 kg (°C d)–1ha–1per decade from 1981 to 2017. Among these locations,the temporal trends of HUE ranged from–0.46 to 0.39 kg (°C d)–1ha–1(10a)–1.From ATZ1 to ATZ5,the HUE decreased by 0.13,0.19,0.13,0.17,and 0.14 kg (°C d)–1ha–1per decade,respectively.The highest values of temporal trends of HUE (greater than 0.3 kg (°C d)–1ha–1(10a)–1) were located in Baoqing,Yilan and Donggang of ATZ1; Anda of ATZ2; Siping of ATZ3;Xiuyan and Wafangdian of ATZ4; and Dalian of ATZ5.
3.2.The geospatial and temporal trends of the utilization percentages of the radiation and heat resources of actual planted maize cultivars in NEC
The mean length of PGS (LPGS) was 158 d averaged across NEC during 1981–2017 (Fig.4-A). Among the various locations,LPGS ranged from 126 to 193 d. The LPGS increased from northeast to southwest of NEC. From ATZ1 to ATZ5,the LPGS values were 140,150,161,175,and 184 d,respectively. Averaged across NEC,the LPGS increased by 2 d per decade from 1981 to 2017 (Fig.4-B),and this trend was significant (P<0.05) in most of northern locations in NEC. From ATZ1 to ATZ5,the LPGS increased by 3,3,2,0,and 1 d per decade,respectively. Averaged across NEC,the mean length of AGS (LAGS) was 123 d during 1981–2017 (Fig.4-C). Among the various locations,the LAGS ranged from 112 to 144 d. From ATZ1 to ATZ5,the LAGS values were 122,127,122,123,and 125 d,respectively,and showed no obvious differences among the ATZs. The LAGS values in the southeast of Heilongjiang Province were shorter than those of the other locations because of the relative lack of heat resources. Averaged across NEC,the LAGS prolonged 1 d per decade during 1981–2017 (Fig.4-D). Among the various locations,the temporal trends of LAGS ranged from–2 to 4 d (10a)–1.From ATZ1 to ATZ5,the LAGS increased by 1,1,0,2,and 0 d per decade,respectively.

Fig.4 Geospatial and temporal trends of potential (A and B) and actual (C and D) growing seasons of spring maize in Northeast China during 1981–2017. The black circles in B and D indicate significance at P<0.05.
The mean value of the utilization percentage of radiation resources (PR) was 82% averaged across NEC during 1981–2017 (Fig.5-A). ThePRvalues decreased from northeast to southwest. From ATZ1 to ATZ5,the meanPRvalues were 90,89,78,74,and 73%,respectively,and were obviously different among the ATZs. The areas withPRvalues greater than 90% were located in Yichun,Tieli,Suihua,and its northern areas and in Suifenhe,Dunhua and Donggang of ATZ1,as well as in Fuyu of ATZ2. The areas withPRvalues lower than 75% were located in Zhangwu,Shenyang,Anshan,Yingkou,Xiongyue,Wafangdian,Dalian,and its western areas of ATZ4 and ATZ5. The air temperatures for ATZ4 and ATZ5 were higher than other areas,which accelerated the growth and development and shortened the actual maize growing season. This resulted in the lowerPRthan other areas. Averaged across NEC,thePRdecreased 1% per decade from 1981 to 2017 (Fig.5-B). Among the various locations,the mean values of the temporal trends ofPRranged from–5 to 3% (10a)–1. ThePRvalues decreased 1% per decade in ATZ1–ATZ3,increased 1% per decade in ATZ4 and showed little change in ATZ5. The areas withPRdecreasing greater than 3% per decade were located in Beian,Shangzhi,Dunhua,and Suifenhe of ATZ1. The areas withPRincreasing greater than 2% were located in Fuxin and Zhangwu of ATZ4.
The mean value of the utilization percentage of heat resources (PH) was 86% averaged across NEC during 1981–2017 (Fig.5-C). From ATZ1 to ATZ5,the meanPHvalues were 92,92,85,80,and 76%,respectively,and were significantly different among the ATZs. The areas withPHvalues greater than 90% were located in Yichun,Tieli,Suihua,Anda,Qiqihar,and its northern areas and in Suifenhe,Dunhua and Donggang areas of ATZ1 and ATZ2.The areas withPHvalues lower than 80% were located in Fuxin,Shenyang,Dandong,and its western areas of ATZ4 and ATZ5,where the amount of heat resources was greater than the other areas. ThePHvalues decreased slightly with decreasing trends of 1% per decade averaged across NEC (Fig.5-D). Among the various locations,the temporal trends ofPHranged from–3 to 4% (10a)–1. ThePHvalues decreased 1% per decade in ATZ1 and ATZ2,showed very little change in ATZ3 and ATZ5,and increased 2% per decade in ATZ4.
3.3.Cultivar changing measures and their contributions to yield potential,PR and PH
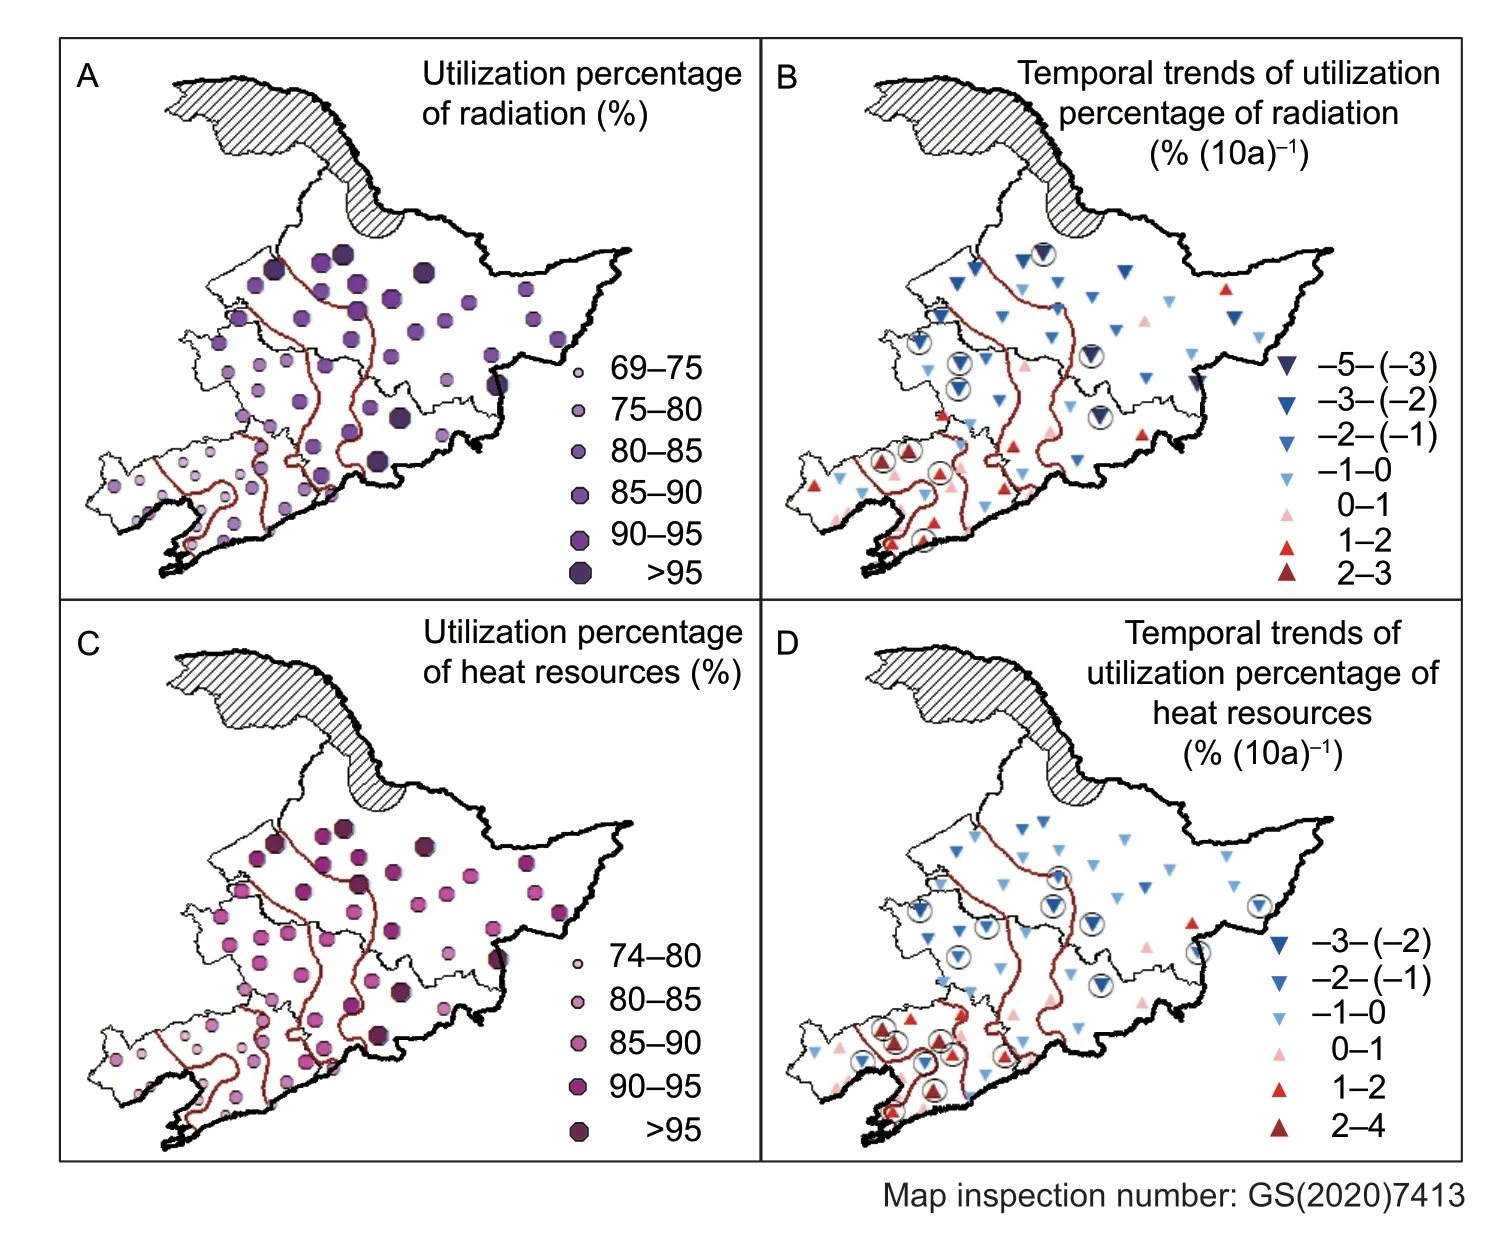
Fig.5 Geospatial and temporal trends of the utilization percentages of radiation (A and B) and heat resources (C and D) of spring maize in Northeast China during 1981–2017. The black circles in B and D indicate significance at P<0.05.
Based on the above analysis,HUE showed decreasing trends,which indicated that the increasing of yield was not synchronous with the increasing of heat resources.Moreover,the decreasing trends ofPRandPHalso indicated that the increasing of LAGS was not synchronous with the increasing of LPGS. Previous studies have found that introduction of cultivars with higher thermal time requirements was an effective measure for adapting to climate change. In our study,in order to increase the utilization percentages of climate resources and the potential yields,we selected cultivars with higher thermal time requirements,either from the next generation or from the next ATZ.
For runs with changes in cultivars,the length of maize growing season was prolonged by 7 d than the actual planted cultivars averaged across NEC (Fig.6). In NEC,the increased number of days of the growing season decreased from northwest to southeast and ranged from 1 to 13 d among the locations. The lengthened days were different among the ATZs. From ATZ1 to ATZ5,the growing seasons lengthened by 7,7,11,2,and 5 d,respectively.
The contributions of cultivar changing toPR,PHand yield are shown in Figs.7 and 8. The contribution toPR(CPR)averaged 4.5% across NEC. Among the various locations,theCPRranged from 0.9 to 8.6%. From ATZ1 to ATZ5,theCPRvalues were 4.8,3.5,7.6,1.1,and 3.1%,respectively,and were obviously different among the ATZs. TheCPRdecreased from north to south in NEC. The contribution toPH(CPH) was 4.38% averaged across NEC. Among the various locations,theCPHvalues ranged from 1.0 to 10.4%.From ATZ1 to ATZ5,theCPHvalues were 3.7,2.3,8.9,1.5,and 3.8%,respectively. The cultivar changing measures increased the potential yield of all ATZs on average. The contribution to potential yield (CY) ranged from–3.4 to 4.6%with an average value of 0.9%. Among the ATZs,CYvalues were 0.6,1.7,0.9,1.2,and 0.6%,respectively.
4.Discussion
In this study,based on the APSIM-Maize Model,we first simulated potential yield and radiation and heat resources use efficiencies of actual planted maize cultivars in NEC.Then identified the lengthening of the potential and actual growing seasons. Finally,we determined the cultivar changing measures to improve the utilization percentages of radiation and heat resources and potential yield. The results showed that changing cultivar with longer growing season can increase the yields and utilization percentages of radiation and heat resources.
The potential yields and resource use efficiencies in our study were closer to the actual production. We simulated potential maize production based on the local management practices including actual cultivars,row spacing and density.Our study showed that the potential maize yield decreased from west to east and showed an increasing trend over time in NEC,which is consistent with the results by Wang X Yet al.(2015). These characteristics are mainly determined by the geospatial patterns of temperature and sunshine hours (Zhao J Fet al.2015a). Under the background of climate change,during the past 37 years,the RUE of the actual planted cultivars in Heilongjiang and Jilin provinces increased,while in Liaoning Province decreased,which was consistent with the study of Guoet al.(2013). It may because the resource suitability increased more in Heilongjiang and Jilin provinces than in Liaoning Province under climate change (Zhao J Fet al.2015b). And climate warming led to an increase in heat resource in NEC,this is beneficial for the northern areas with insufficient heat,while in southern areas with sufficient heat,increased temperatures would accelerate maize development,thereby decreasing the accumulation of biomass and filling of grain(Lv 2016).
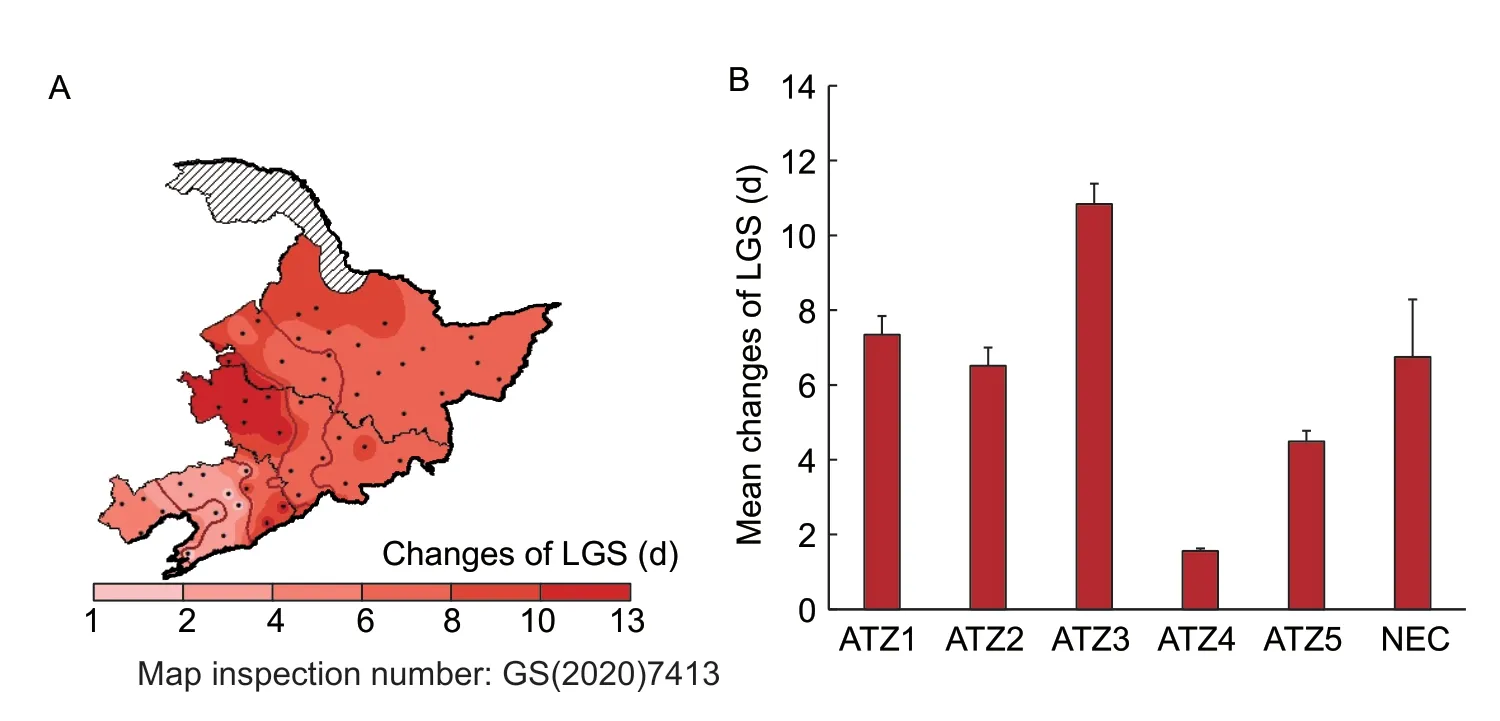
Fig.6 Changes in lengths of the growing season for spring maize after replacing maize cultivars in Northeast China (NEC).A,changes of length of growing season (LGS) after cultivar changing. B,mean changes of length of growing season after cultivar changing within accumulated temperature zones (ATZs) and NEC. Bars mean SD (nATZ1=20,nATZ2=9,nATZ3=14,nATZ4=9,nATZ5=9,nNEC=61).
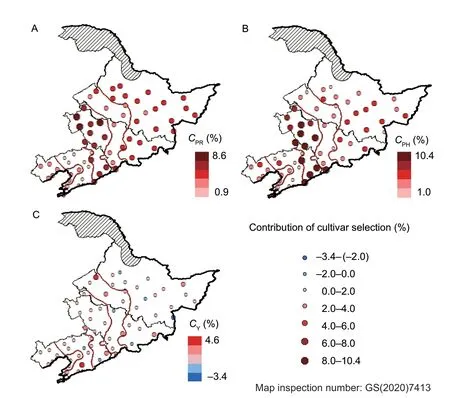
Fig.7 Mean values of the contributions of cultivar selection to the utilization percentage of radiation (A,CPR) and heat resources(B,CPH) and yield (C,CY) of spring maize in Northeast China during 1981–2017.
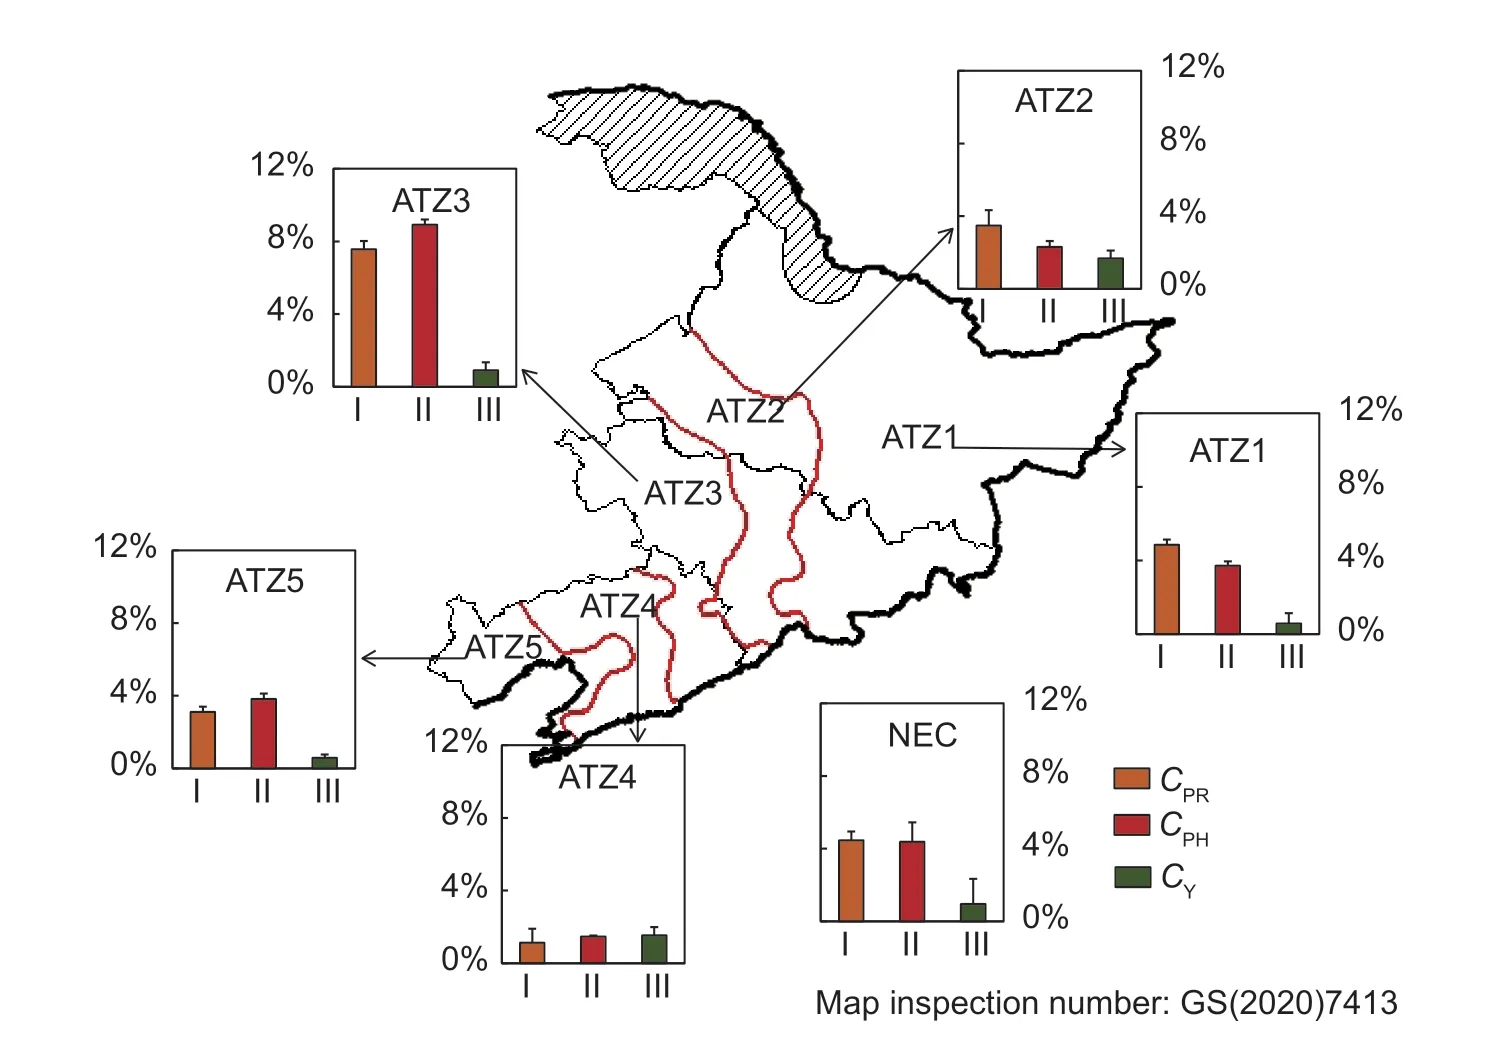
Fig.8 Contributions of cultivar selection to the utilization percentage of resources and yield of spring maize within accumulated temperature zones (ATZs) and Northeast China (NEC). CPR,CPH and CY were the contributions to utilization percentage of radiation resources,utilization percentage of heat resources,and yield,respectively. I,II and III indicate CPR,CPH and CY,respectively. Bars mean SD (nATZ1=20,nATZ2=9,nATZ3=14,nATZ4=9,nATZ5=9,nNEC=61).
During the past 37 years,thePRandPHvalues decreased in the northern areas. Because the length of potential growing season in the northern areas was extended with a larger magnitude than that in the southern areas,which led to more radiation and heat resources. However,actual changings of cultivars were later than the extension of the potential growing season,which resulted in many increased resources not having been used for maize development. If there was no change in the cultivars grown by farmers,the warmer climate would speed up development and lead to a reduction in the number of days in the growing period for maize and therefore would be a reduction in yield. While climate warm advanced the starting dates and delayed the ending dates of the potential growing season (Maet al.2018). Therefore,sowing maize cultivars with longer growing periods,can address the contradiction between the extension of the potential growing season and the shortening of actual growing season. In our study,we identified the contributions of cultivars selection to maize yield and utilization percentages of the radiation and heat resources,and determined the cultivar changing measures to adapt to climate change in NEC. Our results indicated that cultivating new cultivars with longer growing season is a feasible method to achieve high yield and high efficiency in maize production under climate warming.
In our study,we assumed that within the certain ATZs all locations sowed the same cultivar in the same age,which cannot comprehensively reflect the spatial and temporal differences of maize cultivars. This caused differences in potential maize yields between our study and actual production. Moreover,cultivar replacement was based on the actual cultivars planted in the 1980s–2000s in NEC.Due to the lack of experiment data in the 2010s for 2001–2010 and virtual cultivars in the 2020s for 2001–2017,we could not get optimal maize cultivars changing measures,especially for ATZ4 and ATZ5 where radiation and heat resources are abundant for maize production. Therefore,our results may underestimate the contributions of changing cultivars. We can research more detailed cultivars changing measures by using the potential cultivars which could use more heat resources to identify the contributions in the future(Liuet al.2015). We calculated utilization percentages of radiation and heat resources under the potential yield condition. However,many other environmental factors including soil conditions and crop population structures can affect utilization of climate resources,which was not taken into consideration in this study and should therefore be considered in future studies. In the cultivar replacement measures,we chose cultivars with longer growing season to improve yield and utilization percentage of heat and radiation resources to adapt to continuous climate warming. The time and weather condition required for grain dehydration to reach maize grain mechanical harvest haven’t been taken into consideration. However,maize grain mechanical harvest is an important technology for maize production with high yield and high efficiency and is becoming more and more important in maize harvest (Liet al.2018). The longer growing season may affect quality of grain mechanical harvest by shorten the day for grain dehydration. We should research cultivar replacement measures combining climate change and technology of agricultural production in future study.
5.Conclusion
During the past 37 years,the averaged potential yields of spring maize increased across NEC,and the high-yield areas moved northwestward. Averaged across NEC,the RUE increased,especially in the northern areas. High values of RUE located in the northeast areas. High values of HUE were located in Heilongjiang Province. The HUE decreased for most of the locations. ThePRandPHvalues decreased from north to south in NEC. During the past 37 years,these two values decreased in the northern areas while increasing in the southern areas. The northern areas have greater potential for increasing the resource utilization than the southern areas. Our results showed that adoption of cultivars with growing season increased by 2–11 d caused an increase in yield,PRandPHof 0.6–1.7%,1.1–7.6% and 1.5–8.9%,respectively. Therefore,introduction of cultivars with longer growing season can effectively increase the radiation and heat utilization percentages and potential yield,and achieve high yield and high efficiency for maize production in NEC.
Acknowledgements
This work was supported by the National Key Research and Development Program of China (2016YFD0300101-03).
杂志排行
Journal of Integrative Agriculture的其它文章
- Yield gap and resource utilization efficiency of three major food crops in the world -A review
- Reducing maize yield gap by matching plant density and solar radiation
- Effects of different agricultural treatments on narrowing winter wheat yield gap and nitrogen use efficiency in China
- Determination of soybean yield gap and potential production in Iran using modeling approach and GIS
- Developing a process-based and remote sensing driven crop yield model for maize (PRYM–Maize) and its validation over the Northeast China Plain
- Delineating the rice crop activities in Northeast China through regional parametric synthesis using satellite remote sensing timeseries data from 2000 to 2015
