Yield gap and resource utilization efficiency of three major food crops in the world -A review
2021-01-18RONGLiangbingGONGKaiyuanDUANFengyingLlShaokunZHAOMingHEJianqiangZHOUWenbinYUQiang
RONG Liang-bing ,GONG Kai-yuan ,DUAN Feng-ying,Ll Shao-kun,ZHAO Ming,HE Jianqiang ,ZHOU Wen-bin,YU Qiang
1 College of Natural Resources and Environment,Northwest A&F University,Yangling 712100,P.R.China
2 State Key Laboratory of Soil Erosion and Dryland Farming on the Loess Plateau,Institute of Soil and Water Conservation,Northwest A&F University,Yangling 712100,P.R.China
3 Institute of Crop Sciences,Chinese Academy of Agricultural Sciences,Beijing 100081,P.R.China
4 Key Laboratory for Agricultural Soil and Water Engineering in Arid Area,Ministry of Education,Northwest A&F University,Yangling 712100,P.R.China
5 Institute of Water-Saving Agriculture in Arid Areas of China,Northwest A&F University,Yangling 712100,P.R.China
6 School of Life Sciences,University of Technology Sydney,Broadway,NSW 2007,Australia
7 College of Resources and Environment,University of Chinese Academy of Sciences,Beijing 100049,P.R.China
Abstract Yield gap analysis could provide management suggestions to increase crop yields,while the understandings of resource utilization efficiency could help judge the rationality of the management. Based on more than 110 published papers and data from Food and Agriculture Organization (FAO,www.fao.org/faostat) and the Global Yield Gap and Water Productivity Atlas (www.yieldgap.org),this study summarized the concept,quantitative method of yield gap,yield-limiting factors,and resource utilization efficiency of the three major food crops (wheat,maize and rice). Currently,global potential yields of wheat,maize and rice were 7.7,10.4 and 8.5 t ha–1,respectively. However,actual yields of wheat,maize and rice were just 4.1,5.5 and 4.0 t ha–1,respectively. Climate,nutrients,moisture,crop varieties,planting dates,and socioeconomic conditions are the most mentioned yield-limiting factors. In terms of resource utilization,nitrogen utilization,water utilization,and radiation utilization efficiencies are still not optimal,and this review has summarized the main improvement measures.The current research focuses on quantitative potential yield and yield gap,with a rough explanation of yield-limiting factors.Subsequent research should use remote sensing data to improve the accuracy of the regional scale and use machine learning to quantify the role of yield-limiting factors in yield gaps and the impact of change crop management on resource utilization efficiency,so as to propose reasonable and effective measures to close yield gaps.
Keywords:food crops,yield,yield gap,resource utilization efficiency,yield-limiting factor
1.Introduction
The ability to feed the world’s growing population depends on the ability of future food supplies to meet food demand(Cirera and Masset 2010). However,the current rate of grain yield increases suggests that there will be a crisis involving insufficient grain supply in the future. The United Nations predicts that the population of the earth will increase to 9.7 billion in the next 30 years (UN 2019). In addition,changes in the structures of diets for people across the globe have further increased the demand for crops. Calorie consumption has increased from 2 250 kcal per capita per day in the 1860s to 2 880 kcal in 2015,and it is estimated that it will reach 3 900 kcal by 2050 (Pardeyet al.2014; Valinet al.2014),leading not only to increased demand for food crops,but also to significantly increased demand for crops to feed livestock. Therefore,FAO believes that ensuring food security will require global crop yields to increase by more than 70% (FAO 2009).
There are two main ways to increase grain yield:one way is to increase the area of cultivated land,and the other way is to increase the yield of existing cultivated land.Many studies have shown that there is a large amount of land suitable for crop growth in northern South America and tropical Africa that could be converted into cultivated land(Rosegrantet al.2001; Bruinsma 2003). However,most of these land is located in tropical rain forests or nature reserves,both of which have high social,economic and ecological values. Additionally,loss of forest cover in tropical soils results in rapid loss of soil fertility,requiring additional investments to preserve soil organic matter (Ramankuttyet al.2002; Lickeret al.2010). For many countries,the area of arable land that can be increased is limited,and the existing arable land area is gradually decreasing due to land degradation,urbanization and resource extraction (Luet al.2007; Fitzgeraldet al.2020). In fact,the agricultural land area in developed countries decreased by 34% from 1995 to 2007,and the cultivated land area in developing countries increased by 17.1%,mainly in tropical forests(Gibbset al.2010). Therefore,it is difficult to achieve a substantial increase in global food production by increasing the area of cultivated land.
The green revolution in the second half of the 20th century greatly increased the yield of farmland. Global crop yield tripled from 1960 to 2014 at the same time that arable land increased by only 10% (Pellegrini and Fernández 2018).These developments have led researchers and policy makers to investigate the prospect of meeting food demand through increased yields. However,some studies have pointed out that the current crop yield growth rate in major food-producing countries has slowed or even stalled. Since the 1990s,for instance,rice (Oryza sativaL.) yields in Asia have hardly increased at all (Cassmanet al.2003).
We have collected and summarized the research on the yield gaps and resource utilization efficiency (RUE) gaps of the world’s major food crops in recent years. Our analysis of the yield gaps and RUE of different crops in different countries will provide some guidance for increasing crop yields in the future.
2.Yield gap
The study of yield gap began in the 1970s with the International Rice Research Institute’s study of yield-limiting factors for rice in six Asian countries (Instet al.1979).The concept of yield gap was first proposed in 1981,and was defined as the gap between actual farm yield and experiment station yield (de Datta 1981). de Datta (1981)also defined potential farm yield to represent the highest yield that farmers could achieve. Based on actual farm yield and experiment station yield,“technical upper limit yield”and “economic upper limit yield” were introduced (Fresco 1984). The technical upper limit yield is the maximum yield that a specific piece of farmland can reach,which is equivalent to the potential farm yield. The economic upper limit yield refers to the yield obtained when the farm profit is the highest. Because the input level used by farmers is lower than the input level required for the maximum yield for a specific piece of farmland,the economic upper limit yield is lower than the technical upper limit yield. Some researchers have subsequently defined “potential yield”and “available yield” (Rabbinge 1993). Potential yield is the yield that could possibly be achieved under the cultivation and management practices used at an experimental station to ensure good crop growth (i.e.,using suitable varieties,weed control,pest management,optimum planting dates and seeding rates,not subject to water and fertilizer stress,limiting harvest losses,etc.). The potential yield reflects the local yield that is determined only by light and temperature conditions and genetic characteristics. Available yield is the yield that can actually be achieved under optimal cultivation management measures,and it is almost the same as the potential farm yield and the technical upper limit yield. It is now generally accepted that 80% of the potential yield should be considered as the attainable yield(Cassmanet al.2003; Lobellet al.2009). de Bie (2000)summarized previous research on yield gap,and identified several yield levels:the potential yield of an experimental station simulated by a model,the maximum yield of the experimental station,farmers’ potential yield,the economic upper limit yield,and the actual farmland yield. Lobell and Ortiz-Monasterio (2006) defined “field yield gap” as the difference between the highest field yield and the regional average yield.
Previous yield gap research has usually divided yield into different levels,thus resulting in different definitions of the yield gap. In addition to the yield levels mentioned above,the two yield levels of “basic soil fertility” and “high-yield and high-efficiency” also have research value. However,there is currently almost no relevant literature related to these two yield levels. “Basic soil fertility” refers to the crop yield level obtained without the input of irrigation water and applied fertilizer,relying only on the soil’s native fertility and existing climatic conditions. It represents the local minimum yield.“High-yield and high-efficiency” is a concept proposed by Chinese researchers. Designed management practices consist of a crop module from which cropping strategies in a given region and a resource supply module for the formulation of nutrient and water applications according to soil tests and the needs of the growing crops. It represents the application of comprehensive and integrated agricultural technology innovations to achieve high crop yields and efficient utilization of resources (Shenet al.2013; Wanget al.2014; Baiet al.2020),and is the same as the “Nutrition Expert System” described by Xuet al.(2016). The farm yield is the actual yield achieved by farmers. The gap between “basic soil fertility” yield and farm yield can reflect the benefits of using agricultural resource inputs,and is helpful for further research on evaluating RUE. The gap between farm yield and “high-yield and high-efficiency” yield reflects the increase in farm yield when resource utilization is optimal. Fig.1 is an expansion of the yield gap model presented by de Bie (2000) that now includes “high-yield and high-efficiency” yield and “basic soil fertility” yield.
2.1.Quantitative methods for yield levels
Different yield levels are measured in different ways. Farm and experimental station yield levels can be obtained through household surveys and field trials. Field trials can control factors affecting yields by imposing different treatments in order to analyze the impact of specific factors on crop yield formation. Meertens (1991) applied six treatments that included weeds,fertilizers,pests,and diseases,and found that only weed treatments had a significant effect on cotton yield. However,the results of the field test only reflected the local situation during the current year of the study,and may not be applicable to regional scales and long-term sequences. Farm household surveys can estimate different yield levels and yield gaps at the regional scale by obtaining information such as soil,crop varieties and farm household management. Sarobolet al.(1989) used household surveys and related statistical data,and found that the limiting factors for soybean yield in Thailand were mainly unreasonable land use,weeds,insect pests,inadequate land preparation,and outdated production technologies. However,household surveys usually use questionnaires that are subjective and may omit relevant information about the causes of yield gap.These types of questionnaires make it difficult to obtain accurate farmland management information.

Fig.1 Yield gaps and their main constraints. Yield Gap-0 cannot be reduced; Yield Gap-1 is the gap between the yield produced at experimental station level and farmland level; Yield Gap-2 is the gap caused by different management practices at the farmland level; Yield Gap-3 is the gap between farmland and wasteland,and caused by water,fertilizer,and other management measures.This figure is an expansion of the figure presented by de Bie (2000).
Since the potential yield cannot be obtained through actual production data,its quantification is usually achieved by use of simulation models. The models used to determine yield gaps can be divided into two categories:empirical models and mechanistic models (Caoet al.2011). Empirical models are mathematical statistical analysis models based on the statistical correlation between biomass and climate factors,such as the Miami Model (Luoet al.2011; Chenget al.2012; Yuet al.2012),the Thornthwaite Memorial Model (Maoet al.2008; Liet al.2009),the Wagenigen Model (Linet al.2003),and the AEZ Model (Liuet al.2001). Mechanistic models use mathematical concepts to simulate crop physiological processes and to explain the overall function of the crop,such as WOFOST (Wuet al.2006),Hybrid-Maize (Liuet al.2017),DSSAT (Maria Carolinaet al.2018),EPIC (Lu and Fan 2013),APSIM (Liet al.2014),ORYZA (Aguset al.2019),etc. In addition to simulating potential yield,a mechanistic model can also simulate other yield levels by defining different cultivation scenarios (Bindrabanet al.2000). Because these models are often built on the basis of single-point experiments,there may be many limitations in using them to calculate regional yield gaps. Regional yield gap studies have often used the method of combining models and remote sensing (Maas 1988; Moulinet al.1998). For example,Liet al.(2014)combined the APSIM-Wheat Model with GIS technology to analyze the temporal and spatial distribution of the winter wheat yield gap in the North China Plain.
It should be noted that using different methods to estimate potential yield (Yp) has a significant impact on the calculation of the yield gap. Taking the North China Plain as an example,the relative yield calculated using a crop model was low (56–68%) (Lu and Fan 2013; Liet al.2014; Fanget al.2017). However,the relative yield value calculated using boundary line analysis was 85% (Caoet al.2019).This difference in relative yield is caused by the difference in the definition of potential yield. The Yp obtained by the crop model is the theoretical maximum yield,while the potential yield estimated based on field trials is the yield that highyield farmers can actually achieve.
2.2.Current status of world grain crop yield
At present,the primary focus of yield gap research is centered around the three major food crops of wheat(Triticum aestivumL.),maize (Zea maysL.) and rice. Crop yield data for 2002–2017 were obtained from Food and Agriculture Organization Statistics (www.fao.org/faostat,accessed on 20 June,2020),maize yield was the highest at 4.3 t ha–1,followed by rice (3.7 t ha–1) and wheat (3.1 t ha–1).Ireland had the highest wheat yield,and western Europe was a high-yield area for wheat,almost countries in this region could produce more than 6 t ha–1. High-yield areas for maize were found on the Arabian Peninsula,including the United Arab Emirates (UAE),Israel,Jordan,and Kuwait,maize yields where were more than 18 t ha–1,while most countries had less than 10 t ha–1. There was no single high-yield area for rice,but rice yield in Egypt and Australia exceeded 9 t ha–1.And for all three crops,the countries with low yields were concentrated in Africa (Appendix A).
Yield gap data were obtained from the Global Yield Gap and Water Productivity Atlas (Appendix B) (www.yieldgap.org accessed on 30 April,2020) and other literature(Appendix C),including actual yield (Ya) and Yp for countries or regions. Relative yield was calculated as:

where Yp values for wheat,maize and rice were 7.7,10.4 and 8.5 t ha–1,respectively. In general,wheat and maize production in Europe,especially in western Europe,is close to potential production; the relative yields of the three crops in Africa are low,and many countries have less than 40%(Lobellet al.2009; Hoffmannet al.2018); the relative yields of America and Asia are similar,higher than that in Africa but lower than that in Europe; the relative maize yield of Australia exceeds 80%,but wheat is only 48%. In particular,the relative yields of maize and rice in the United States are between 60–80%,but the yield of wheat can only reach 30% of the potential yield,which may be caused by lack of poor soil quality (Patrignaniet al.2014); while relative yield of rice in Egypt is the highest among all countries with data records,benefiting from Egypt’s policies reforms,technological change and increased investment (Fanet al.1997). However,the harvest in Africa is only 20% of potential yield (AppendicesB and C).
For each of the three major crops,we have focused on the analysis of the yield gap in four major producer countries,two low-yield-gap countries and two high-yieldgap countries. Ya1,Ya2 and Ya3 are the abbreviations for the average actual yields from 1961 to 1980,1981–2000,and 2001–2018,respectively.
The yield of wheat continued to increase from 1961 to 2018,but the gap between Ya3 and Ya2 in all eight countries was smaller than the gap between Ya2 and Ya1 (Fig.2).These results demonstrate a declining rate of wheat yield increases over time. If 80% of Yp is used as attainable yield,Ethiopia will aim to increase yield by 4.6 t ha–1,the largest increase of the eight countries. Tanzania would aim to increase production by 240%,high-yield-gap countries have the greatest room for increase yield. In contrast,it is almost impossible to increase yield in Denmark and Germany due to the current yield’s closeness to Yp. For the four major wheat-producing countries,although the increase in yield has declined,it has not yet reached the threshold of attainable yield.

Fig.2 Actual yield (Ya) and potential yield (Yp) of wheat in four major wheat-producing countries (China,France,India,and USA),low-yield-gap countries (Denmark and Germany),and high-yield-gap countries (Ethiopia and Tanzania). Ya1,Ya2 and Ya3 are average Ya during 1961–1980,1981–2000 and 2001–2018,respectively. Bars mean SD (n=20).
Since the beginning of the 21st century,maize yields have continued to increase substantially,while in China and Nigeria,the growth trends have been weakening (Fig.3).In the USA,Germany and Netherlands,current relative yield close (or exceed) to 80%. Compared with increasing yield,these countries need to maintain the stability of production and reduce the inter-annual fluctuation of yield(SD in Fig.3). The actual yield of India and Nigeria is less than 20% of the potential yield,and there is great potential for increasing yield through changes in crop management in the future. Actually,in Africa,backward farming and management practices,limitations on use of water and fertilizers,and pest and disease pressures have led to low maize yields for farmers (van Ittersumet al.2013; van Loonet al.2019). Therefore,introduction of advanced technology for managing maize production in these areas is urgently needed.
Rice production is mainly concentrated in Asia. As the largest rice producer,the relative yield of rice in China is close to 70%,with a stable yield and little increase in the most recent 20-yr period (Fig.4). Late rice in the middle and lower reaches of the Yangtze River has even reached 90% of the potential yield,with almost no increases in yield in recent years (Zhanget al.2019b). Bangladesh,India,Cote D’Ivoire and Zambia have still maintained relatively higher growth rates than China,but the relative yield of less than 50% shows that rice yield still has potential to increase rapidly with technical support.Egypt is special,although its relative yield has reached 81%,its rice yield still maintains a high growth rate.
In general,the greater the gap between Yp and Ya,or the smaller the relative yield,the easier it is to increase crop yield. Therefore,low-yield areas should be given priority over high-yield areas in developing production methods to narrow the yield gap (Wilbois and Schmidt 2019). Farm yield in developed countries and regions such as the United States and Europe is close to being at the threshold of 80%of potential yield. Although it can be further improved by technical means,the return on investment for increased yield is very low. In contrast,the relative yield of farmers in Africa and South America is low,and these areas are the focus of reducing the yield gap in the future,as confirmed by the prioritization provided by van Oortet al.(2017).

Fig.3 Actual yield (Ya) and potential yield (Yp) of maize in four major maize-producing countries (Argentina,Brazil,China,and USA),low-yield-gap countries (Germany and Netherlands) and high-yield-gap countries (India and Nigeria). Ya1,Ya2 and Ya3 are average Ya during 1961–1980,1981–2000 and 2001–2018,respectively. Bars mean SD (n=20).
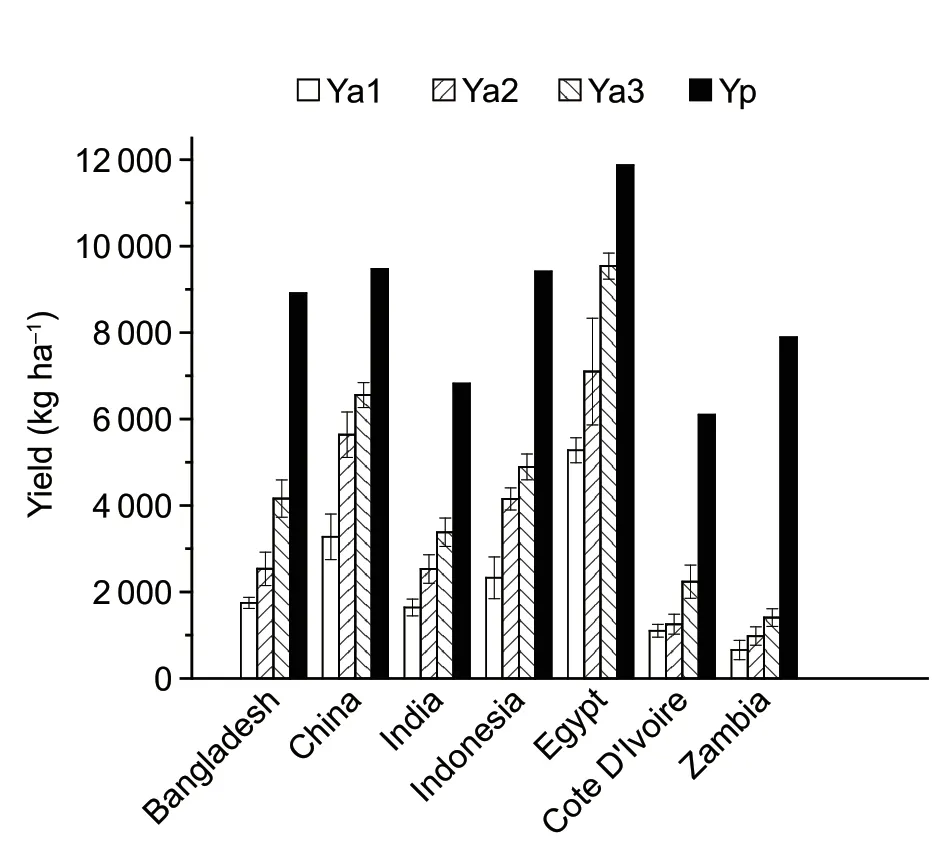
Fig.4 Actual yield (Ya) and potential yield (Yp) of rice in four major rice-producing countries (Bangladesh,China,India,and Indonesia),low-yield-gap countries (China and Egypt),and high yield gap countries (Cote D’lvoire and Zambia). Ya1,Ya2 and Ya3 are average Ya during 1961–1980,1981–2000 and 2001–2018,respectively. Bars mean SD (n=20).
2.3.Factors causing yield gap and ways to close the gap
Factors causing yield gaps are called yield-limiting factors.There are many of these factors,such as soil quality,genetic factors and human management (including irrigation,fertilization,pest management,and planting factors) (Lickeret al.2010). Usually the yield gap is directly used to quantify yield-limiting factors. For example,the water limitation can be quantified by determining the yield gap between rainfed and irrigated yields,and the nutrient limitation can be quantified by determining the yield gap between different fertilizer application amounts. In addition,many studies have adopted the boundary line analysis method (Fermontet al.2009; Hajjarpooret al.2018; Caoet al.2019). The upper boundary line is used to minimize the influence of other factors,and the response function of yield to the limiting factor is obtained. Compared with the previous method,it can get a continuous result that a certain factor limits the yield. According to the above research (Appendix C),the main factors limiting crop production are shown in Fig.5 and Appendix D.
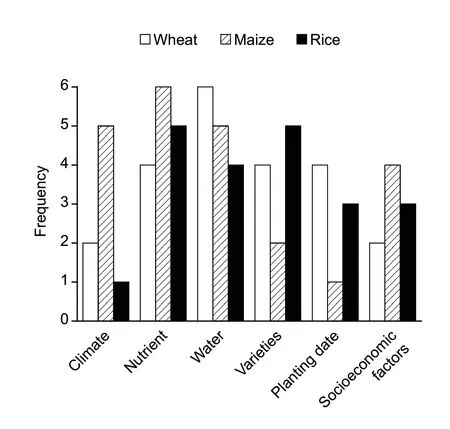
Fig.5 The frequency of the main yield-limiting factors in the published papers,including climate,nutrient,water,varieties,planting date (or seeding date),and socioeconomic factors.Socioeconomic factors include agro-technical service,government support,risk aversion of farmers,farm size,labor,and expertise,etc.
ClimateChanges in atmospheric CO2,temperature and precipitation are the main driving forces affecting crop response to climate change (Hatfieldet al.2011). Many studies have shown that climate warming will reduce crop yields to a certain extent,and climate warming results in positive yield responses in only a few regions such as Northeast China (Taoet al.2006; Liu Yet al.2010; Assenget al.2013; Kukal and Irmak 2018). This may be due to the high latitude of these areas,and current temperatures not being in the range to promote maximum growth and yield.Increasing atmospheric CO2concentrations promote CO2fertilization effects on plants,but the amount of yield that can be increased by increased CO2has not yet been determined(Longet al.2006; Taoet al.2006; Ewertet al.2007). The regional trend of rainfall is obvious. Precipitation in arid areas of China has decreased in summer and autumn. In contrast,in the humid southern areas of China,there has been more precipitation in summer,negatively impacting agricultural production (Fanet al.2011). In addition,studies on rice production in Southeast Asia have shown that there is a significant difference between yields in the rainy season and the dry season. The relative rice production in Indonesia in the dry season is only 55%,but it can reach 67% in the rainy season. However,the opposite is true in Vietnam (75%in the dry season and 50% in the rainy season) (Laborteet al.2012; Silvaet al.2017).
Nutrient and water managementThe growth and development of crops are inseparably linked to water and nutrient availability. Generally,the higher the input level is,the higher the yield is. Among the many inputs used in agricultural production,water and nitrogen are the most important. 10.7% of the single-season rice yield gap in Northeast China is due to insufficient nitrogen fertilizer supply,while 7.2% is due to water stress (Zhanget al.2019b). Also,there is a connection between water and nitrogen. In the western United States,nitrogen fertilizer accounted for 24% of the yield increase in a maize-soybean rotation under irrigation. However,without irrigation,the contribution of nitrogen fertilizer could be ignored (Balboaet al.2019). In addition to nitrogen,other nutrients (such as phosphorus,potassium,etc.) will also limit crop yields(Hajjarpooret al.2018). In particular,the lack of potassium fertilizer produced a greater yield restriction on maize production than that on rice and wheat production (Jin 2012;Daiet al.2013; Xuet al.2016).
VarietiesThe increase in crop yields since the Green Revolution is related to the selection of new varieties. In the early Green Revolution (1961–1980),new varieties accounted for 17% of the yield growth in developing countries. However,by the late Green Revolution period(1980–2000),this proportion had increased to 50%(Evenson and Gollin 2003). Senapati and Semenov (2020)believed that breeding varieties that are resistant to heat and drought at the flowering stage,and have the best canopy and root structure could increase wheat yield by 3.5–5.2 t ha–1.Liuet al.(2012) found that new maize varieties increased maize yield by extending the growing season. In China,more than half of the farmers did not choose the right corn varieties,which caused a 19.8% yield gap (Zhanget al.2016). Improved varieties have also played an important role in increasing rice yield (Takaiet al.2006; Penget al.2008; Espeet al.2018),and the best varieties should have longer growing seasons,larger spikes and greater kernel weight (Zhanget al.2019b). In order to obtain higher yields in the United States under the pressures of climate change,pests and diseases,crop production systems widely use hybrids and herbicide-resistant varieties that have better adaptability to the environment (Nalleyet al.2016).
Planting dateTemperature,light,precipitation,and solar radiation play an important role in crop growth and development,but it is difficult for humans to directly control these parameters in field production situations. By adjusting the planting date,crops can,to a certain extent,make better use of these resources. Khaliqet al.(2019) used the APSIM Model to simulate the effect of planting date on rice and wheat yields. They found that the best planting date for rice in Pakistan was one month later than the currently used planting date,and that the best planting date for wheat was at least one month earlier than the currently used planting date. The suitable planting period for winter wheat in the North China Plain is from October 3 to October 8,and the planting period is the largest limiting factor affecting the number of heads (Caoet al.2019). The transplanting date for rice will affect the number of days in the growing season and the climatic conditions received during the growing season (Huet al.2017). The transplanting date for rice in Northeast China has a greater impact on yield than it does in the middle and lower reaches of the Yangtze River (Zhanget al.2019b). Many studies have shown that temperate regions facing the negative impacts of global warming can increase production through earlier planting and emergence.Some of these studies have involved wheat in Australia(Zeleke and Nendel 2016) and rice in China and the United States (Hardkeet al.2013; Linquist and Espe 2015; Dinget al.2020). In areas with sufficient heat,the planting date needs to be properly delayed to avoid damage to crops caused by high temperature (Dinget al.2020).
Socioeconomic factorsThe goal of farmers involved in agricultural production is generally to obtain maximum economic benefits rather than to obtain the highest yield.Reducing yield gap through better management measures may not be feasible in all regions because it means higher economic and resource investments. Even though the yield of improved varieties in Africa can be three times greater than the average yield obtained by farmers,they often do not consider using these improved varieties due to the higher seed costs and drought intolerance (van Loonet al.2019).In Northwest China,farmers have been unable to increase yield through large-scale wheat and maize intercropping due to water shortages because both intercropping and increased planting density result in higher water demand(Fanget al.2017). In addition,factors such as the size of the farm (Duttaet al.2020),the number and gender of the labor force (Mahmoodet al.2019) and the education level of farmers (Assefaet al.2020) can affect the decisionmaking processes of farmers,and ultimately the final yields obtained.
Other yield-limiting factors affect yield gaps less,but this does not mean that those factors are unimportant.Liu Wet al.(2010) established a planting density gradient experiment and found that maize yield increased by 48–72%under high plant density conditions. Flat land allows soil moisture and nutrients to be evenly distributed,and also results in production areas that are conducive to the use of agricultural machinery to manage farmland in an efficient manner to increase yields. In the continuously cropped rice production areas of California (USA),precision landleveling began to be promoted as early as the 1970s (Espeet al.2016). Altitude is generally ignored in field trials,but when Wanget al.(2020) used remote sensing to analyze differences in rice yield in Northeast China,they found that,on the regional scale,altitude was one of the important limiting factors for yield. Each 1-m increase in altitude resulted in a potential yield reduction of 8.6 kg ha–1.
3.Resource utilization efficiency
Even though crop yield is often limited by factors such as light,temperature,water,and nutrients,current yield gap research has focused on improving crop yields without considering RUE. In fact,even though excessive inputs of resources can increase yields,the utilization efficiency of those resources will decrease. This approach of applying excessive amounts of inputs not only reduces the economic benefits received by farmers,but also causes environmental pollution. Therefore,it is necessary to consider RUE when studying how to narrow yield gap. Research on efficiency gap is currently focused on nutrients,water and radiation.This type of research is generally conducted by setting up different management practices,and then comparing RUE under each practice.
3.1.Nutrient utilization efficiency
There are many indicators for evaluating nutrient utilization efficiency. Commonly used indicators are agronomic efficiency (AE),recovery efficiency (RE) and partial factor productivity (PFP). Taking nitrogen fertilizer utilization efficiency as an example,the calculation equations are:

where NAE is agronomic efficiency of nitrogen fertilizer,Y is grain yield when nitrogen fertilizer is applied,Y0is grain yield without nitrogen fertilizer,F is nitrogen fertilizer application amount,NRE is nitrogen fertilizer recovery efficiency,U is the amount of nitrogen absorbed by the crop when nitrogen fertilizer is applied,U0is the amount of nitrogen absorbed by crops without nitrogen fertilizer,and NPFP is nitrogen partial factor productivity.
AE directly reflects the impact of fertilizer application on production and is related to economic returns; RE focuses on the nutrient response of crops,and like AE,it requires plots without nutrient input as a control,and requires longterm trials to eliminate residual effects; PFP is a simple expression of factors of production. Compared with AE and RE,the data required for PFP is easier to obtain (Fixenet al.2015) (Fixenet al.2015). NPFP values of three crops in different countries are shown in Appendix A.
Among the three crops evaluated in this review paper,the current yield of maize is closer to Yp than the yields of wheat and rice,and therefore agronomic management of maize is likely being conducted in a more reasonable and efficient manner. Analysis of NPFP from 2002 to 2017(www.fao.org/faostat,accessed on 20 June,2020) in the major maize-producing countries (United States,China,Brazil,and Argentina) and advanced production countries(AppendicesB and C with relative yield greater than 80%)showed that as fertilizer input increases,nutrient utilization efficiency decreases (Fig.6),even though yield increases as fertilizer input increases. Therefore,the methods used to increase the amount of fertilizer applied in the studies in order to reduce the maize yield gap were not conducive to the efficient utilization of nutrients. In fact,the process of nutrient absorption is affected by more than just the amount of nutrient input. Nutrient absorption is also the result of a combination of factors. Despite the same level of nitrogen input,NPFP values for maize in China were lower than those observed in the advanced production countries. This result shows that in China and Brazil,it is still possible to improve nitrogen use efficiency and production of maize by reducing the negative impacts of other yield-limiting factors. The relative yield of the United States was close to 80%,and its NPFP had reached the level of advanced producing countries.Argentina’s NPFP was somewhat higher than the ideal condition defined by the regression relationship in Fig.6,which may be a result of its fertile soil and suitable climate.
Some studies have shown that excessive fertilization would lead to low nutrient utilization efficiency (Muelleret al.2012; Cuiet al.2014; Chenet al.2018). Increasing irrigation amounts and planting density are common ways to improve nitrogen fertilizer utilization efficiency (Zhanget al.2019a; Baiet al.2020). Changing the fertilization formula (Liet al.2017),cereal/legume intercropping (Xuet al.2020) and fertilization time (Menget al.2016) can also improve the efficiency to a certain extent. In addition,some studies have shown that a co-limiting relationship exists between the absorption of different nutrients,i.e.,the lack of one element will lead to a reduction in the absorption of another element. Therefore,nutrient utilization efficiency can be improved by adjusting the ratio of nitrogen-sulfur or nitrogen-phosphorus (Sadras 2006; Carciochiet al.2020).In the maize production system used in northeastern China,if the farmers adjust the typical fertilization amounts(207 kg N ha–1,40 kg K ha–1and 61 kg P ha–1) to the fertilizer amounts recommended by nutrition experts (173 kg N ha–1,32 kg K ha–1and 69 kg P ha–1),the partial productivity of nitrogen and phosphorus will increase by 24.6 and 12.6%,respectively,and maize yield will increase by 0.9 t ha–1(Xuet al.2016).
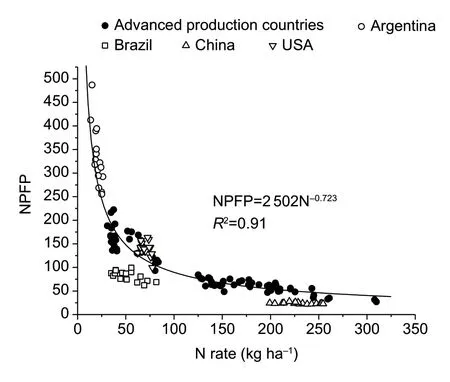
Fig.6 Relationship between nitrogen rate and nitrogen partial factor productivity (NPFP) for maize. Advanced production countries (relative yield exceeding 80%) include Australia,Belgium,Germany,Netherlands,and Italy.
3.2.Water utilization efficiency
Water utilization efficiency (WUE) is an important indicator to measure the relationship between crop yield and water consumption. However,due to different research objectives,the calculation method for WUE can be different. For plant biomass or forage production systems,WUE is equal to dry matter divided by evapotranspiration (Kramer and Kozlowski 1979). In agricultural production systems where grain yield is the product to be used or sold,WUE is equal to the ratio of grain yield to evapotranspiration (Viets 1962). However,evapotranspiration is difficult to measure,and therefore effective rainfall and irrigation are often used instead of evapotranspiraton to calculate WUE in agronomic research(Howell 2001). In addition,depending on the source of water,some studies have also divided WUE into precipitation use efficiency (Penget al.2020) and irrigation use efficiency(Caoet al.2020).
Reducing the input of water in agricultural production usually causes a decrease in ET,and most crops suffer a reduction in yield when ET decreases (Evans and Sadler 2008; Nielsenet al.2011). Therefore,the main way to improve water use efficiency is to improve water management capabilities. One method for increasing WUE is to change planting methods. No-tillage (Nielsenet al.2005),furrow planting and straw mulching can increase WUE in arid areas (Penget al.2020). No-tillage can improve soil structure and crop root systems,and increase water absorption (Kanet al.2020). Ditch planting and straw mulching can synchronize seasonal soil water supply with crop water needs (Wanget al.2011). Another method for increasing WUE is to change the irrigation system. By using drip irrigation technology in the North China Plain,WUE can reach 2.27 kg m–3,much higher than 1.45 kg m–3observed when using surface irrigation (Zhanget al.2011;Siet al.2020). In areas where agricultural water is scarce,deficit irrigation can maximize the irrigation area,thereby achieving an increase in regional WUE (Bellet al.2018;Liet al.2019; Pardoet al.2020). Additionally,changes in irrigation timing can affect WUE. Winter wheat is the most sensitive to moisture during jointing and flowering. Irrigation applications during these two growth stages can increase WUE by 0.45–0.96 kg m–3(Baiet al.2020).
3.3.Radiation utilization efficiency
Radiation utilization efficiency (RdUE) is defined as the dry matter produced by solar radiation or photosynthetically active radiation per unit area intercepted by the canopy. It is an important quantitative indicator of crop yield related to photosynthesis (Stöckle and Kemanian 2009). Loomis and Amthor (1999) calculated the theoretical RdUE of C3crops as 1.5–2.0 g MJ–1,and RdUE of C4crops as 4.0–5.8 g MJ–1. However,the results of current research have shown that the actual RdUE of farmland crops is far lower than these theoretical values,and there are great differences in different regions. For example,the RdUE of maize in the United States can reach 3.74–3.84 g MJ–1(Lindquistet al.2005),in China it was reported to be 0.90–1.69 g MJ–1(Jiaet al.2018),however,the RdUE in Mexico was only 0.54–0.68 g MJ–1(Morales Ruizet al.2016). RdUE is mainly influenced by crop genetics. Differences in RdUE between C3and C4plants due to different photosynthetic pathways are obvious. Rice is a C3crop that has been shown to have increased ribulose-1,5-bisphosphate carboxylase/oxygenase (Rubisco) regulation through genetic engineering technology in which introduced traits similar to those found in C4plants (such as CO2concentration mechanism) can improve light interception and canopy photosynthesis,and increase RdUE (Brar and Khush 2013; Braret al.2017). In addition,water and nitrogen supply,planting density,and other agricultural management practices can also affect the RdUE of crops (Hatfield and Dold 2019).
4.Conclusion
Yield gap research has made many achievements in revealing the factors that limit crop yields,thereby improving farmers’ yields. However,the following deficiencies in yield gap research exist:
(1) Lack of standardization. For the same variety in the same region,the potential yield and yield gap obtained in different studies can be very different. This is primarily a result of having no unified standard definition of potential yield,and researchers setting different yield levels corresponding to potential yield based on their specific needs. Additionally,because of differences in research methods,uncertainties in crop models,and the different emphasis of different models,there is a disagreement regarding the quantitative results representing potential yields from modeling.
(2) Poor regional accuracy. Both field trials and model simulations are based on site scale. When expanding the research results to the regional scale,differences in management methods (variety,fertilization,etc.) are usually ignored,but these factors directly affect crop yields.
(3) Incomplete research. Current research focuses on the time and space variability of yield gap,and the increase yield after closing yield gap (e.g.,suppose it reaches 80% of the Yp). However,almost none of them can accurate answer how to close the yield gap. Crop models cannot quantify the effects of yield-limiting factors; and the boundary line analysis method separates the interaction between factors,which is not in line with reality. Therefore,the exploration of yield-limiting factors and ways to close the yield gap almost only appeared in the discussion part of those research papers,as some possibilities were proposed.
(4) Limited effect. The aim of the researchers is mostly to reduce the yield gap to ensure food security. So they pay more attention to the impact of crop management on yield,e.g.,water and nitrogen supply. However,they ignore whether narrowing the yield gap can bring economic benefits to farmers,and whether RUE will decrease after changing crop management. Therefore,farmers are unwilling to follow the suggestions of researchers,which weakens the practical value of research to a certain extent.
Different from the yield gap research,RUE research focuses more on small scale. Except nutrient utilization efficiency,researches on water utilization efficiency and radiation utilization efficiency are mostly based on leaf and canopy scales. And RUE research usually only studies the utilization rate of a single resource. The problem with this approach is that an increase in RUE may be based on the premise that the utilization rate of other resources decreases. For example,yield can be increased by increasing irrigation application amounts. If the input of fertilizers has not increased,then the efficiency of nitrogen use has indeed increased,but it is not clear whether the efficiency of water utilization has improved as well. In addition,there is little research regarding the potential RUE of farmland. What is the gap between the actual and the potential RUE? Knowing the answers to these questions will have great significance for guiding and determining actual production practices used by farmers.
Agricultural production is the result of the interaction of many factors. On the basis of understanding the temporal and spatial changes of the yield gap,comprehensive research on crop management,climate and socioeconomic factors,and quantifying the role of yield-limiting factors in the yield gap will help formulate measures to reduce the yield gap. Machine learning has advantages when dealing with multi-variables and complex data,it will be a good choice to use it to analyze the yield gap. At the same time,regional scale research should be combined with remote sensing of normalized vegetation index (NDVI),enhanced vegetation index (EVI) and other data to assist in correcting and improving simulation processes in crop models. Combining results from controlled field experiments with regional statistical data can also be used to improve the accuracy of regional model simulations. By dating new methods and data,rather than just using model simulations,it will help us make suggestions that are more acceptable to farmers to achieve the two goals of high yield and high efficiency.
Acknowledgements
This work was supported by the National Key Research and Development Program of China (2016YFD0300100),the Innovation Program of Chinese Academy of Agricultural Sciences and the Elite Youth Program of the Chinese Academy of Agricultural Science. We thank Prof.Yang Xiaoguang (China Agricultural University) for thoughtful comments on this manuscript.
Appendicesassociated with this paper can be available on http://www.ChinaAgriSci.com/V2/En/appendix.htm
杂志排行
Journal of Integrative Agriculture的其它文章
- Closing crop yield and efficiency gaps for food security and sustainable agriculture
- lmproving maize grain yield by formulating plant growth regulator strategies in North China
- lmproving winter wheat grain yield and water-/nitrogen-use efficiency by optimizing the micro-sprinkling irrigation amount and nitrogen application rate
- Effects of deep vertical rotary tillage on the grain yield and resource use efficiency of winter wheat in the Huang-Huai-Hai Plain of China
- Effects of mechanized deep placement of nitrogen fertilizer rate and type on rice yield and nitrogen use efficiency in Chuanxi Plain,China
- lmproving grain yield,nitrogen use efficiency and radiation use efficiency by dense planting,with delayed and reduced nitrogen application,in double cropping rice in South China